|
Rainfall |
It was a very wet November for eastern and inland parts of the South Island, with many locations recording at least double the normal rainfall for the time of year. Rainfall was well above normal (>149% of normal) in eastern and inland parts of Otago, Canterbury, Southland, Wairarapa and Hawke’s Bay. Rainfall was mostly above normal (120-149% of normal) in remaining parts of these provinces, as well as Northland, Auckland, western Bay of Plenty, Gisborne and Wellington. In contrast, rainfall was well below normal rainfall (<50% of normal) in Nelson and Tasman, and below normal (50-79% of normal) in western parts of New Zealand including Fiordland, Whanganui, Taranaki and Taihape. |
|
Temperature |
Temperatures were above average (0.51-1.20°C above average) for western and southernmost parts of the South Island, Auckland, Wellington, Hawke’s Bay, Manawatu, Whanganui and the Kapiti Coast. Temperatures were below average (0.51-1.20°C below average) in eastern and inland parts of Otago and Canterbury including Oamaru, Ranfurly and the Mackenzie Country. |
|
Soil Moisture |
As of 1 December, soils were significantly wetter than normal for the time of year across large parts of the eastern and inland South Island, as well as the eastern North Island. Soil moisture levels were lower than normal for the time of year in Nelson, Tasman, Whanganui, the central Plateau, and parts of the West Coast. |
Overview
November 2018 was characterised by higher than normal sea level pressure to the south of the country, and lower than normal sea level pressure over the Tasman Sea. This pressure setup led to more northeasterlies than normal.
Many eastern and inland parts of New Zealand received exceptionally high rainfall during November, which contributed to damaging flood events during the month. Particularly notable rainfall occurred in Otago, where several locations observed their highest November rainfall in at least 100 years of records. It was an unsettled month of weather overall, with frequent periods of atmospheric instability contributing to many days of thunderstorm activity (see Highlights and extreme events for further details).
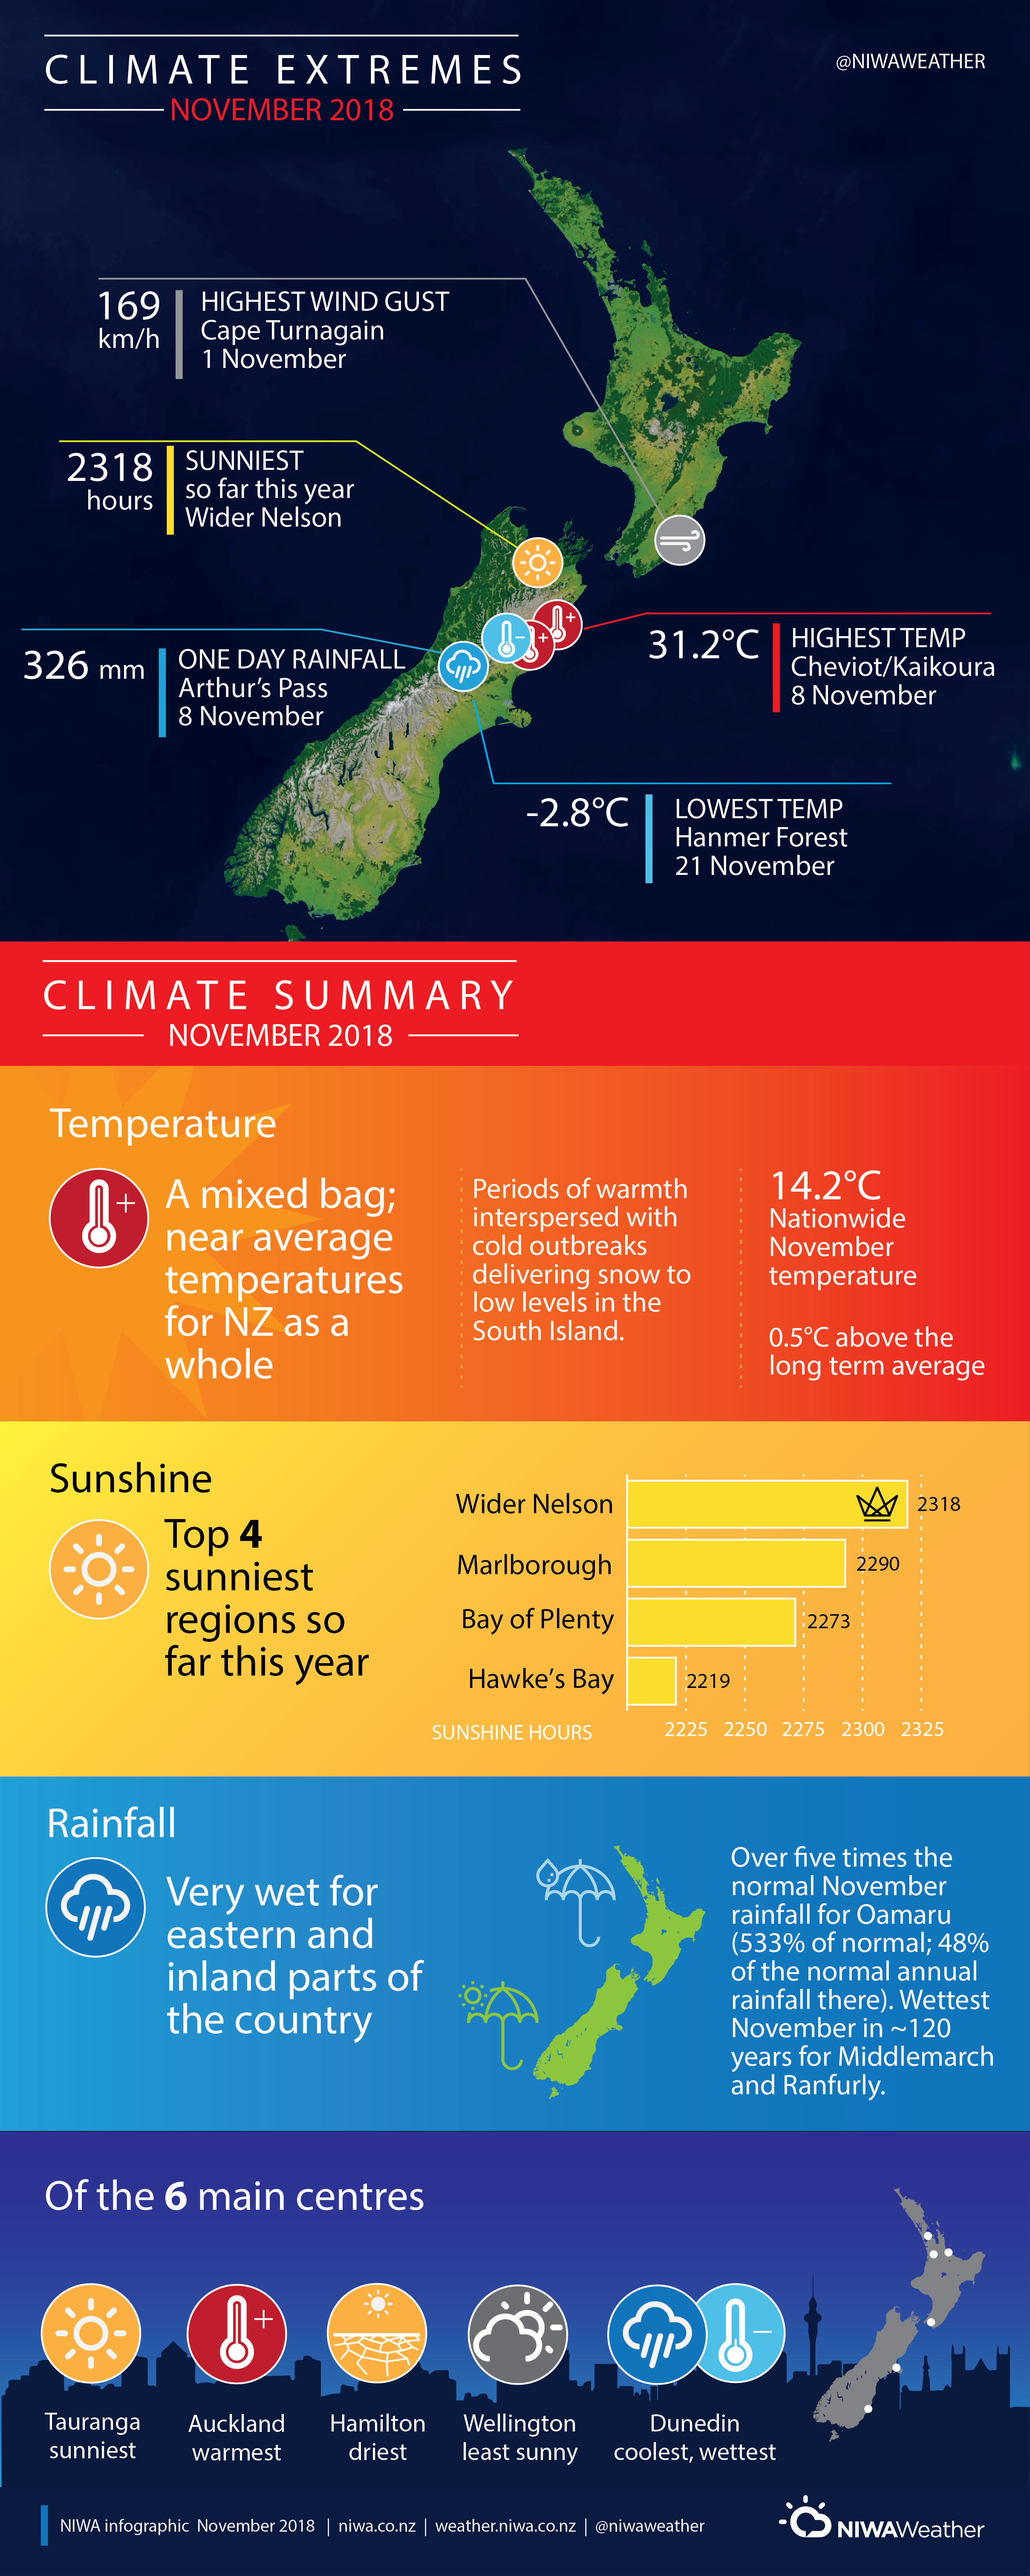
Temperatures during the month were a mixed bag, with periods of warmth offset by cold outbreaks that delivered relatively heavy snow to low elevations in the South Island. Overall, the nationwide average temperature in November 2018 was 14.2°C (0.5°C above the 1981-2010 November average from NIWA’s seven station temperature series which begins in 1909).
Further highlights
- The highest temperature was 31.2°C, observed at Cheviot and Kaikoura on 8 November.
- The lowest temperature was -2.8°C, observed at Hanmer Forest on 21 November.
- The highest 1-day rainfall was 326 mm, recorded at Arthur’s Pass on 8 November.
- The highest wind gust was 169 km/h, observed at Cape Turnagain on 1 November.
- Of the six main centres in November 2018, Auckland was the warmest, Wellington was the least sunny, Dunedin was the coldest and wettest, Hamilton was the driest, and Tauranga was the sunniest.
- Of the available, regularly reporting sunshine observation sites, the sunniest four locations in 2018 so far (1 January – 30 November) are Wider Nelson (2318 hours), Marlborough (2290 hours), Bay of Plenty (2273 hours) and Hawke’s Bay (2219 hours).
- Of the available, regularly reporting low elevation rainfall sites, the two wettest locations in 2018 so far (1 January – 30 November) are Milford Sound (6341 mm) and Arthur’s Pass (4398 mm). The two driest locations in 2018 so far are Clyde (481 mm) and Cromwell (504 mm).
Downloads
November 2018 climate summary information [PDF 800KB]
November 2018 climate statistics [PDF 80KB]
Contact
Gregor Macara, Climate Scientist Tel. 04 386 0509