
El Niño Southern Oscillation: what is it?
El Niño and La Niña are opposite phases of the El Niño Southern Oscillation (ENSO), a naturally occurring global climate cycle.
ENSO is one of the most important drivers of year-to-year climate variability across the globe, including New Zealand. It influences temperatures, rainfall patterns, drought risk, storm tracks, and the likelihood of extreme weather events. El Niño and La Niña episodes occur on average every few years and last up to around a year or two.
During an El Niño, sea surface temperatures in parts of the central and eastern tropical Pacific become warmer than average. These changes are accompanied by atmospheric shifts, including changes in air pressure, trade winds, cloud cover, and rainfall patterns.
During a La Niña, the opposite occurs. Sea surface temperatures in the tropical Pacific become cooler than average and the atmospheric circulation strengthens in the opposite direction.
Between these two phases lies ENSO-neutral conditions, when the ocean-atmosphere system does not exhibit a strong El Niño or La Niña signal. Although ENSO originates thousands of kilometres away from New Zealand, it can significantly influence our climate by altering atmospheric circulation patterns across the Pacific basin.
El Niño
During an El Niño event, ocean water off the coast of South America to the central tropical Pacific warms above average. The warming occurs because the trade winds (the east-to-west prevailing winds that flow around the equator) weaken or even reverse, blowing warm water from the western Pacific toward the east. As a result, sea temperatures in the far western Pacific can cool below average. The unusually warm water in the eastern Pacific shifts the Walker circulation eastward, moving the areas of rising air, cloud, and heavy rainfall away from their usual locations. This change affects weather patterns around the world, making some regions wetter than normal and others drier than normal.
El Niño’s average influence on New Zealand
While we know the average outcome of El Niño because of historical data, no El Niño is average, each comes with a unique set of climate characteristics and therefore can be expected to influence the weather differently.
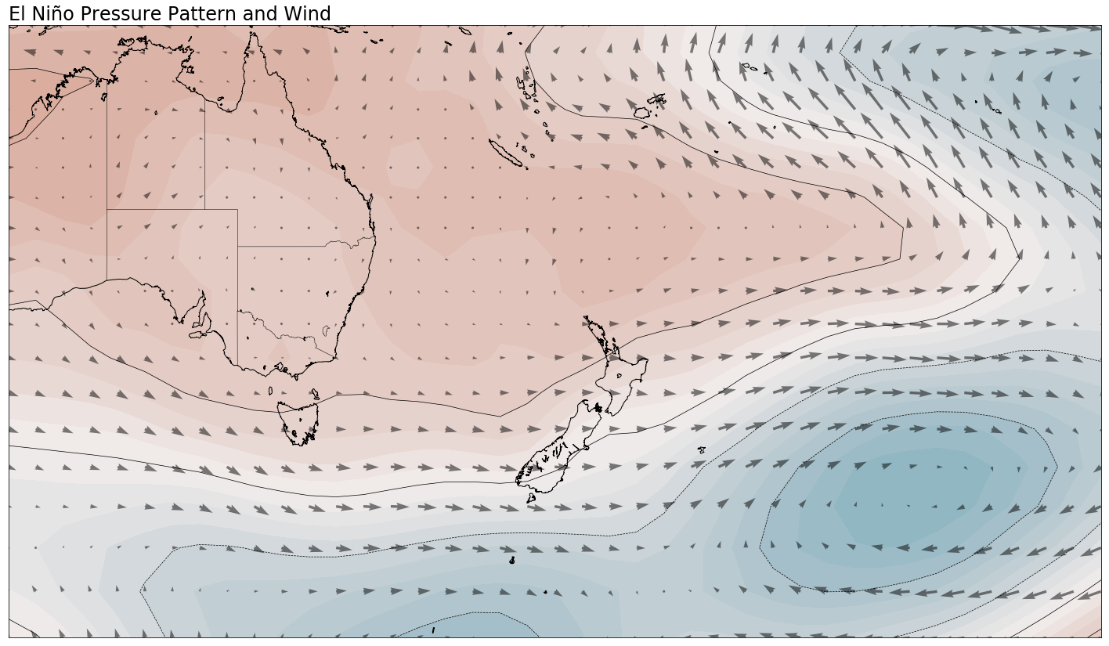
During El Niño, New Zealand tends to experience stronger or more frequent winds from the west in summer, which can encourage dryness in eastern areas and more rain in the west. In winter, the winds tend to blow more from the south, causing colder temperatures across the country. In spring and autumn, southwesterly winds are more common.
La Niña
During a La Niña event, ocean water off the coast of South America to the central tropical Pacific cools to below average temperatures. This cooling occurs because of stronger than normal easterly trade winds, which churns cooler, deeper sea water up to the ocean’s surface. The unusually cool water in the eastern Pacific influences the Walker Circulation and suppresses cloud, rain, and thunderstorms. This change impacts weather patterns around the world, but in a different way than El Niño does.
La Niña’s average influence on New Zealand
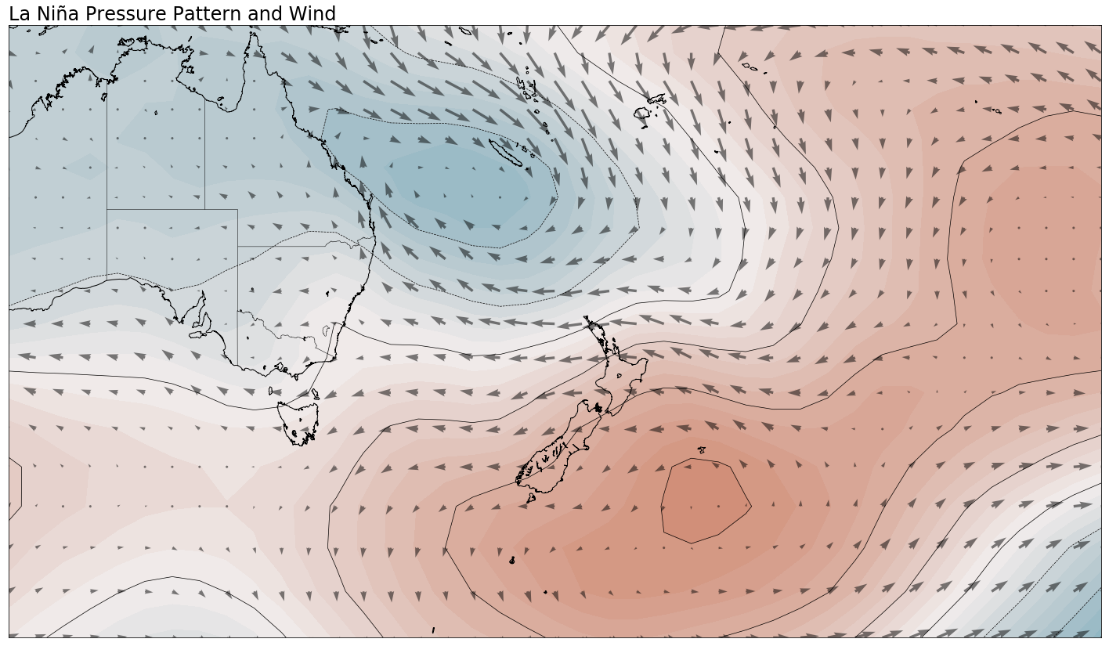
Northeasterly winds tend to become more common during La Niña events, bringing moist, rainy conditions to northeastern areas of the North Island and reduced rainfall to the lower and western South Island. Warmer than average air and sea temperatures can occur around New Zealand during La Niña.
How we monitor ENSO
Monitoring ENSO requires continuous observation of both the ocean and the atmosphere.
At Earth Sciences New Zealand, we use multiple datasets that provide near real-time information about conditions across the tropical Pacific Ocean and beyond. Each dataset provides a different piece of the puzzle.
Sea Surface Temperature (SST)
Sea surface temperatures in the Pacific region are one of the most important indicators of ENSO.
Earth Sciences New Zealand routinely uses:
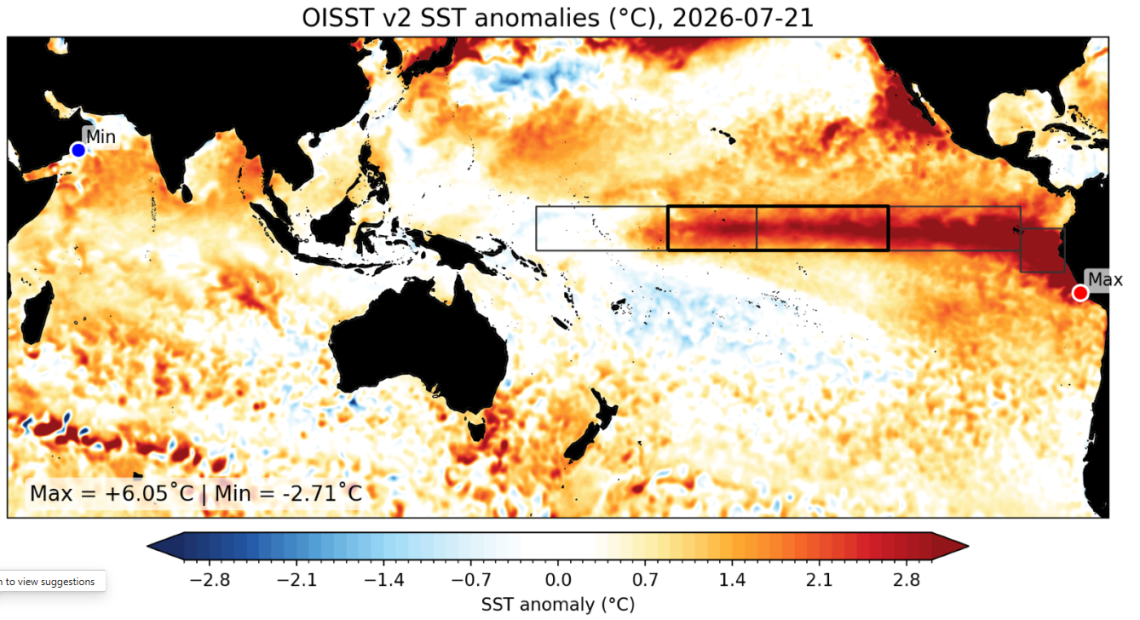
- OISST (Optimum Interpolation Sea Surface Temperature), which provides daily high-resolution analyses of sea surface temperature.
- ERSST (Extended Reconstructed Sea Surface Temperature), a long-term historical dataset used extensively in climate research.
These datasets allow us to monitor temperature anomalies (differences from average) across the tropical Pacific and calculate the various Niño indices we use to measure ENSO.
Southern Oscillation Index (SOI)
ENSO is not just an ocean phenomenon; it also has a critical atmospheric component.
One of the longest-running atmospheric indicators is the Southern Oscillation Index (SOI), developed from pioneering work by Sir Gilbert Walker in the early twentieth century.
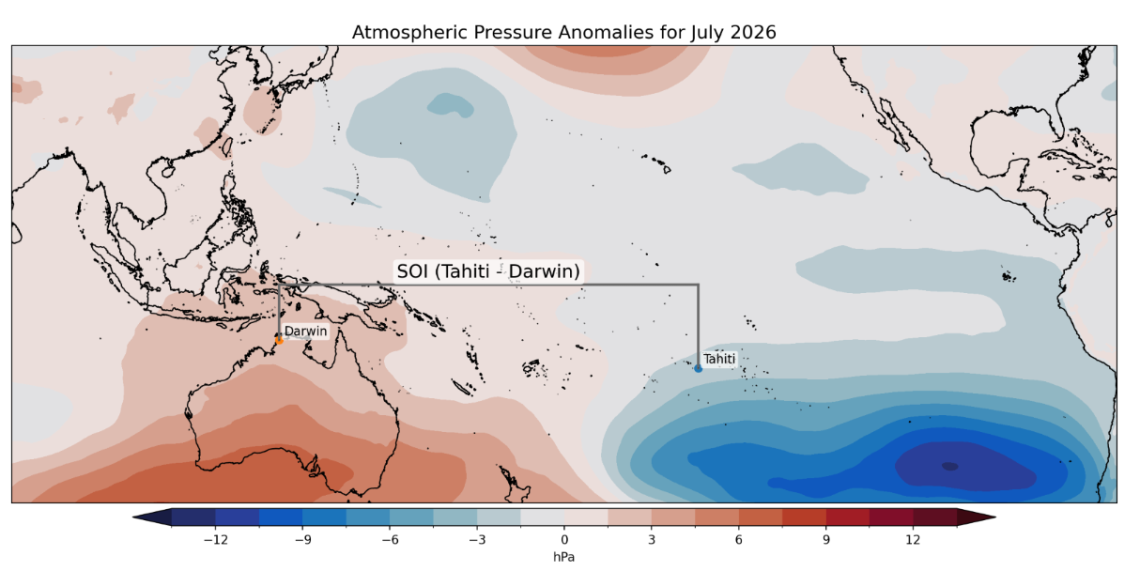
The SOI measures differences atmospheric pressure between Tahiti and Darwin. Sustained negative values are typically associated with El Niño conditions, while sustained positive values are associated with La Niña.
Atmospheric reanalysis data
Earth Sciences New Zealand makes extensive use of the ERA5 atmospheric reanalysis produced by the European Centre for Medium-Range Weather Forecasts (ECMWF).
From ERA5 we monitor variables such as:
- Atmospheric pressure anomalies and pressure gradients
.
- Velocity potential anomalies (which relate to areas of ascending and descending air in the atmosphere, i.e. the ‘Walker Circulation’ mentioned above).
- Large-scale atmospheric circulation patterns.
These diagnostics help determine whether the atmosphere is responding to, and reinforcing, changes occurring in the ocean.
Subsurface ocean conditions
The tropical Pacific Ocean is a three-dimensional system. What happens beneath the surface is often just as important in indicating developing El Niño or La Niña as what we observe at the surface.
In many cases, changes in subsurface ocean temperatures can precede changes at the surface by several weeks or even months. Large pools of unusually warm or cool water can develop below the surface and subsequently rise (“upwell”) to influence sea surface temperatures and atmospheric circulation. As a result, subsurface observations can provide valuable early warning of developing El Niño or La Niña conditions.
Earth Science New Zealand uses analyses such as ARMOR3D to monitor:
- Subsurface temperature anomalies – areas of unusually warm or cool water below the surface.
- Ocean heat content anomalies – the amount of excess heat stored in the upper ocean.
- The vertical structure of the tropical Pacific Ocean – including the depth and tilt of the thermocline, the boundary separating warmer surface waters from colder deep waters.
These observations help us answer important questions:
Is an El Niño or La Niña event likely to strengthen or weaken?
Is there sufficient heat stored below the surface to sustain warming at the surface?
Are emerging subsurface conditions consistent with what climate models are forecasting?
How persistent might the current ENSO phase be?
How we measure ENSO
Unlike measuring the temperature of a cup of tea, ENSO cannot be fully described by a single number. ENSO is a coupled ocean-atmosphere phenomenon involving multiple interacting processes operating over thousands of kilometres.
Scientists have developed several indices, each summarising a different aspect of the system, to track ENSO conditions consistently through time.
Niño indices
The Niño indices measure sea surface temperature anomalies within specific regions of the tropical Pacific Ocean.
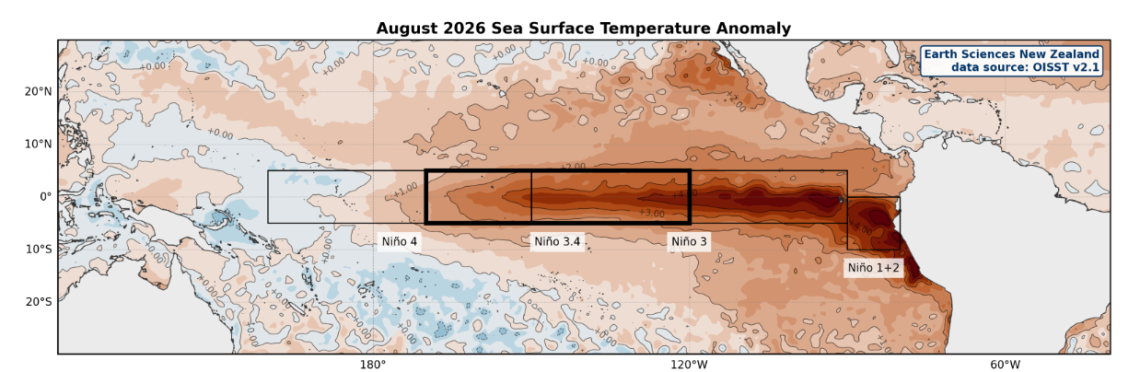
The most widely used is the Niño 3.4 index, which averages sea surface temperature anomalies over a large area of the central tropical Pacific.
These indices primarily capture the oceanic component of ENSO.
Southern Oscillation Index (SOI)
The SOI captures the atmospheric component of ENSO by measuring pressure differences between Tahiti and Darwin.
Equatorial Oscillation Index (EOI)
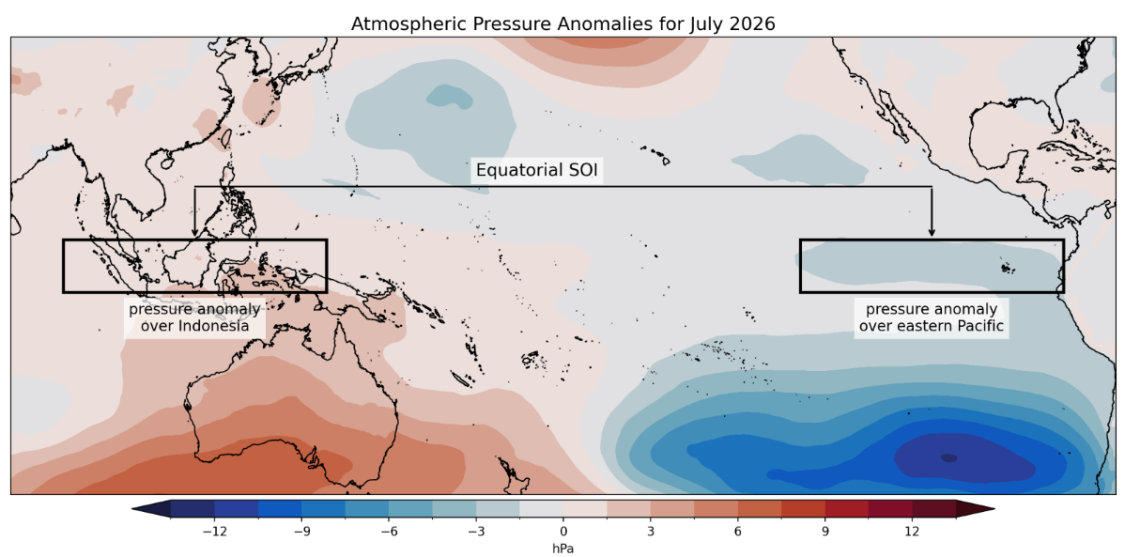
The Equatorial Oscillation Index is another atmospheric metric that focuses on pressure anomalies along the equatorial Pacific.
The Relative Oceanic Niño Index (RONI)
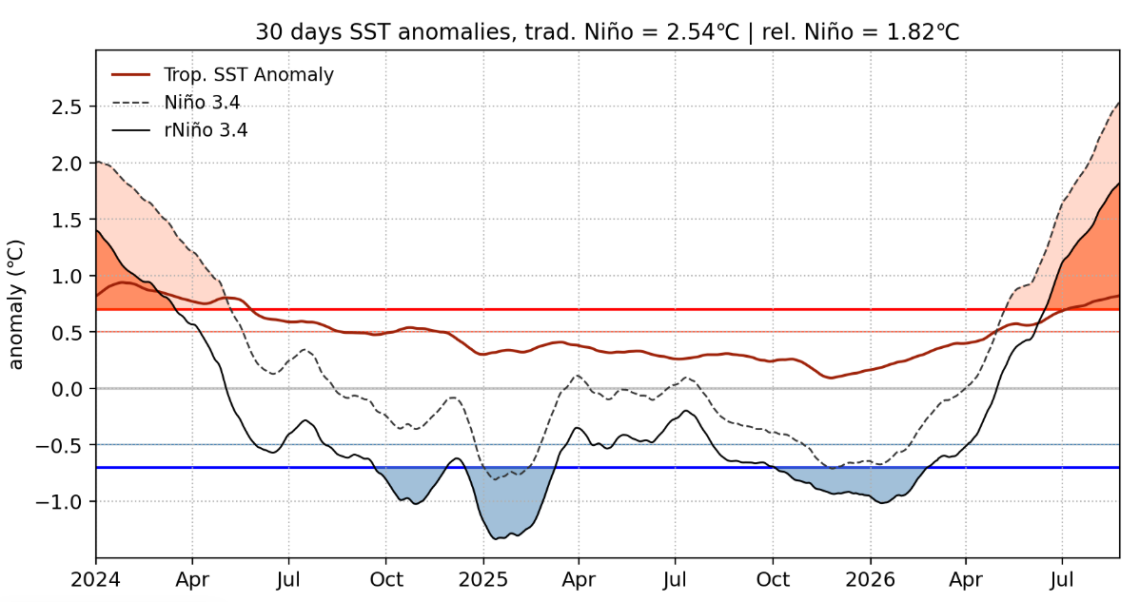
In 2025 Earth Science New Zealand adopted the Relative Oceanic Niño Index (RONI).
The RONI was developed to better isolate ENSO-related ocean temperature anomalies from the broader background warming trend.
At Earth Science New Zealand, the RONI plays an important role in both ENSO monitoring and ENSO forecasting.
What thresholds do we use?
There isn’t one globally accepted definition of El Niño or La Niña. Different organisations use different indices, time periods for making the assessment, and thresholds.
An ENSO "declaration" is not equivalent to, for example a government drought declaration or state of emergency. It is a scientific assessment that certain pre-defined criteria have been met.
Importantly, an ENSO declaration does not automatically imply impacts for New Zealand. Local impacts depend on many other factors and must be assessed separately.
At Earth Science New Zealand, ENSO classification incorporates both oceanic and atmospheric indicators:
- The 30-day RONI anomaly must reach or exceed +0.7°C for El Niño conditions (or reach or fall below −0.7°C for La Niña conditions).
- The SOI must simultaneously indicate an atmospheric response consistent with the ENSO phase, or below -1 for El Niño.
This approach recognises that New Zealand lies well outside the tropical Pacific ENSO core region. For ENSO to influence our climate, both the ocean and atmosphere generally need to be participating in the event.
Who declares ENSO?
There is no single global authority responsible for declaring ENSO.
Instead, multiple meteorological and climate agencies around the world independently monitor ENSO and apply their own operational criteria.
Examples include:
- Earth Sciences New Zealand.
- NOAA's Climate Prediction Centre (United States).
- The Australia's Bureau of Meteorology (BoM).
- The Japan Meteorological Agency.
- The World Meteorological Organization and its global climate monitoring partners.
Although methodologies differ slightly, these organisations typically reach similar conclusions because they are observing the same underlying climate system.
At Earth Science New Zealand, ENSO assessments are discussed as part of the Seasonal Climate Outlook (SCO) process. These discussions bring together meteorologists, climate scientists, oceanographers, and forecasters to evaluate all available evidence before issuing an official declaration alongside the SCO.
Forecasting ENSO
While monitoring relies on observations, forecasting relies on sophisticated climate models that simulate the coupled behaviour of the ocean and atmosphere.
Earth Science New Zealand uses a range of global climate model systems, with a particular emphasis on the Copernicus Climate Change Service (C3S) Multi-Model Ensemble (MME) forecasting system.
It is important to remember that all ENSO forecasts contain uncertainty.
ENSO is a complex and evolving climate phenomenon, and small differences in initial conditions can lead to different future outcomes. Forecast difficulty also varies throughout the year, with predictions generally becoming more challenging during the Southern Hemisphere autumn period, known as the "spring predictability barrier".
For this reason, Earth Science New Zealand communicates ENSO outlooks probabilistically rather than as definitive predictions.
Forecasts should be viewed as assessments of likelihood, not guarantees. As new observations and forecasts become available, those probabilities can and do change.
Copernicus Climate Change Service (C3S) Multi-Model Ensemble (MME) forecasting system
Every month, several gigabytes of forecast data are downloaded and processed locally.
The C3S MME combines forecasts from multiple international modelling centres and currently contains approximately 700 individual ensemble members.
Rather than producing a single forecast, each ensemble member simulates one possible future evolution of the climate system.
For each ensemble member:
- Sea surface temperature forecasts are processed.
- RONI values are calculated.
- Calibration and scaling procedures are applied.
- The future ENSO phase is identified.
The proportion of ensemble members forecasting El Niño, La Niña, or neutral conditions is then calculated.
For example, if:
- 490 ensemble members indicate El Niño,
- 140 indicate neutral conditions,
- and 70 indicate La Niña,
then the forecast probabilities would be:
- El Niño: 70%
- Neutral: 20%
- La Niña: 10%.
This is the basis of the probabilistic ENSO outlooks produced by Earth Science New Zealand. Importantly, these probabilities do not represent certainty. They represent the range of plausible futures simulated by the best climate models currently available.
Monitoring ENSO in a warming climate
In 2025 Earth Sciences New Zealand updated the way we calculate the sea surface temperature indices used to monitor and forecast the state of the ENSO.
This change introduced the relative Niño indices, a new method for measuring sea surface temperatures in the tropical Pacific Ocean related to ENSO. These indices offer a more accurate and consistent way to track ENSO by adjusting for the long-term warming trend in our oceans.
Unlike the traditional Niño indices which measure absolute temperatures and can overstate the frequency of El Niño events, relative Niño indices assess how unusually warm or cool the ocean is compared to the broader tropical region. Tropical rainfall patterns respond to changes in ocean temperatures. This new relative index can therefore help forecasters better determine if the equatorial Pacific is warmer or cooler than the rest of the global tropics – something which has become more challenging to discern as seas warm because of climate change. This provides a clearer picture of the ocean and atmospheric interactions that drive ENSO.
We have not changed the thresholds used to determine El Niño or La Niña events in the Southwest Pacific or the underlying data used to monitor these events.
ENSO is only one part of a complex system that influences New Zealand’s climate. The Seasonal Climate Outlook is the best guide to likely rainfall and temperature outcomes for the season ahead.
New Zealand’s rainfall patterns during past ENSO events
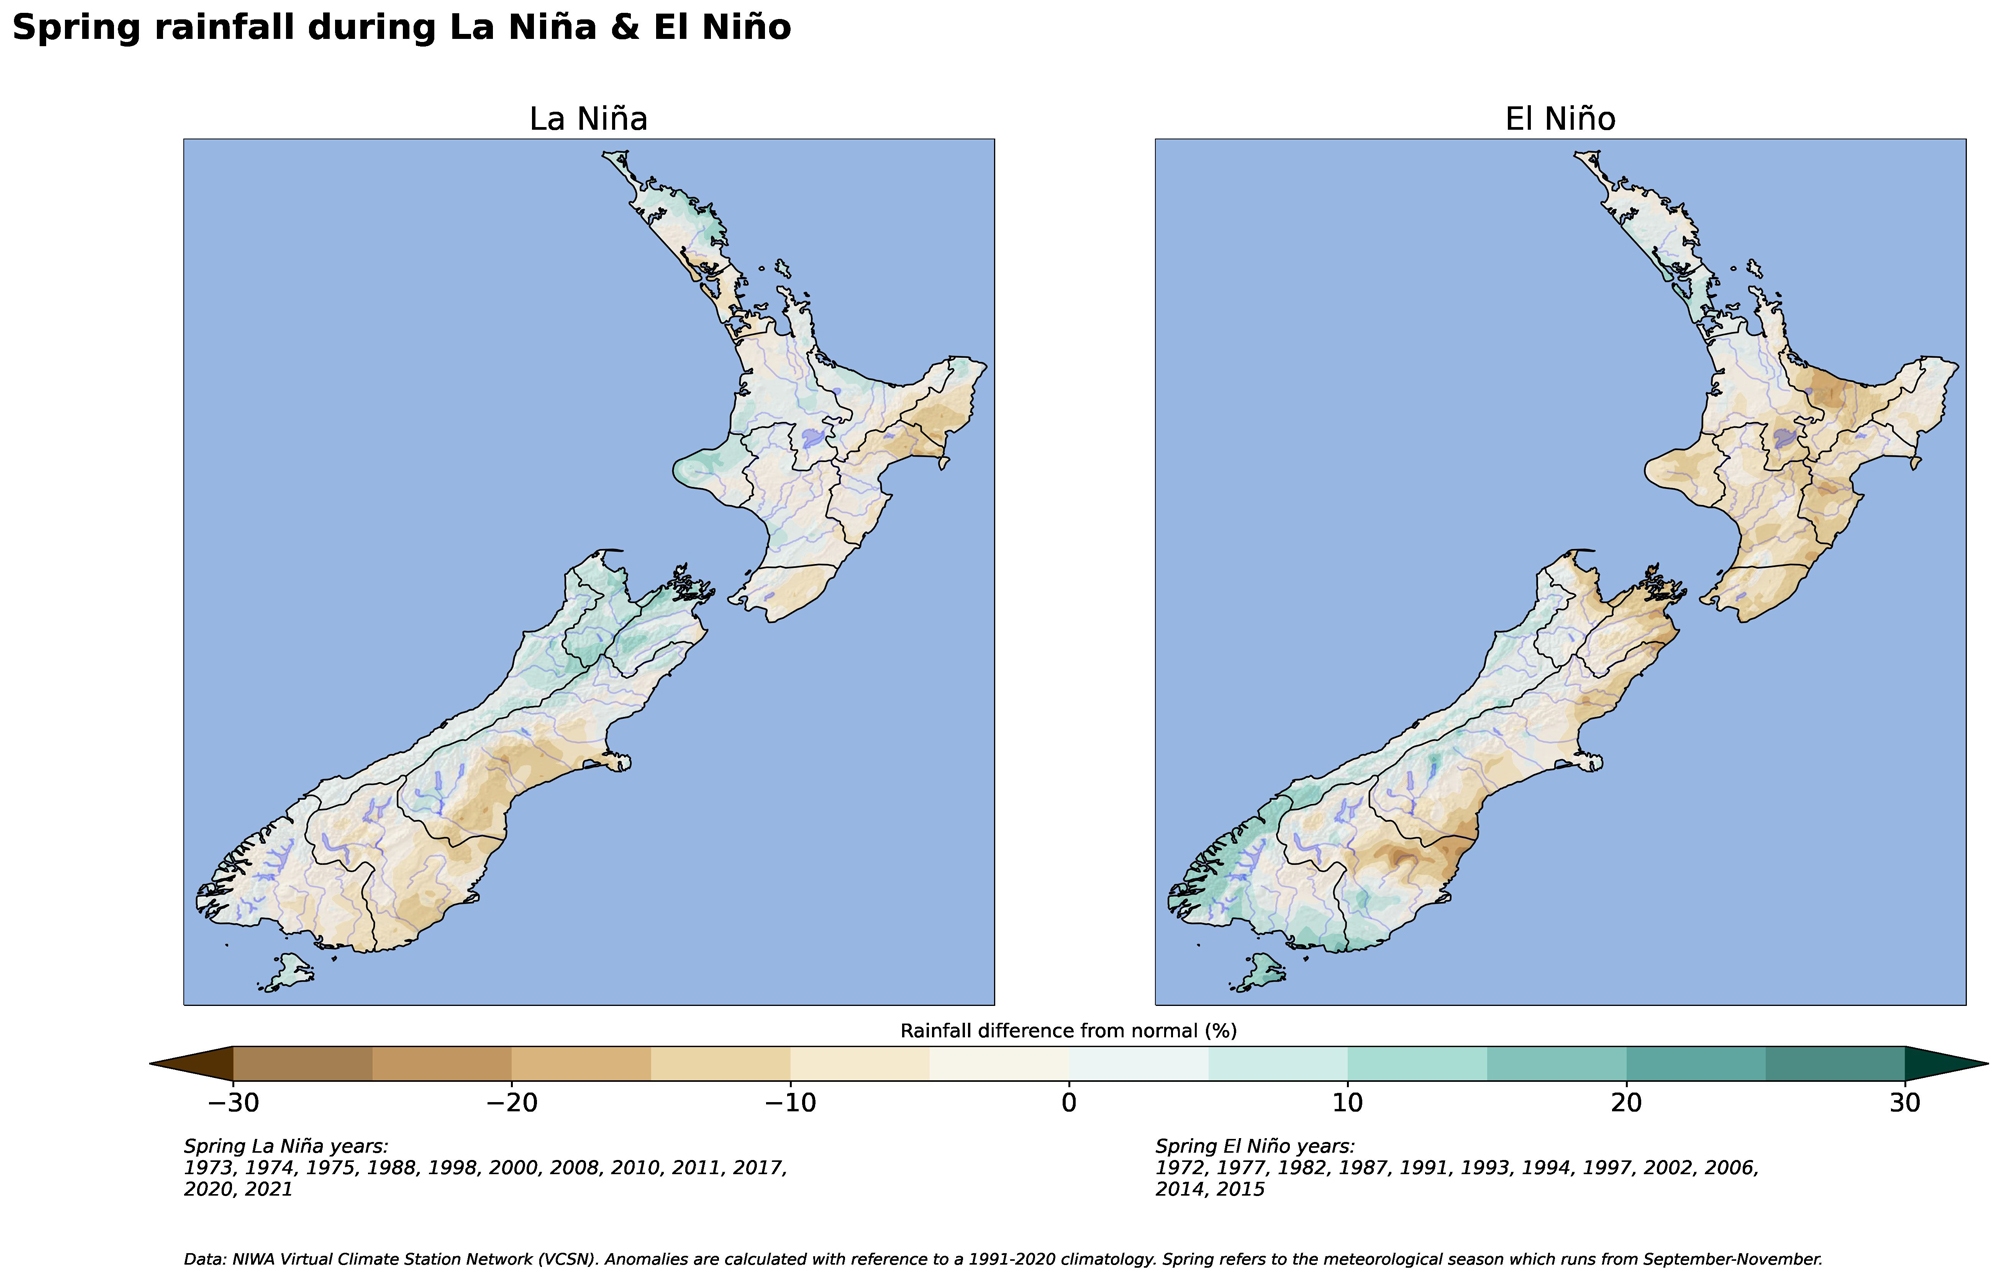
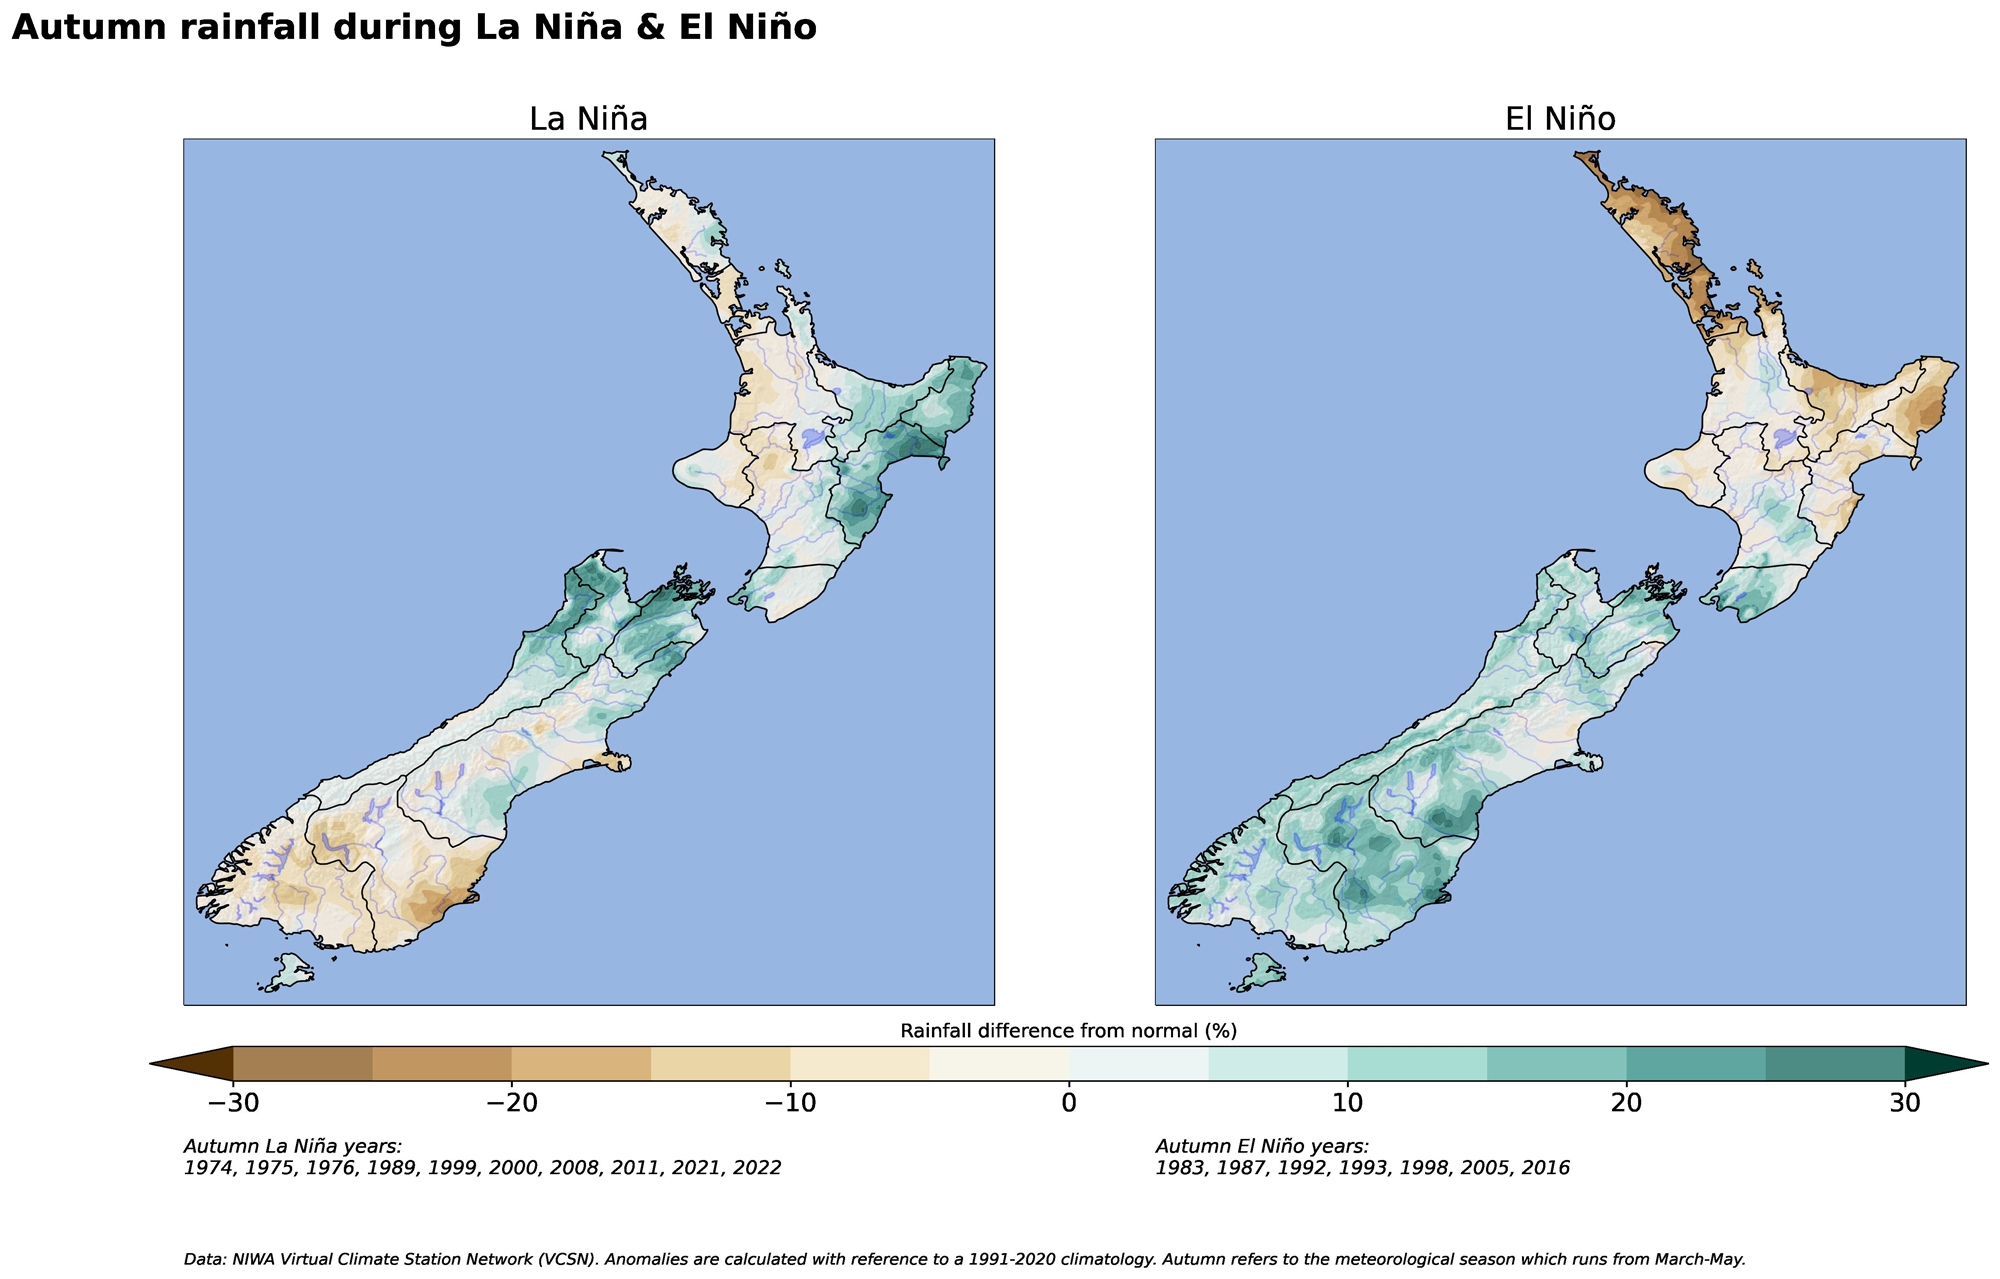
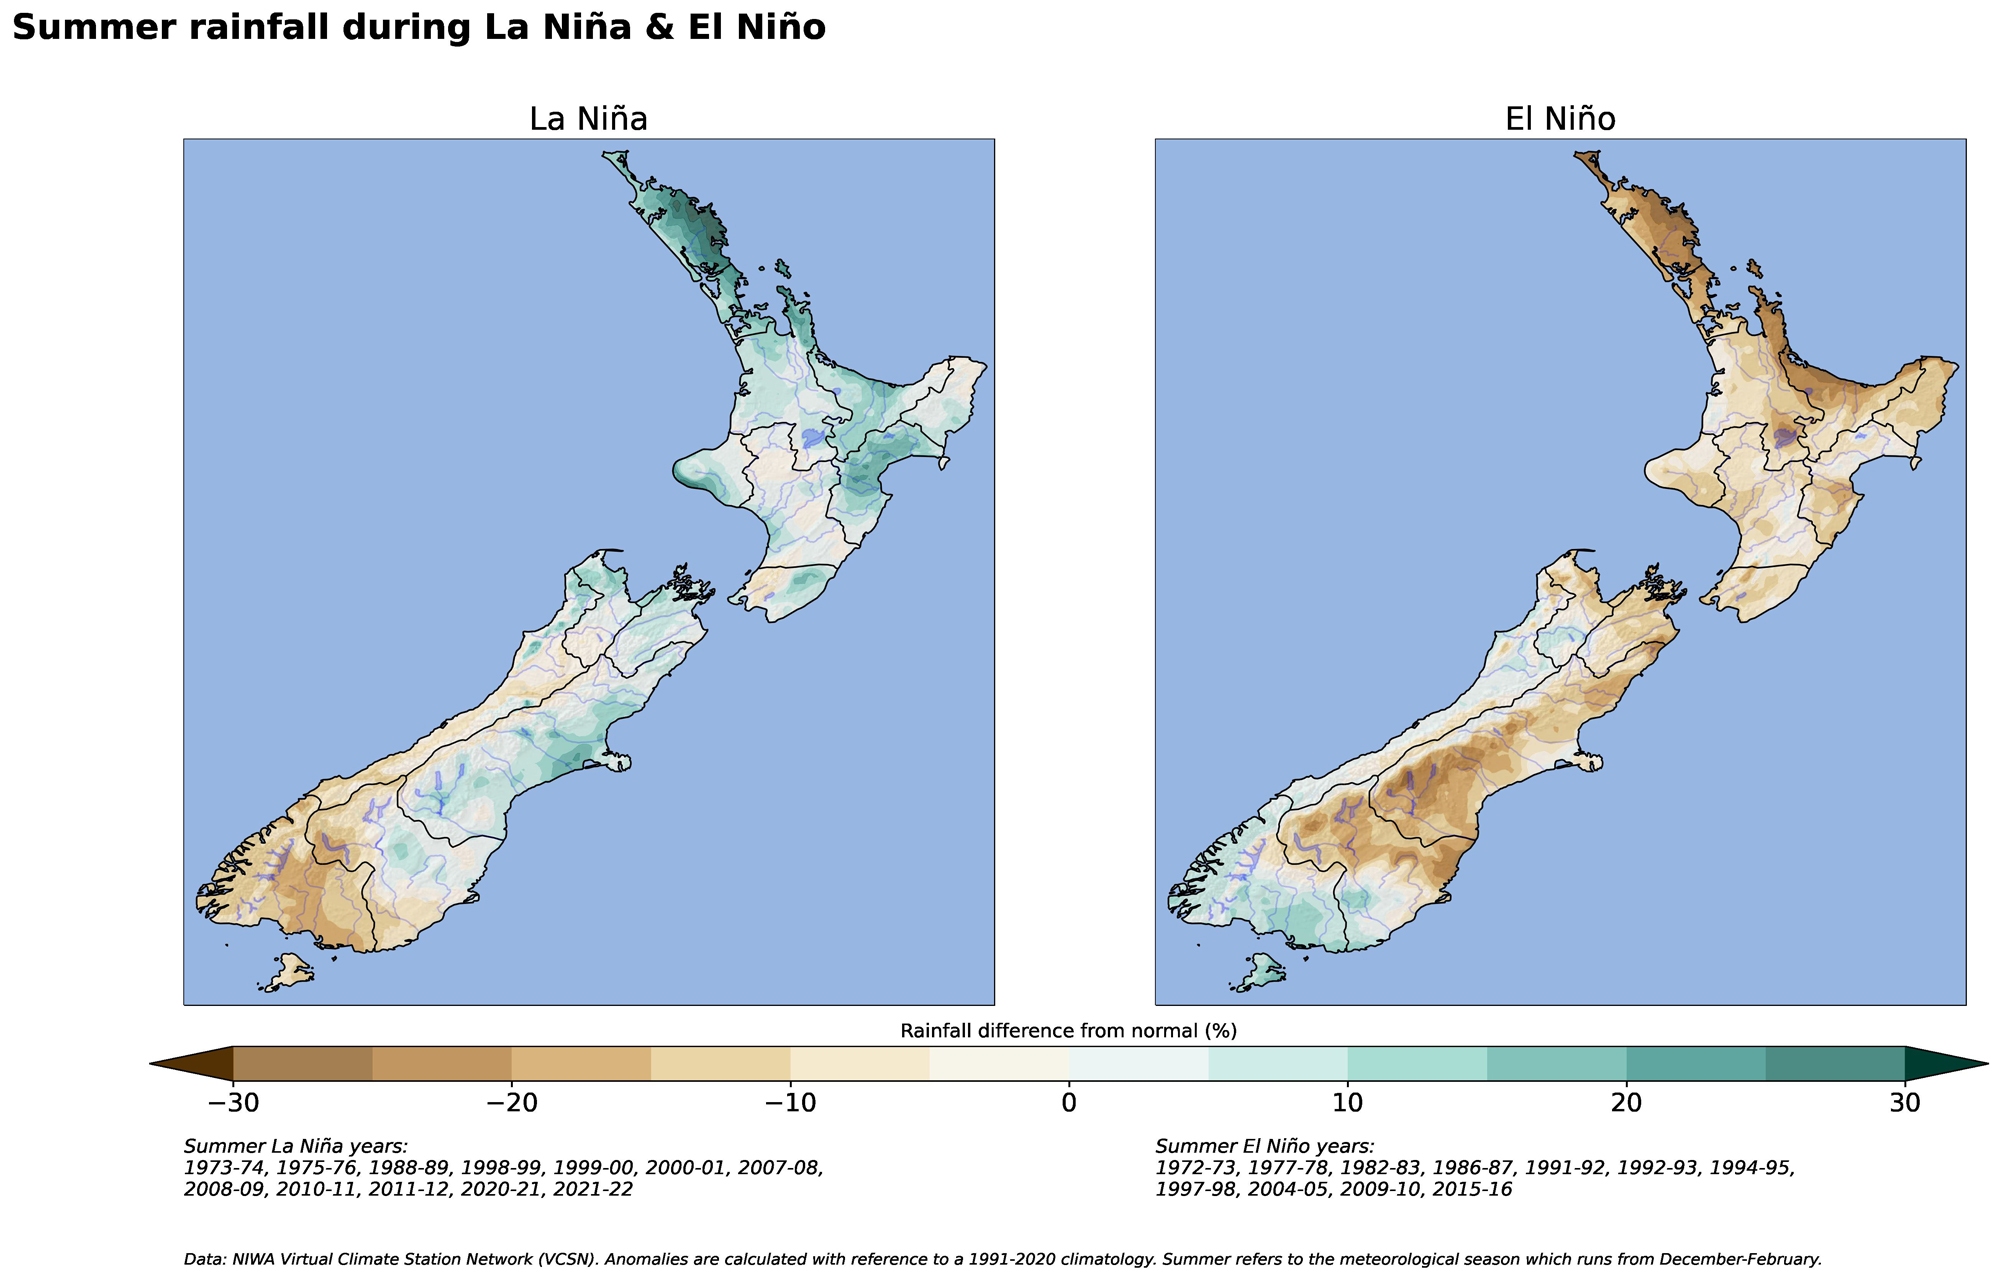
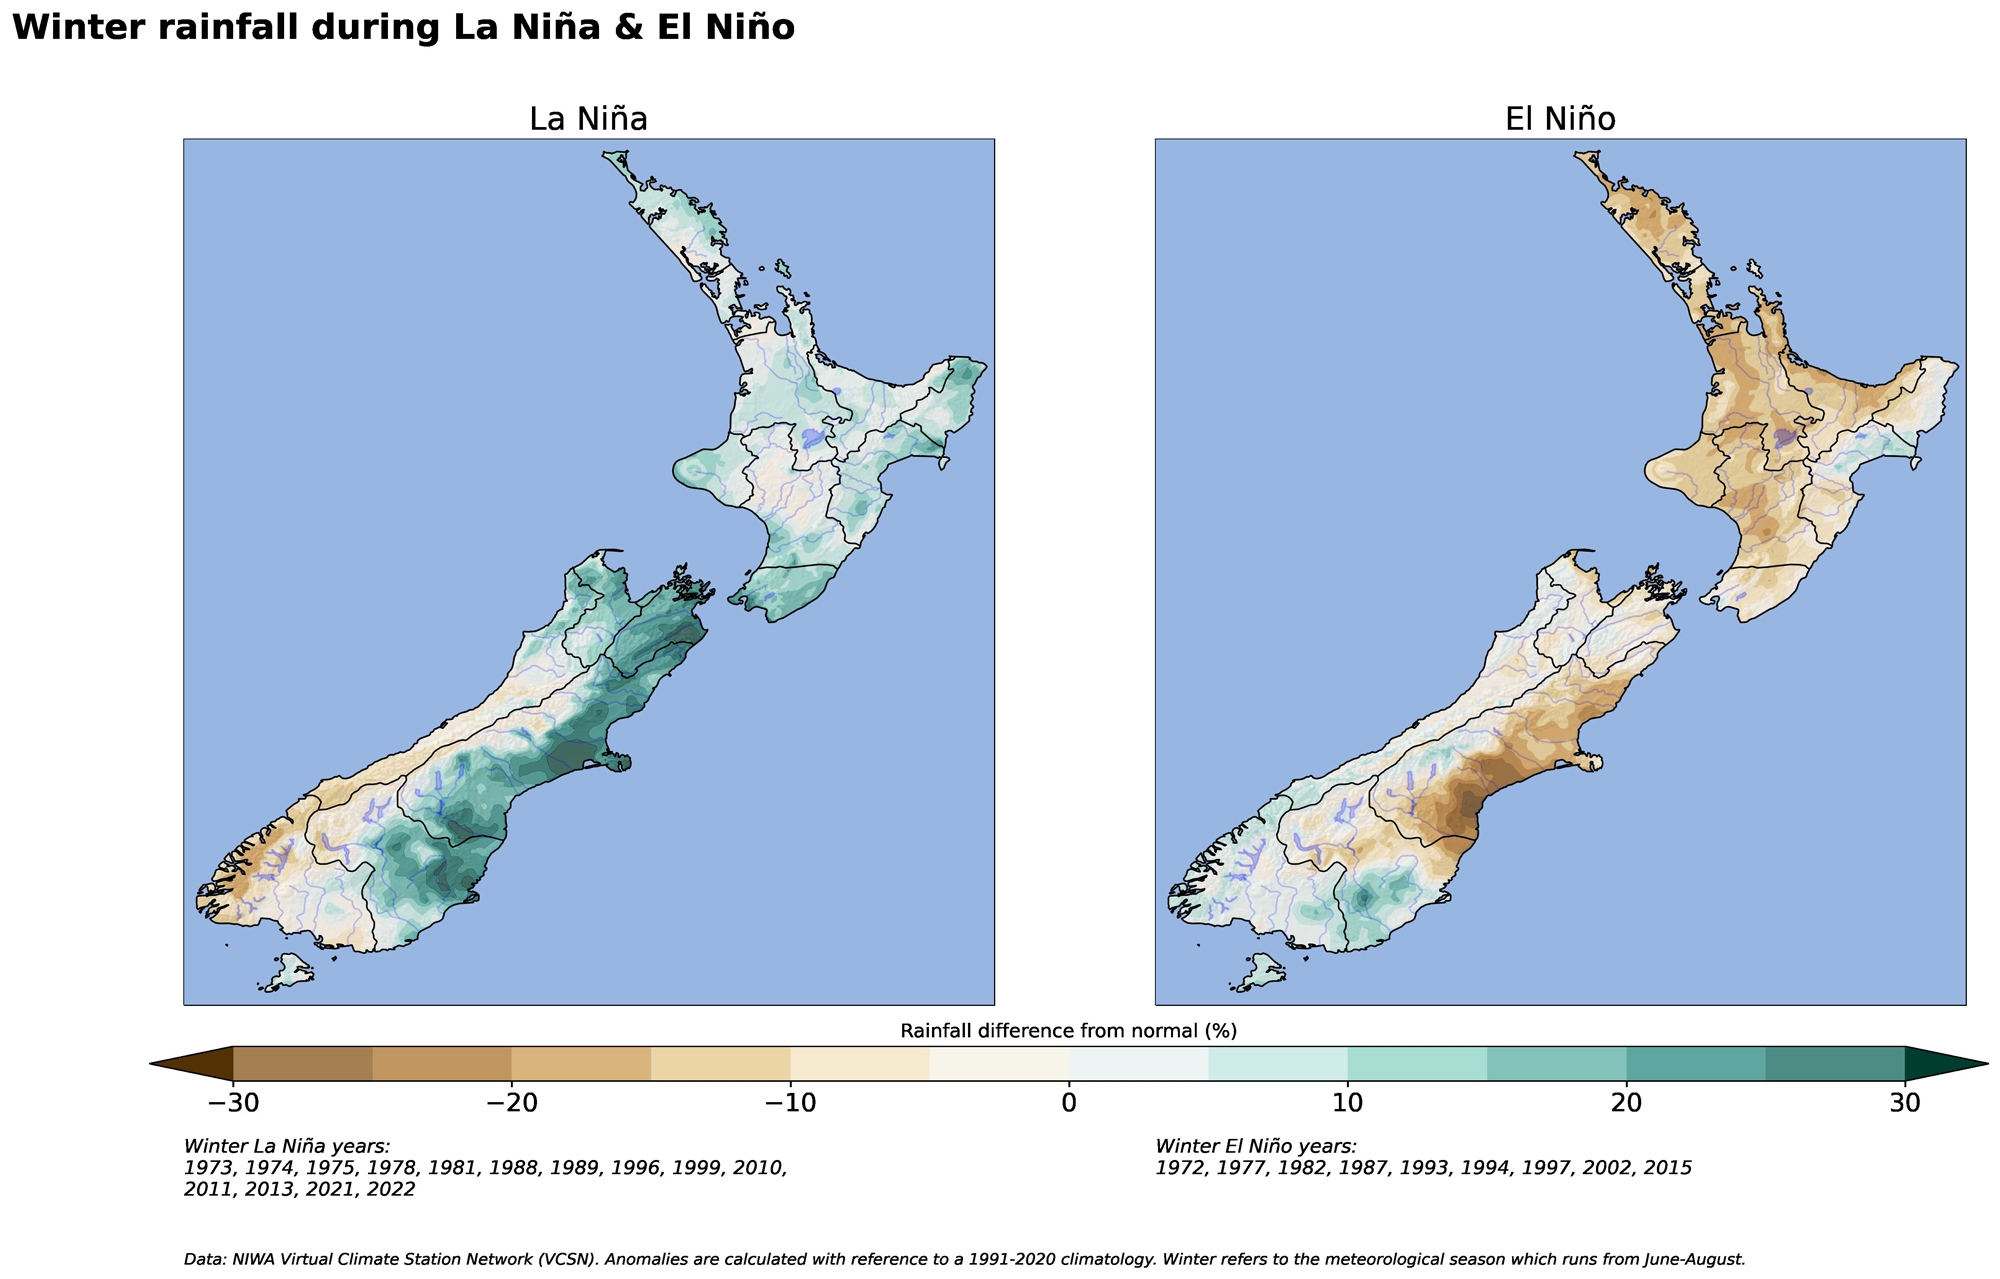
The table and maps below show historical El Niño and La Niña events and average rainfall patterns during these events.
| ENSO events | Years |
|---|---|
| Summer – El Niño | 1972-73, 1977-78, 1982-83, 1986-87, 1991-92, 1992-93, 1994-95, 1997-98, 2004-05, 2009-10, 2015-16 |
| Summer – La Niña | 1973-74, 1975-76, 1988-89, 1998-99, 1999-00, 2000-01, 2007-08, 2008-09, 2010-11, 2011-12, 2020-21, 2021-22 |
| Autumn – El Niño | 1983, 1987, 1992, 1993, 1998, 2005, 2016 |
| Autumn – La Niña | 1974, 1975, 1976, 1989, 1999, 2000, 2008, 2011, 2021, 2022 |
| Winter – El Niño | 1972, 1977, 1982, 1987, 1993, 1994, 1997, 2002, 2015 |
| Winter – La Niña | 1973, 1974, 1975, 1978, 1981, 1988, 1989, 1996, 1999, 2010, 2011, 2013, 2021, 2022 |
| Spring – El Niño | 1972, 1977, 1982, 1987, 1991, 1993, 1994, 1997, 2002, 2006, 2014, 2015 |
| Spring – La Niña | 1973, 1974, 1975, 1988, 1998, 2000, 2008, 2010, 2011, 2017, 2020, 2021 |
Useful links
Further reading:
-
The impact of El Niño and La Niña on New Zealand's climate
El Niño accounts for less than 25 percent of the year-to year variance in seasonal rainfall and temperature at most locations in New Zealand. -

El Niño maps and charts
View a collection of maps showing the impact of past El Niño and La Niña events. -

Seasonal Climate Outlook
Publication seriesAir temperature, rainfall, soil moisture and river flow predictions for the coming season.