The Brief La Niña of 2005-06 and the El Niño of 2006-07
Anthony G. Barnston, International Research Institute for Climate and Society (IRI)

Historically since 1950, ENSO episodes have tended to occur with approximately one-year duration, often beginning near April-July of one year and ending near March-May of the following year. Exceptions have occurred. Until 2005, however, there was never a decrease from a near-zero Nino3.4 SST anomaly in SON to an anomaly in DJF suffi cient to be considered a La Niña, such as -0.5°C or stronger. This happened in 2005- 06 for the fi rst time. What caused the rare cold event development in late 2005 at a time of year when the ENSO state is normally stable?
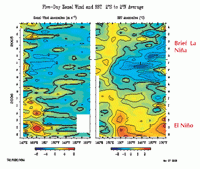
During early September 2005, negative SST anomalies began to develop off the west coast of South America and extended west. A high pressure anomaly centered over northern Argentina and Chile led to strong southeast trades and cross-equatorial flow, and increased coastal and equatorial upwelling. Larger-scale easterly wind anomalies subsequently developed along the equator in middle to late November in response to the anomalous east-to-west SST anomaly gradient. In December the spatial extent became suffi cient to impact the Nino3 and then even the Nino3.4 SST anomalies, leading to a more basin-wide coupling with the atmosphere. La Niña SST conditions became established by early December, and continued for three to four months. There were no obvious precursors to the event from 100°W westward (Fig. 1), as the winds and SSTs began their cold phase behavior approximately concurrently, and eased back to neutral in much the same way nearly four months later.
None of the statistical ENSO prediction models, and only a few of the dynamical models anticipated the event even by November. By January 2006, most models recognized the cooled initial conditions and cooled their early 2006 predictions accordingly. Based on the Niño 3.4 SST index, La Niña SST conditions endured from early December through mid-March. La Niña-like climate responses were evident during DJF, when there were positive rainfall anomalies in most of Indonesia, southeast Asia, the Philippines, part of southern Africa, and northwestern U.S.; and negative anomalies in the central and eastern tropical Pacific, and southern U.S. This supports the notion that ENSO conditions need not endure for multiple seasons in order to have signifi cant impacts on the climate. Interestingly, maps of OLR (not shown) suggested La Niña-like anomalous convection patterns several months earlier than when the SST anomaly in the Niño3.4 region became negative.
The El Niño of 2006-07
Upon return to near-neutral ENSO conditions in April 2006, the ENSO state remained neutral, but moved toward warmer conditions through most of August both in terms of SST and subsurface equatorial Pacifi c heat content. Because El Niño episodes typically begin before September, during August it was assumed by many climate forecasters that neutral conditions were most likely for the rest of 2006 and into early 2007.Two signifi cant westerly wind bursts that occurred in August and October, respectively, were thought to have occurred too late to tip the balance defi ned by the "slower" processes. However, by mid-September it became clear that the neutral-to-warmish conditions had edged into the weak El Niño range, and the observed September Niño3.4 SST anomaly from the NOAA OI-SST dataset was 0.70, close to the 75 percentile for that month historically. The models began "predicting" El Niño more clearly once El Niño levels of SST were recognized in the observed initial conditions. Although the El Niño was late starting, this was not unprecedented (e.g. 1986).
The westerly wind events in the western tropical Pacific (Fig. 1) played an essential role in the initiation of the late 2006 El Niño–one in August of moderate strength and a second one from late September to early November of greater strength, duration, and eastward extent. Both wind events were followed by SST increases near and east of the dateline related to the movement of warmer surface water eastward. Anomalously warm SST emerged in a separate region much farther east, near 100°W in the eastern part of the Niño3 region. During November, the SST anomaly in between the two separately warmed regions increased as the warming pattern became somewhat more uniform from the Date Line eastward. This event appears to be more like those of earlier decades, with warming throughout much of the central and eastern tropical Pacific.
Some expected climate effects have developed, such as excessive rainfall in eastern equatorial Africa and defi cient rainfall over Indonesia, southeastern Australia, and parts of southeast Asia. El Niño-related climate effects normally expected between December and April, including those in the Pacifi c region, should not be taken lightly in current risk management decisions during this weak to moderate El Niño episode.
