This work is licensed under a Creative Commons Attribution 4.0 International License.
These maps (click for full sized versions) are updated daily and are based on data from our National Climate Database.
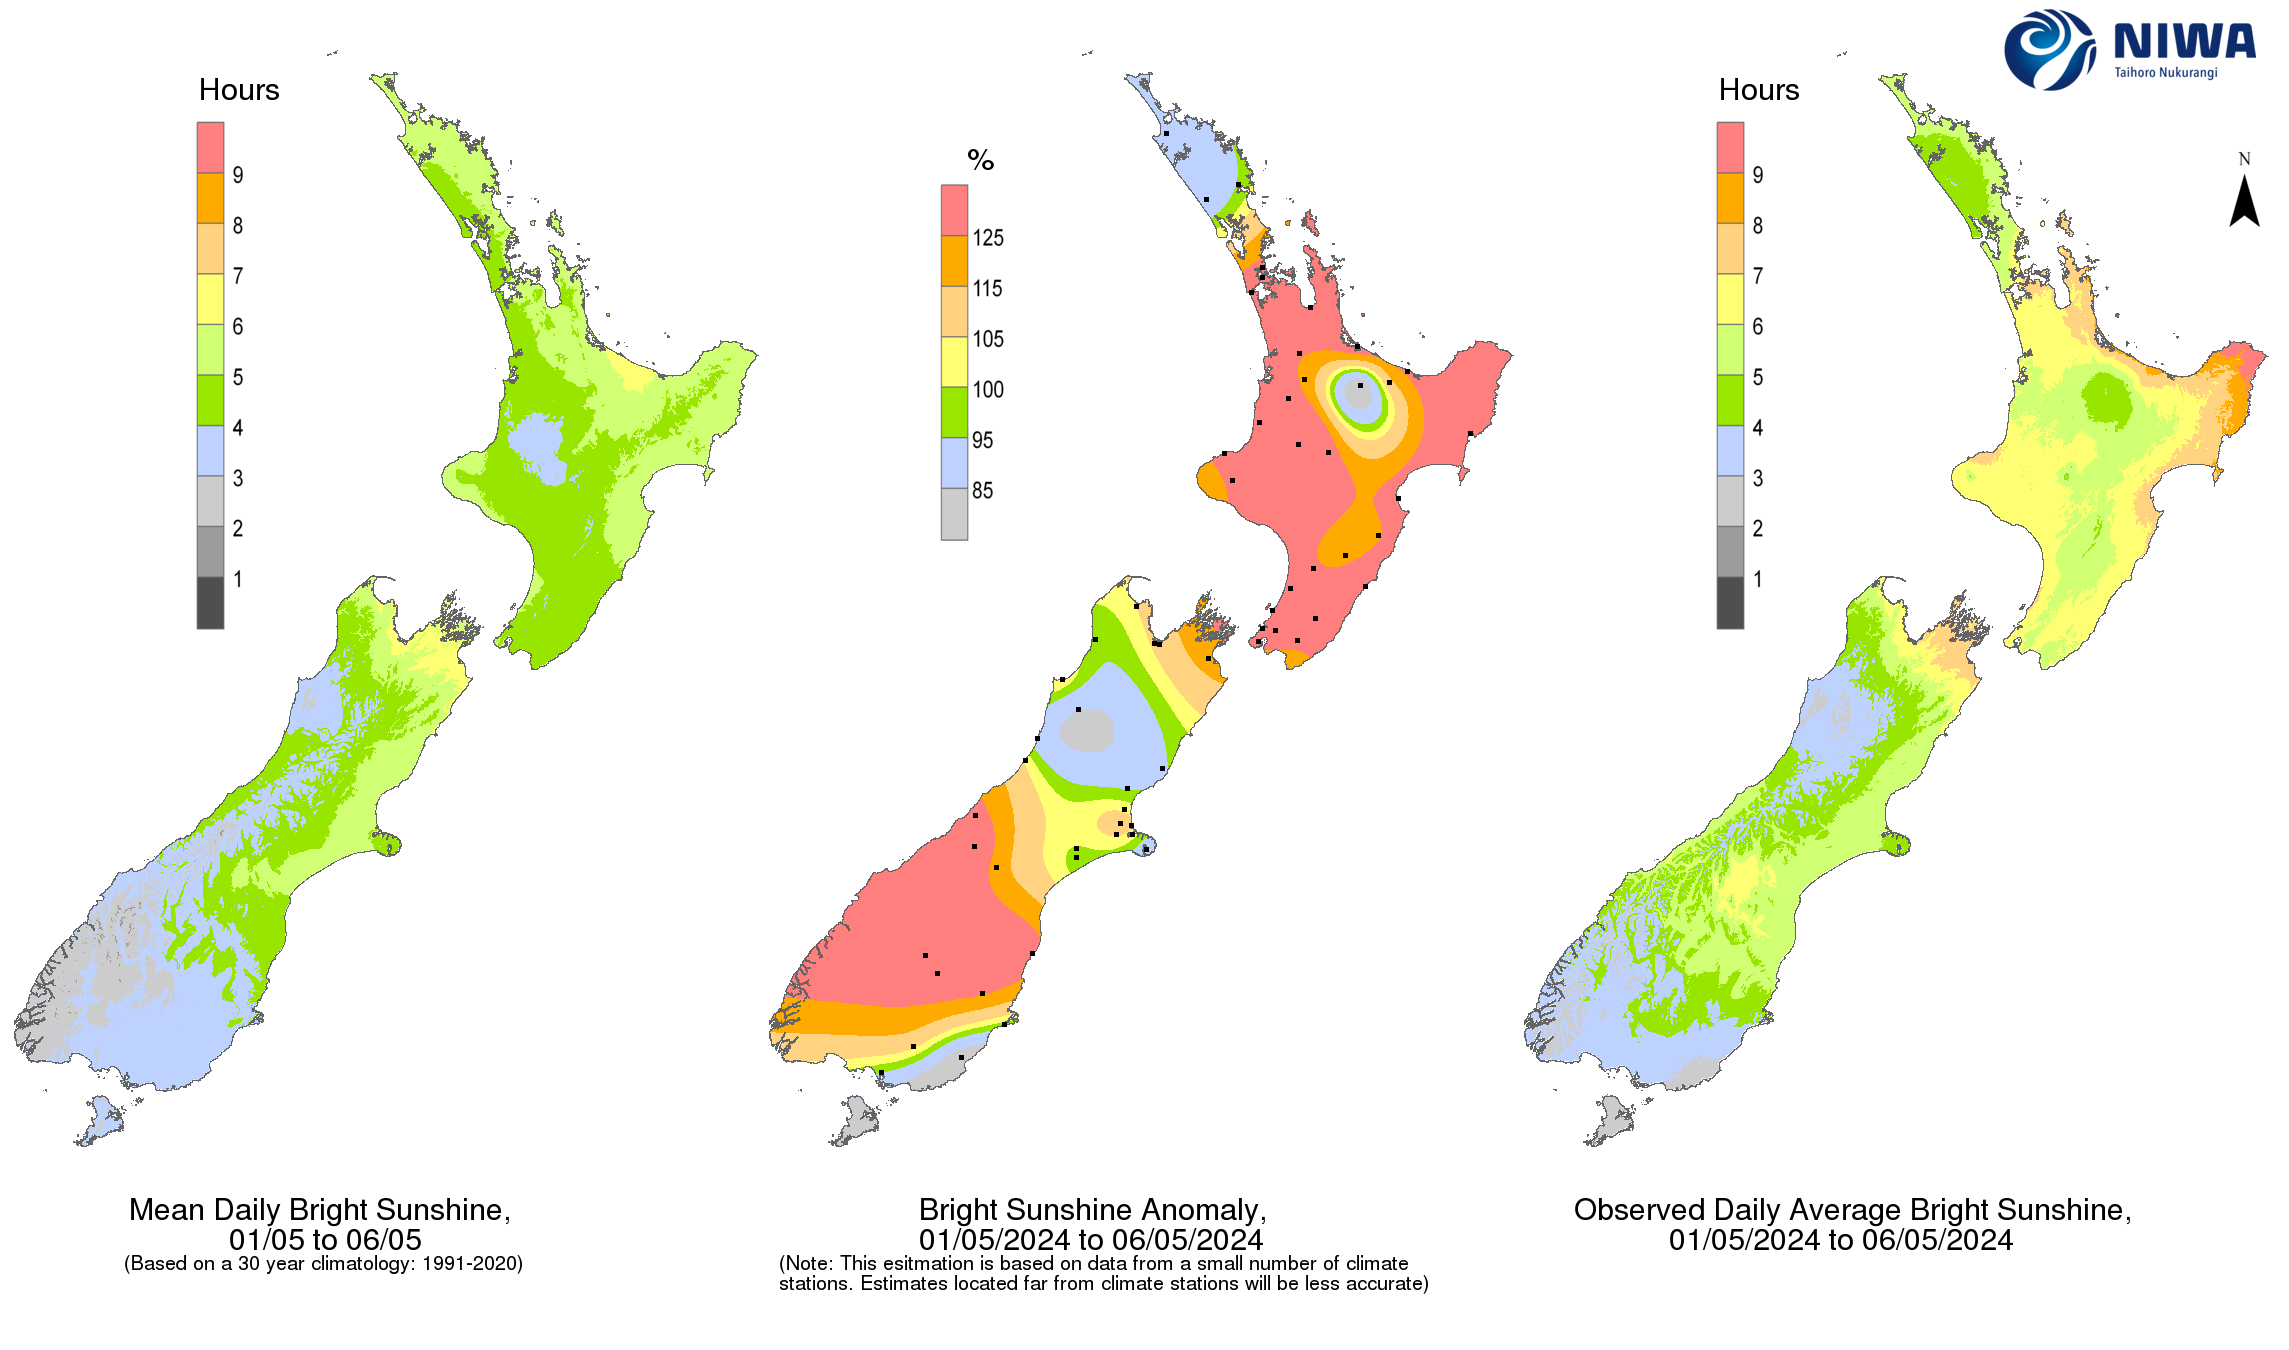
All historical averages are based on the 30-year period 1991-2020. Maps of some variables, for example sunshine hours, are based on fewer recording sites than others, for example rainfall. For more information on these maps, and the data used to produce them, please contact the National Climate Centre.
Contact the National Climate Centre
About SPI
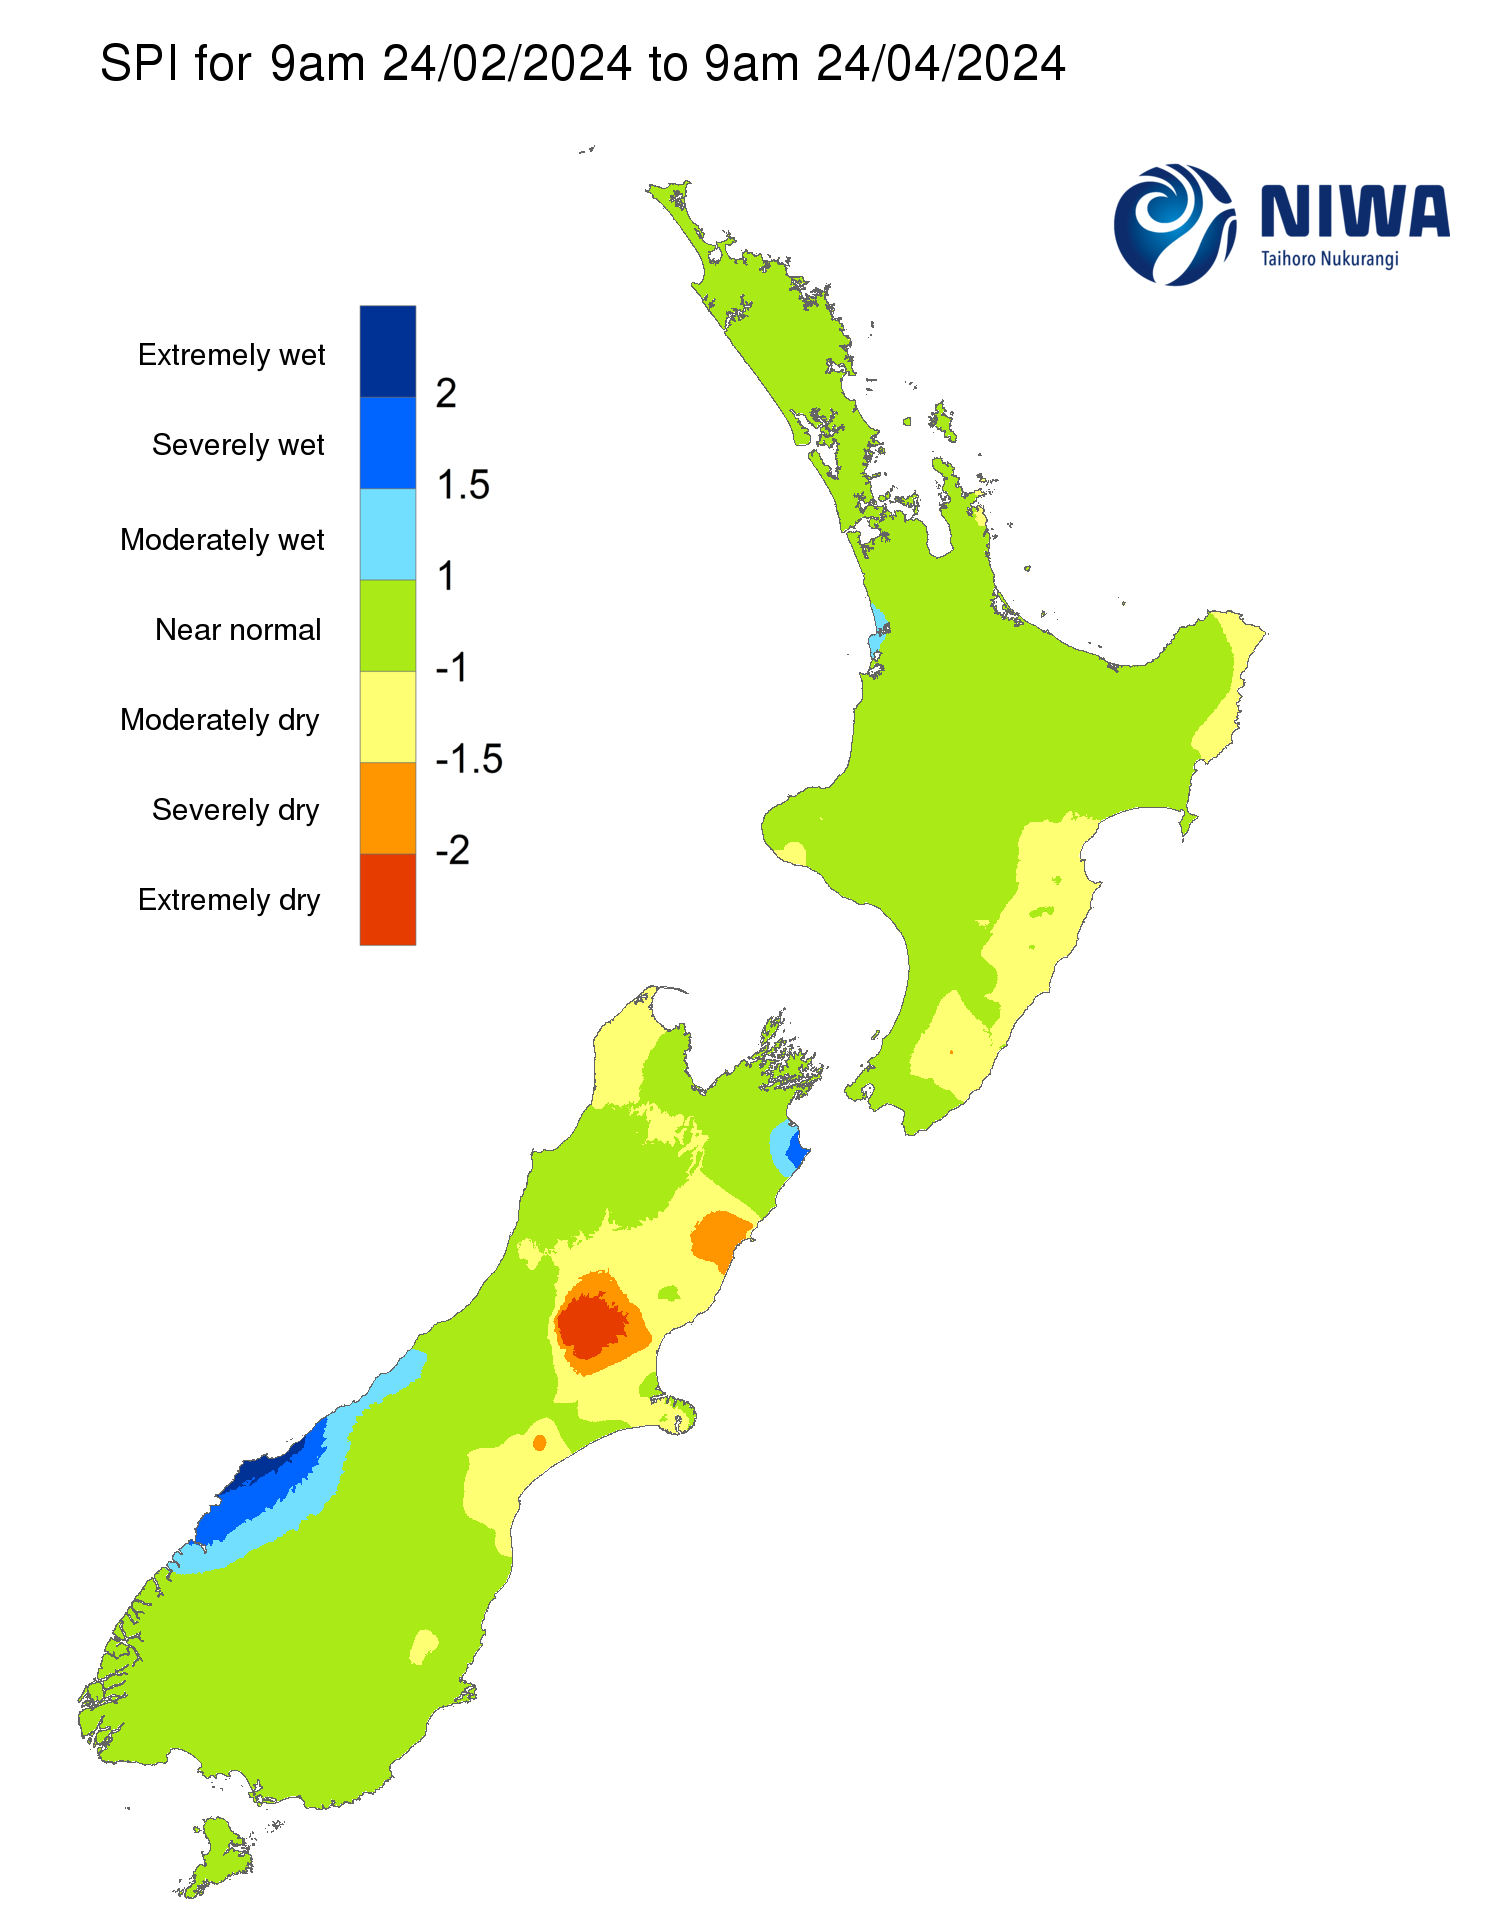
The Standardised Precipitation Index (SPI) is a simple measure of drought (and also of very wet conditions) and is based solely on the accumulated precipitation for a given time period (e.g. over the last 30 or 60 days). Because droughts vary greatly in duration, it is important to detect and monitor them at a variety of time scales.
SPI is calculated by taking the difference between the recently-accumulated precipitation and the long-term average (1991-2020) accumulated precipitation for the same dates, and then dividing by the long-term standard deviation (this is the "standardising" part). As a result, the severity of a drought can be compared to the average condition for any location and maps can be drawn. Values of the SPI range from +2.00 and above (extremely wet) to -2.00 and less (extremely dry) with near normal conditions ranging from +0.99 to -0.99.
Soil Moisture Deficit

Last 15 days rain
Last 15 days sun

Last 15 days temperature

Last 30 days SPI

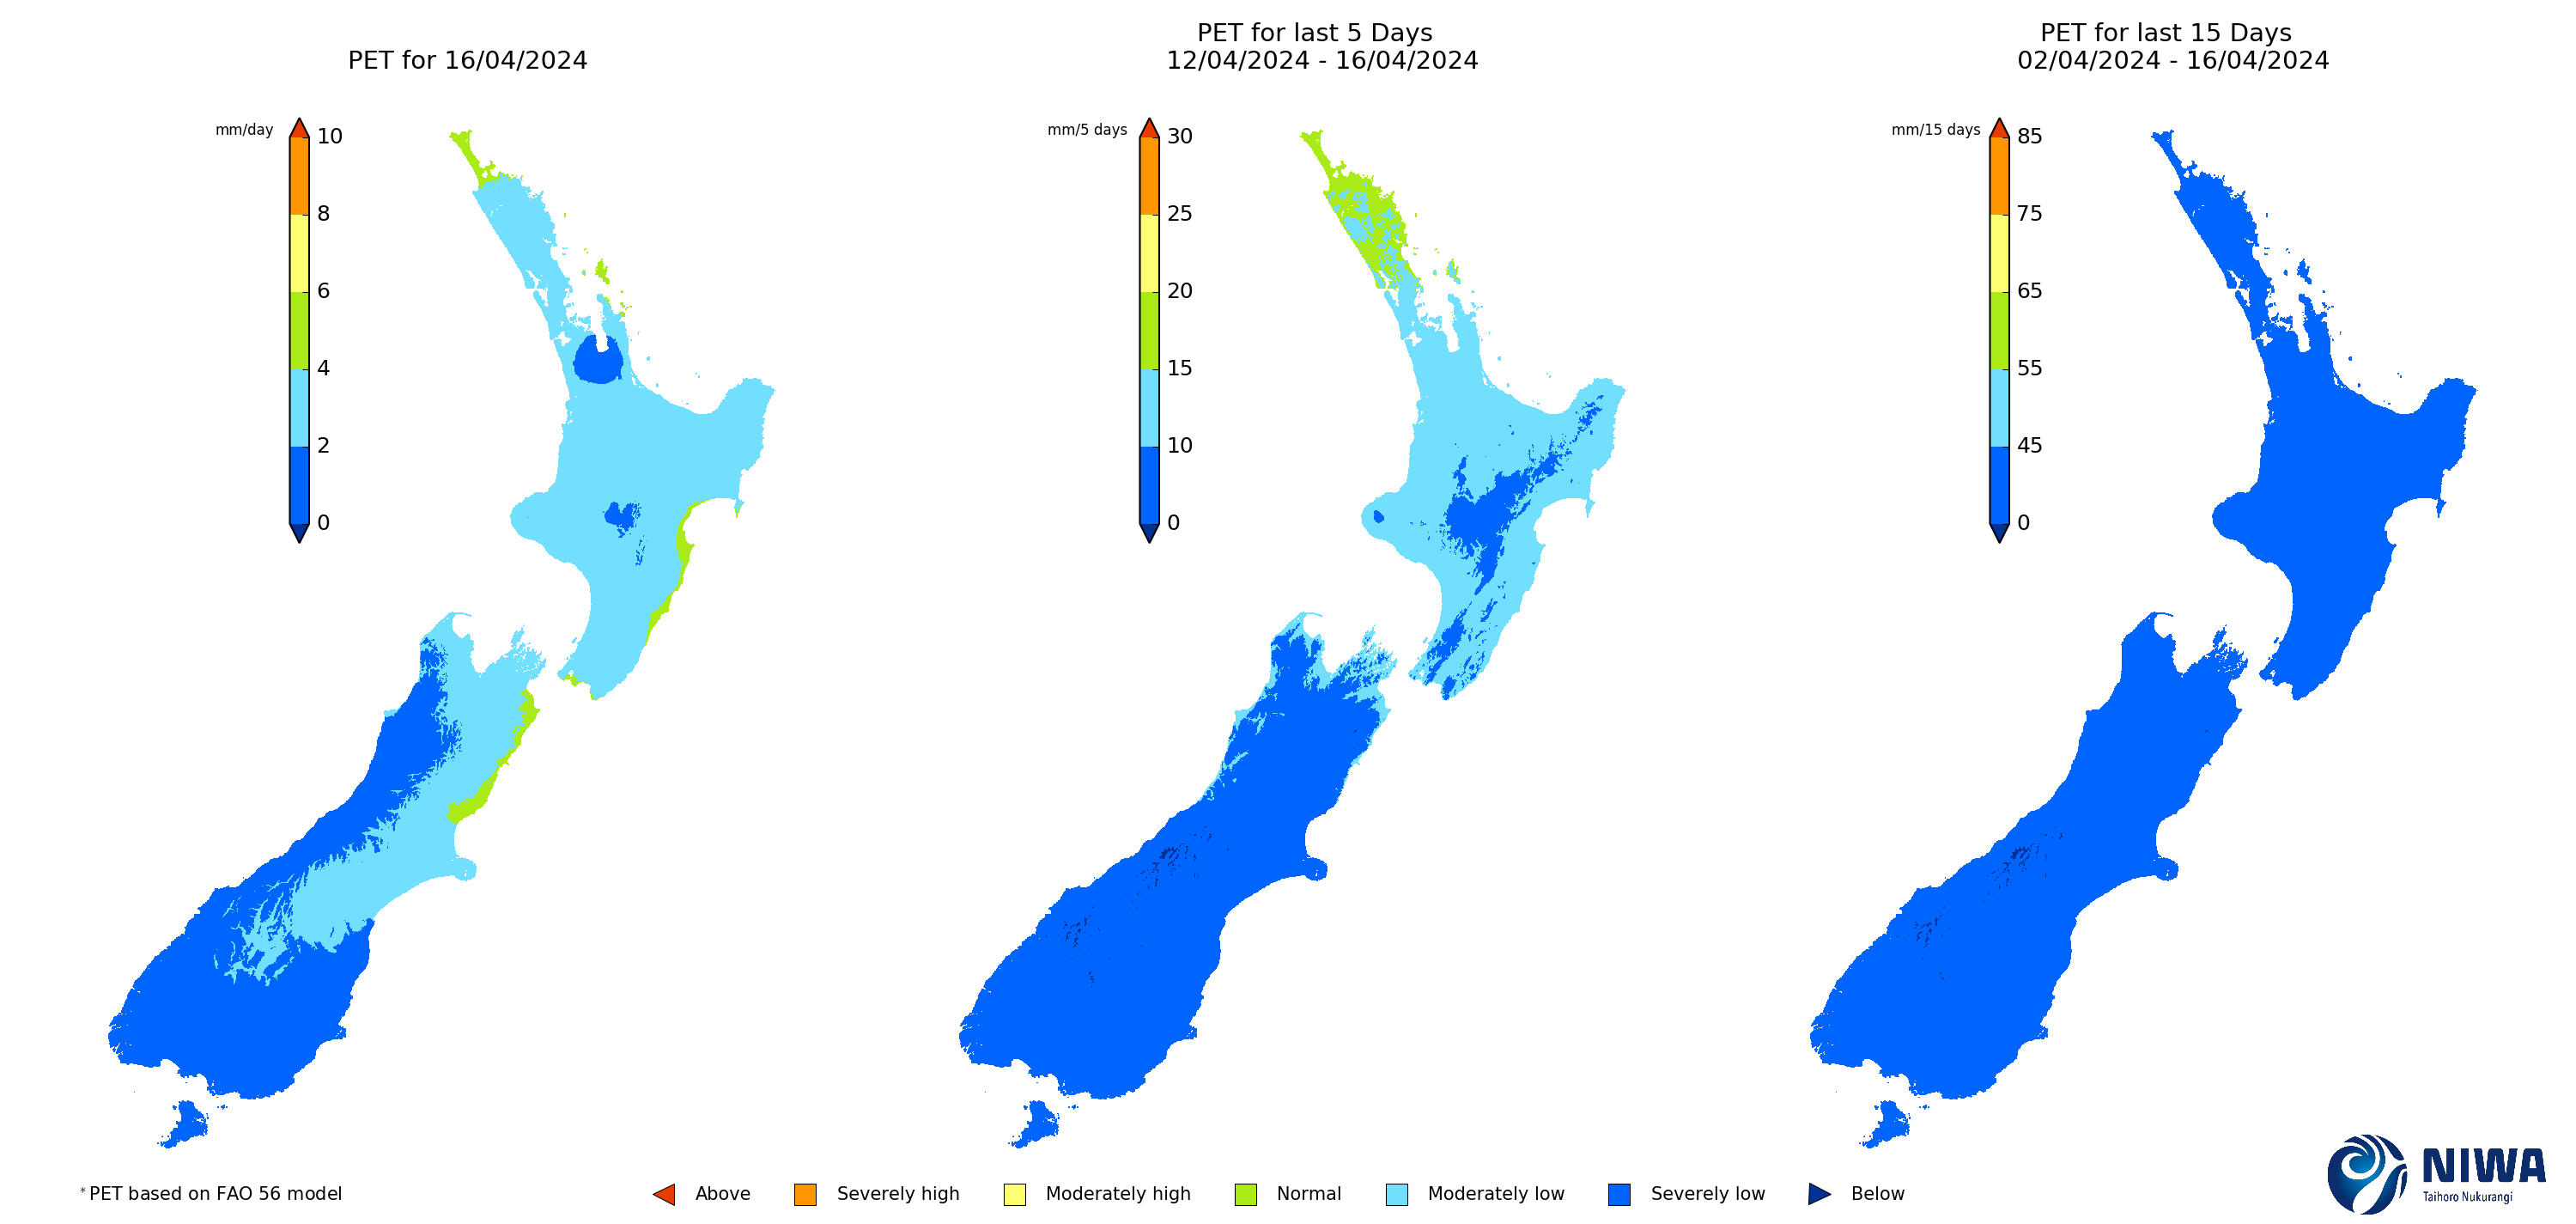
Last 15 days Potential Evapotranspiration (PET)
Soil Moisture Anomaly

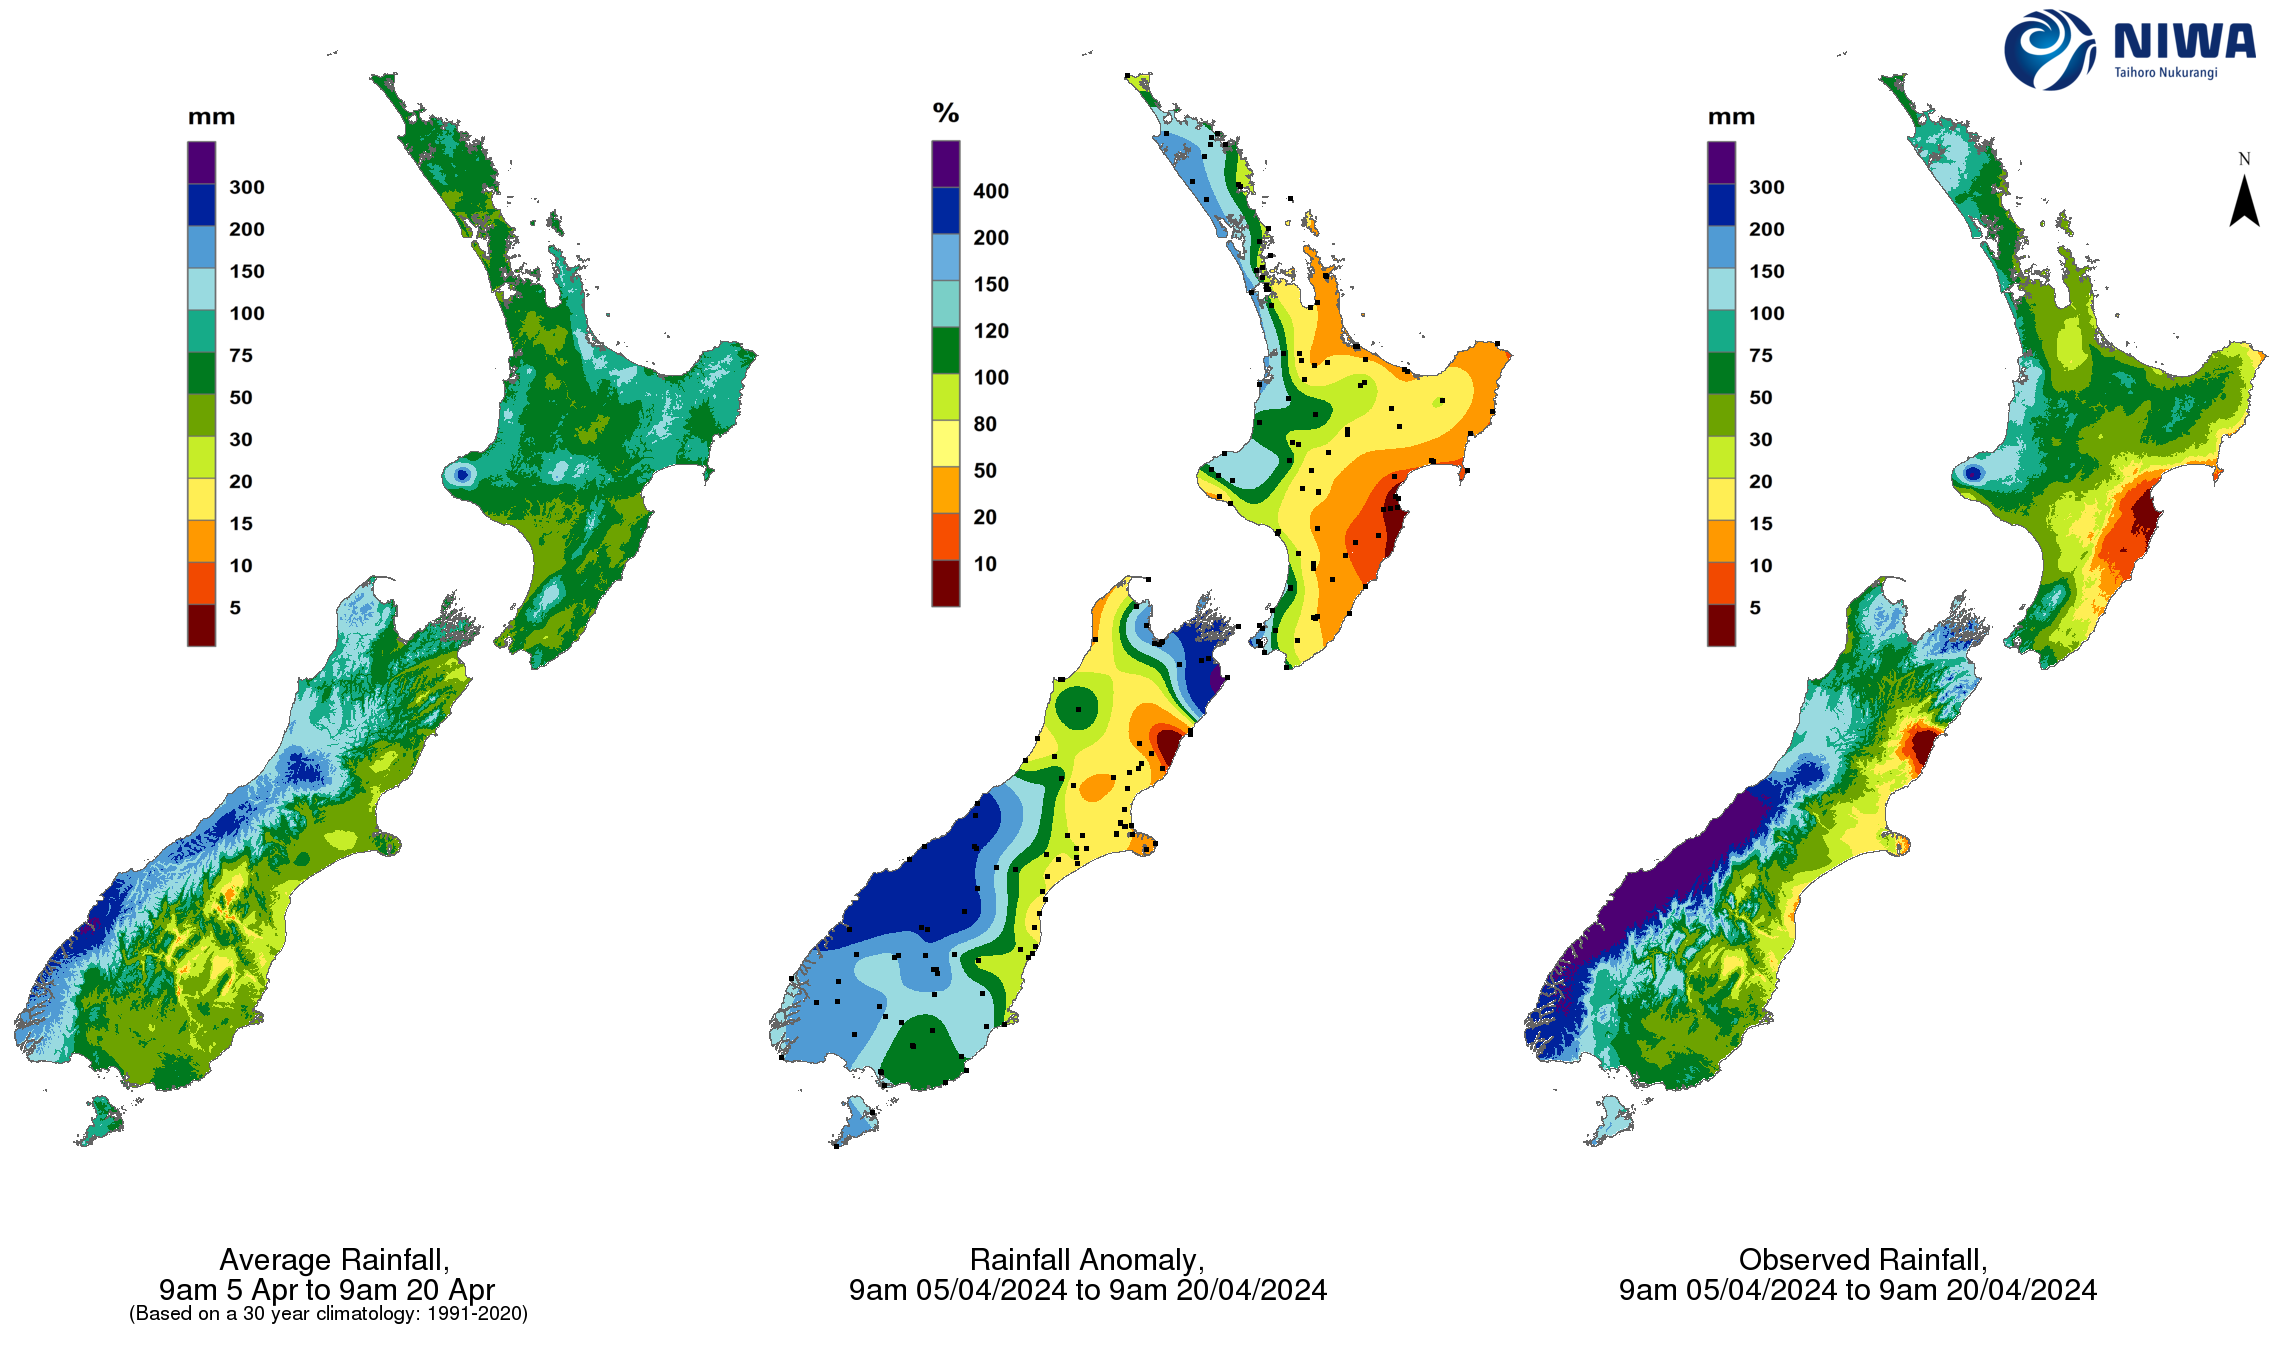
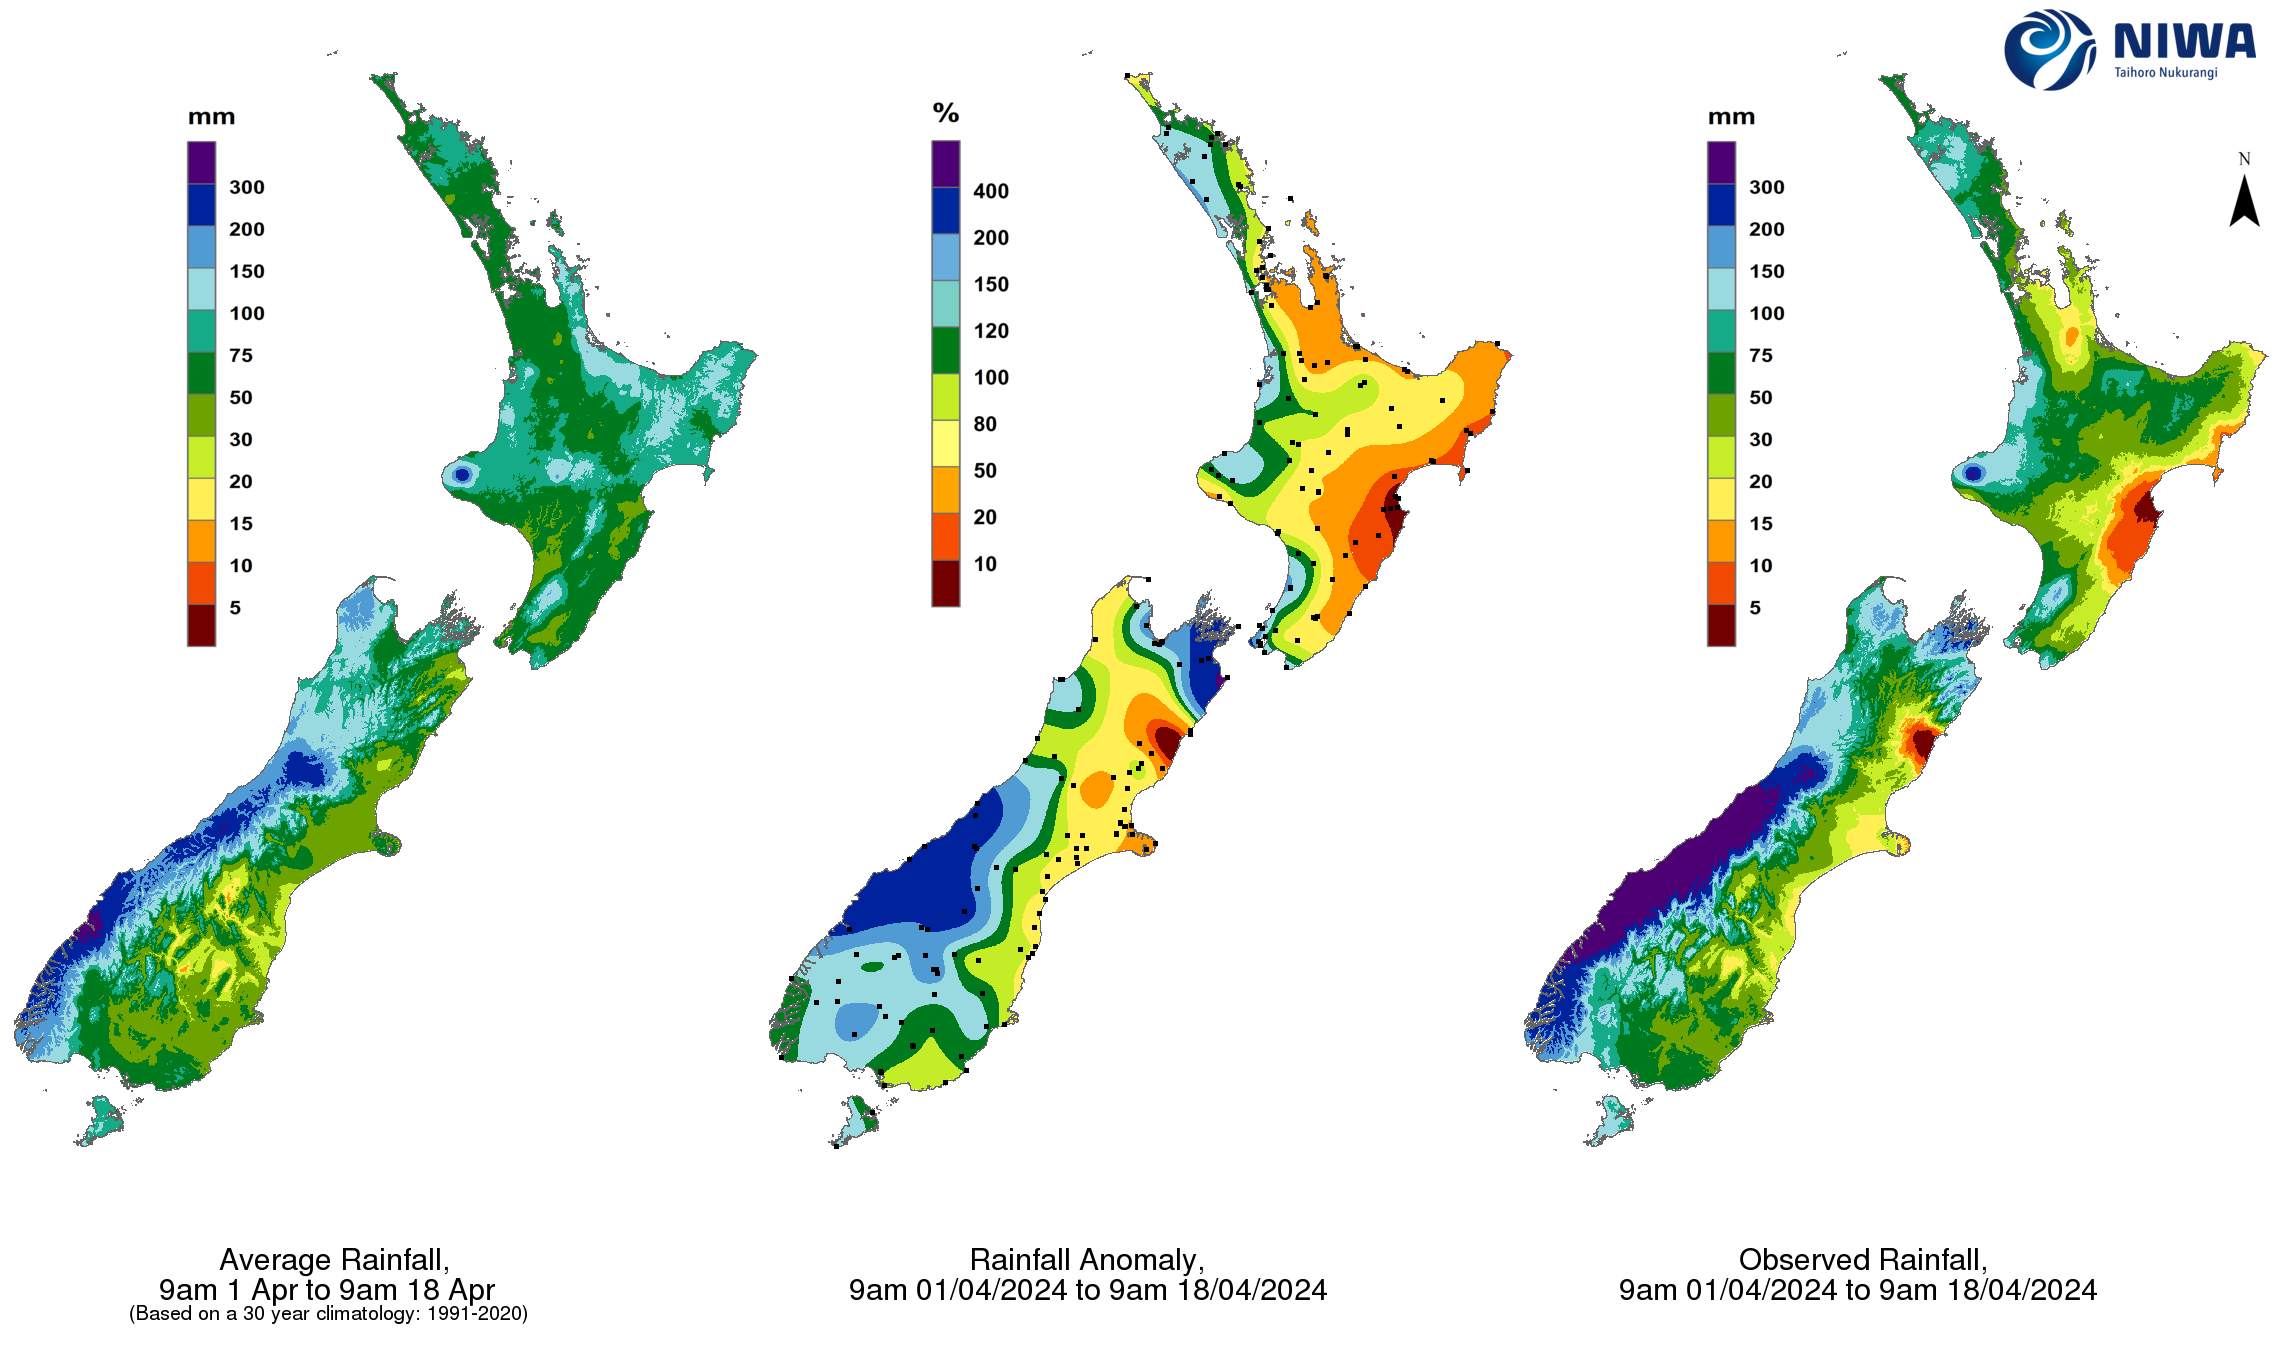
Month to date rain
Month to date sun
Month to date temperature

Last 60 days SPI