Monitoring and mapping outdoor air with dense monitor grids
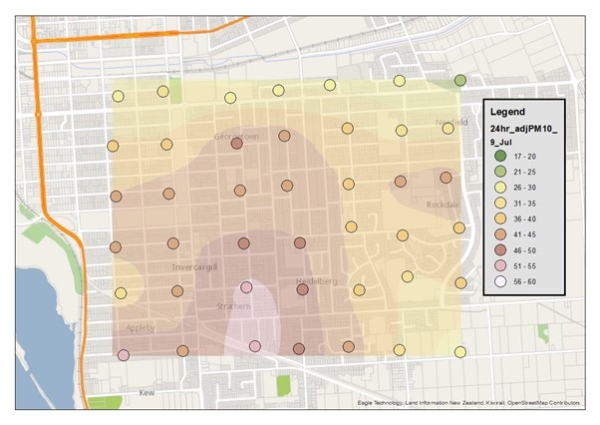
NIWA is a pioneer in using dense grids of new-generation air monitors to create detailed maps of air quality. We use monitors that measure particulate matter levels (PM10 and PM2.5) every 20 minutes or faster, sending data to the cloud via the mobile phone network.
These data can be converted into maps of air quality which are readily turned into maps and animations.
Webinar - monitoring grids for airsheds
Past projects
Projects up to 2021 used NIWA’s ODIN monitors. Projects from 2022 onwards use Clarity monitors.
-

Air quality in Arrowtown - 2019 results
Read a summary of results and download our full report on 2019 outdoor air quality. -

Community Observation Networks for Air (CONA): previous projects
CONA studies in Rangiora in 2015-17 and Alexandra in 2018 have proven that the technologies and methodologies used provide valuable data to support mitigation efforts by local authorities.