On this page:
Introduction
The vast quantities of silt deposited by flooding have resulted in high levels of silt dust in the air across Tairāwhiti and Hawke’s Bay. In addition, Cyclone Gabrielle resulted in huge infrastructure damage, meaning councils and regulatory authorities need support to meet their legal requirements to monitor air quality.
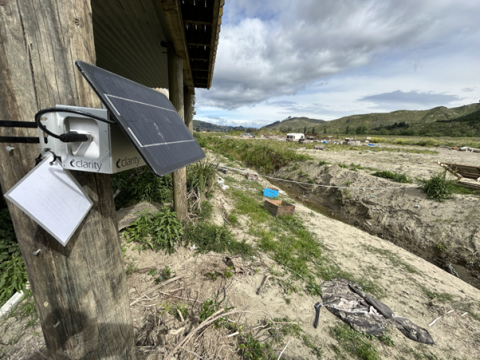
NIWA’s air quality team has deployed mobile portable monitoring equipment. The researchers are monitoring airborne particulates and will be analysing samples for respirable crystalline silica and other substances that may have health impacts. Findings from this project are informing public health decisions.
Weekly monitoring results
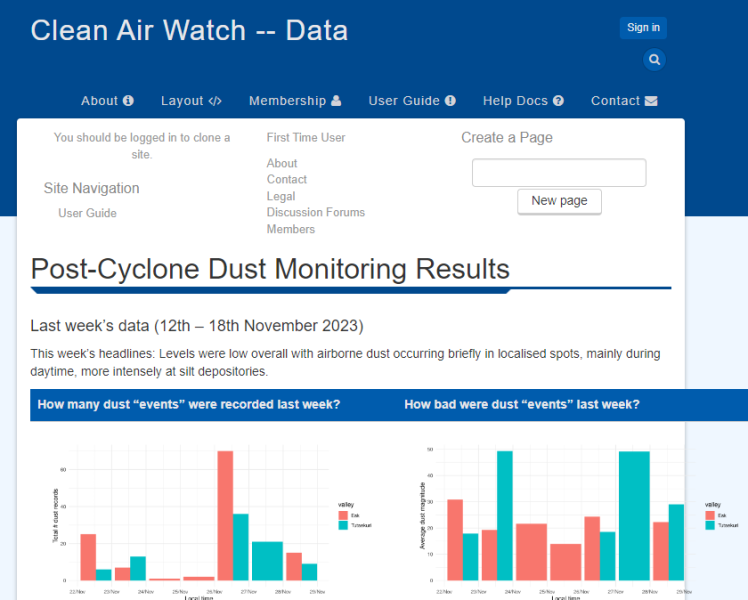
You can find a summary of last week's data on this site.
Available information includes monitoring locations, number of 'dust events' (see explanation in FAQs) and dust magnitude.
Frequently asked questions (FAQs)
Where are we monitoring?
A total of 36 monitoring monitoring sites have been established - 18 in the Esk Valley, north of Napier and 18 in the Tutaekuri Valley, east of Napier. These valleys have been chosen due to the being assessed as presenting a high risk, largely due to the most extensive land area of exposed silt (Esk), and high numbers of silt deposits (Tutaekuri). Monitoring sites focus on 'source areas' (fluvial or managed silt deposits), and 'impact areas' (nearby residences).
Why are we monitoring?
Dust monitoring data is being collected in order to:
- Create a record of human exposures that can be used to investigate effects on human health
- Help understand where and when high levels of dust can occur and develop warning systems.
- Monitor the impact of silt removal and recovery operations, informing and evaluating changes in practice, if required.
What are we monitoring, and how?
Data is being collected by real-time laser-based particle monitors (Clarity Node-S). Each device reports measurements of PM1, PM2.5 and PM10 (particulate matter smaller than 1, 2.5 and 10 microns respectively) every 17 minutes to a cloud server.
NIWA scientists convert this data into an estimate of 'dust', i.e. screening out smoke from fires and other sources of airborne particles unrelated to silt dust. This is more difficult to do when it is raining or there is lots of sea salt in the air, meaning reported levels of “dust” may be artificially high in these conditions.
What is a 'dust event'?
The charts on the results page linked above relate to 'dust events'. These are defined as measurements during which dust levels were significantly elevated (>10 micrograms per cubic metre) above 'background' levels (the minimum level across the whole region). The event may often last for only a single 17-minute sample, or may last a few hours.