How do we model the climate?
What's the difference between climate and the weather?
The difference between weather and climate is time. Climate refers to averages of weather conditions, including temperature, rain and wind, that characteristically prevail in a particular region, over a long period of time (e.g. 30 years). In contrast, weather describes meteorological conditions in the short-term (e.g. instantaneous, daily or weekly).
Why do we need to know about future climate?
Understanding how the climate is changing makes it easier to plan for any new risks that might impact on New Zealand, such as a change in frequency of climate extremes such as droughts, flooding and storms. At the same time, new opportunities will emerge as the climate changes. For instance, we could grow different food crops in a warmer future. It's critical that New Zealand has the best tools and information available, to help anticipate and plan for such changes. NIWA uses its model to produce climate projections out to 2100.
How do scientists predict the future climate?
Working out what will happen to the climate in the future isn't easy. Regional and global climates are the result of many complex interactions between processes in the atmosphere, ocean, land surface and cryosphere (snow, ice and permafrost). To see what impact those various interactions might have on the climate, scientists have developed computer models which mathematically simulate relevant physical, chemical and biological processes to indicate what the climate might look like under various scenarios for future greenhouse gas concentrations.
How do the models work?
A climate model is basically a huge mathematical calculation that creates a simulated picture of what the real-world climate might be like in 10, or 20 or 100 years from now. The many physical, chemical and biological interactions in the atmosphere, ocean, land surface and cryosphere all follow constant natural laws. A model simply converts those laws into mathematical equations so a computer can work with them, modelling what might happen to the climate when the different elements interact.
Large climate models (such as global climate or global circulation models (GCMs)) do so many calculations that they need to be run on supercomputers, like NIWA's IBM p575 POWER6 supercomputer. GCMs are very complex – even a supercomputer can take up to two months to simulate a century of climate information.
Find out more about our supercomputer
Are all climate models the same?
No. There are various types. Models that simulate the atmosphere are called Atmospheric General Circulation Models (AGCMs) and have been developed from weather forecasting models. Similarly, Ocean General Circulation Models (OGCMs) simulate the ocean. The acronym GCM is often also translated as Global Climate Model, since these models encompass the entire globe. GCMs are widely used for weather forecasting, understanding the climate, and projecting climate change.
An AGCM and an OGCM can also be 'coupled' together to form an atmosphere-ocean coupled general circulation model (AOGCM). Climate models can also be run at higher resolution over a limited area of the globe – these are known as Regional Climate Models (RCMs). RCMs are usually run as atmosphere-only models, and must be loaded with 'boundary conditions' – sea surface temperatures at the lower boundary and atmospheric conditions (wind, temperature, humidity, etc.) at the lateral boundaries. These boundary conditions are provided by the GCM.
What kind of model does NIWA run?
NIWA uses the UK Met Office's 'Unified Model' suite. Within this suite, there is a GCM which can be run as atmosphereonly or as a coupled AOGCM, and also an RCM which NIWA has modified to suit local conditions.
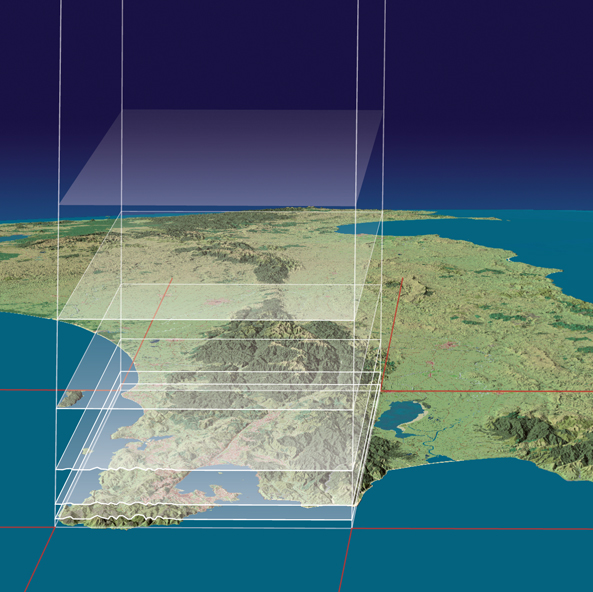
GCMs calculate the behaviour of wind, temperature, ocean currents, humidity, etc. at a number of prescribed points on an imaginary three-dimensional grid, covering the surface of the Earth and extending vertically upward in layers through the atmosphere. Many influential climate interactions happen down low in the atmosphere, where the air pressure differential is greater than higher up. So while the NIWA model has 19 separate levels, spanning 30km up to the middle stratosphere, the majority of them are concentrated in the lower troposphere.
The model makes calculations at every intersection in the grid. The model's resolution (the amount of detail it can calculate) is defined by the size of each box in the grid: how close or distant the points are.
Grid size is critical. It must be small enough to capture the localised effects of flow over and around topographic features like hills. However, the more points a model has, the more calculations need to be made, and the longer the model takes to run. Most models are a compromise between resolution and run time.
The GCM NIWA uses for climate simulations is run with grid-points approximately 140km apart. The model makes a calculation every 30 minutes. The higher-resolution RCM covers New Zealand with a grid of points about 27km apart (about 300 boxes). The RCM makes a calculation at each point every three minutes. A future model to be implemented in 2011–12 will use points around 12km apart.
Are climate models accurate?
NIWA scientists compared simulations of past climate with actual observations, to check that their model accurately reproduced what we know about the climate from that period. It did.
Another good test of models is their ability to simulate abrupt climatic changes. A NASA model run some months after the eruption of Mt Pinatubo in 1991, using known measurements of the aerosols it released into the atmosphere, delivered an excellent fit with what actually happened to the climate subsequently.