Cyclone Gabrielle unleashed torrential rain and record floods across Hawke's Bay and Tairāwhiti in the second week of February. In the days that followed, river flow experts and hazard scientists rushed to the region to capture vital data showing the full fury of the storm. Stacy Mohan talks to the researchers unravelling Gabrielle’s legacy and helping local communities plan for their future.
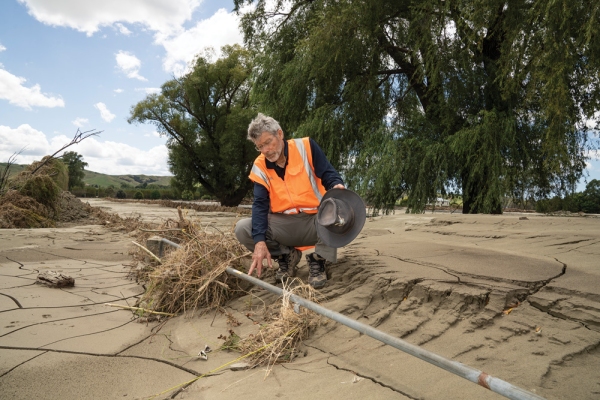
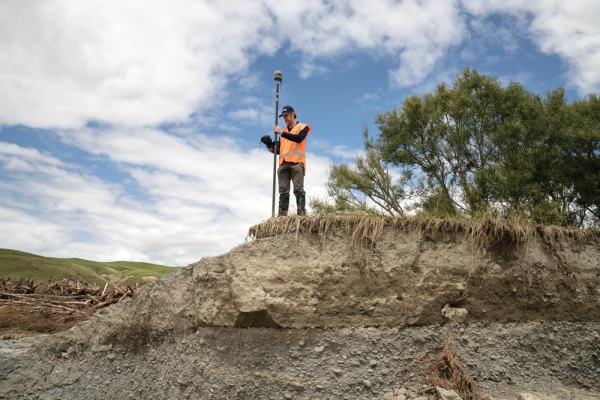
Dr Graeme Smart is looking out across a featureless metre-high layer of silt. Behind him are the remains of a stopbank breached by the raging Tūtaekurī River.
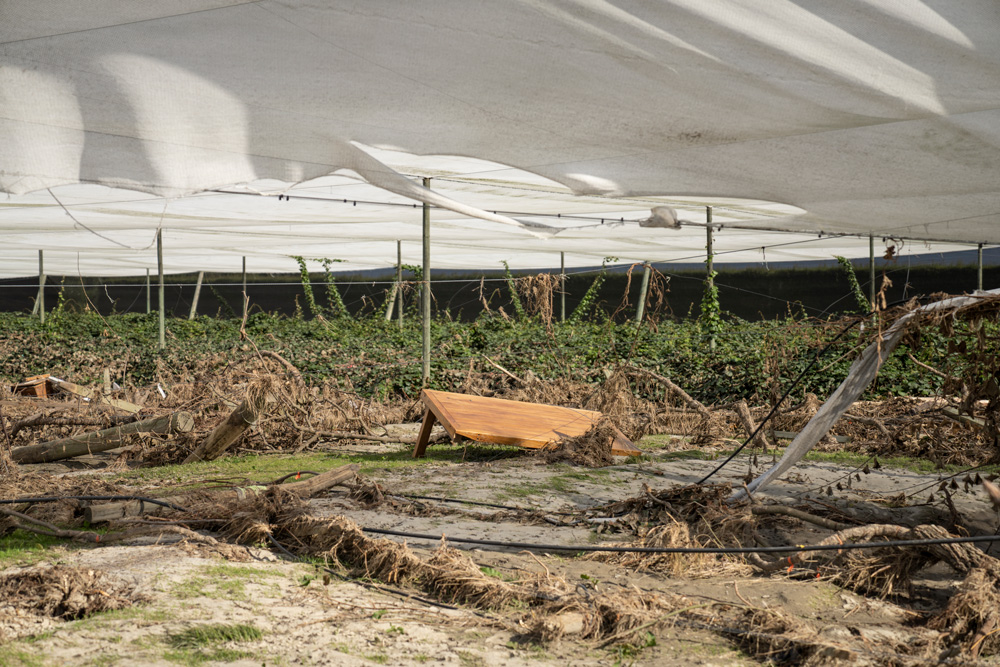
Just a week ago this was a thriving orchard in full production. Now orphaned apples litter the landscape and there’s not a fruit tree in sight. The orchard has been completely swept aside by terrifying, torrential flood waters, and everywhere you look is sediment or debris.
“It’s devastating,” says Smart, a NIWA principal hazards and hydrodynamics scientist.
“This was a really large flood – the stopbank had half a metre clearance on what they thought was a one-in-100-year flood level when they designed it. The river level went well above that.”
Smart and his colleagues are on a mission: to urgently capture, measure and map the flood levels left in Cyclone Gabrielle’s wake, before more forecast rain washes the evidence away.
He knows the importance of his work. The people of Hawke's Bay, he says, need to understand exactly what happened to their rivers, if they are to recover from this disaster and effectively prepare for what lies ahead.
“Just a little bit of rain washes away all the silt lines and all the top water levels. We have to get this data before it is obliterated."
“It is critical for future planning.”
NIWA forecasting, hazards and hydrodynamics staff had already had a hectic start to the year.
Cyclone Hale swept in during the second week of January, leaving a trail of wrecked roads and severed power lines from Northland, through the Coromandel and down the East Coast.
Next came the Auckland Anniversary Weekend floods – four dead, homes, streets and airports inundated and a city reeling from the record-breaking deluge.
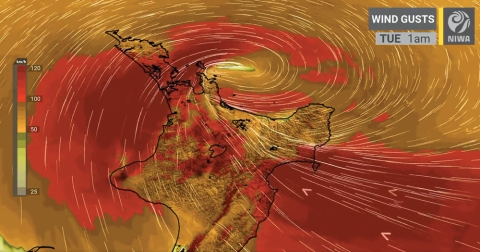
Little over a week later, NIWA’s Forecasting Services team, led by meteorologist Chris Brandolino, watched in alarm as Cyclone Gabrielle began to form in the northeastern Coral Sea, possibly heading south.
Worried by its size, the team started to alert agencies about Gabrielle’s progress. A string of briefings followed for Fire and Emergency New Zealand, the Department of Conservation and the Ministry for Primary Industries, with officials from the National Emergency Management Agency and Civil Defence also sitting in. These briefings were interspersed with on-going media interviews and updates on social media.
While the cyclone’s track was still uncertain, coastal and river flow specialists pitched in. Natural hazards scientist Dr Emily Lane worked with her team to combine coastal storm surge predictions with forecasts for the multiple possible cyclone tracks.
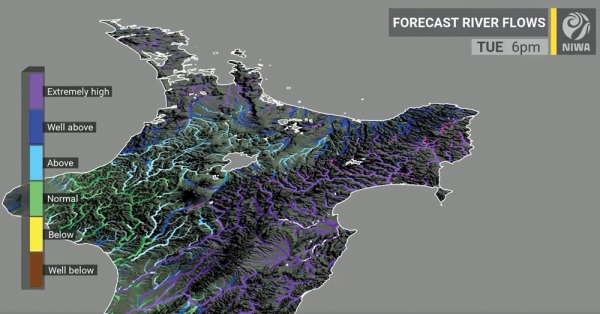
Led by Dr Céline Cattoën-Gilbert, another group focused on river catchments. They are fine tuning a new modelling tool that combines rainfall forecasts with a hydrological model to pinpoint areas likely to be most impacted by high river flows. During weather events such as Cyclone Gabrielle, Brandolino and the other NIWA forecasters often present data from this tool.
Brandolino can’t speak highly enough about the value of having NIWA’s other experts on hand to help understand what might happen. “As meteorologists we’re well versed at communicating direct weather-related impacts, but we really need the other experts when it comes to coastal inundation and river flooding. Having them in the tent during Cyclone Gabrielle was critical,” he says.
“It’s all about the impacts. There were questions that people were going to ask and without that extra information we wouldn’t have been able to answer them. Even though there was still uncertainty, the agencies we briefed before and during the cyclone were incredibly grateful for the additional information.”
Other researchers started looking at landslide risks. Over the past year NIWA has been working with GNS Science on a pilot study looking at forecasting rainfall-induced landslides (RILs) in the Wellington region.
The work combines NIWA’s near-real time rain forecasts with GNS’s land stability data.
“As Cyclone Gabrielle approached, GNS Science extended the pilot study to trial the RIL forecast tool across much of the upper North Island,” explains NIWA climate scientist Dr Trevor Carey-Smith.
“The landslide forecasts were converted to impact forecasts – houses, roads and rail networks – and shared with councils, central government and emergency response agencies to help inform decisions about things like evacuations and road closures.”
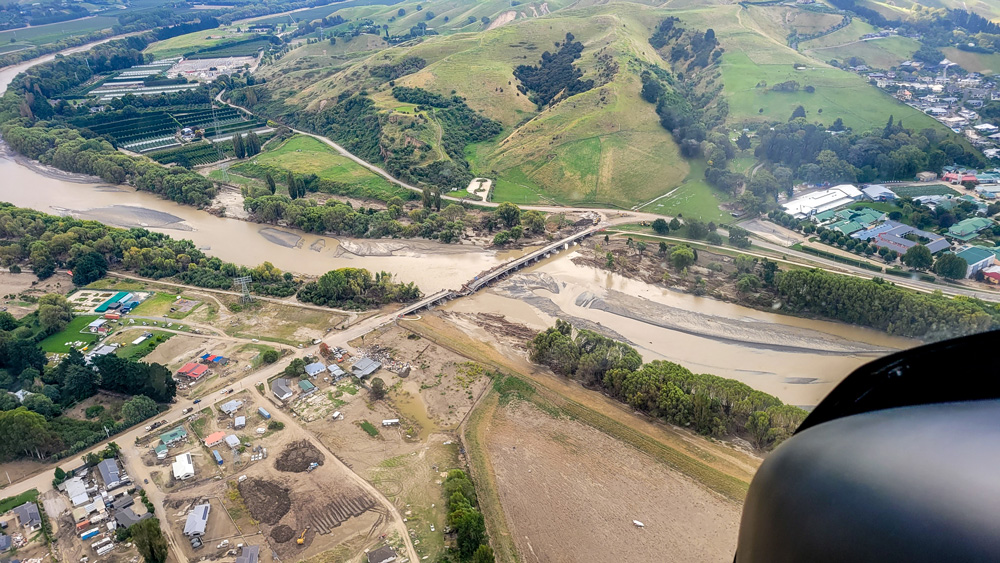
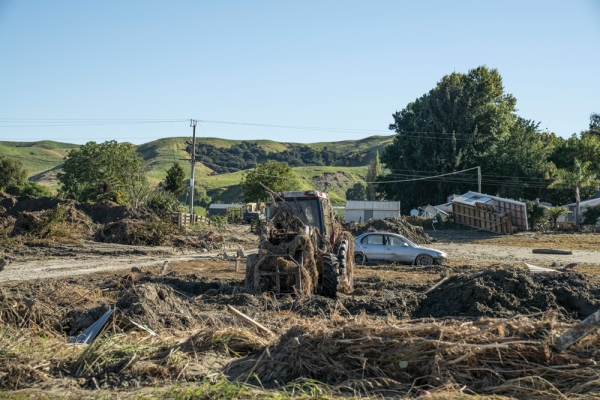
Gabrielle swept onto the northeast of the North Island in the early hours of Sunday, 12 February, saving its full fury for Hawke’s Bay and Tairāwhiti two days later. It claimed 11 lives, destroyed hundreds of homes and devastated huge swathes of agricultural and horticultural land.
The most expensive weather event to hit New Zealand, the bill is being counted in billions. Treasury's latest estimates suggest it may top the $13 billion price tag for the 2011 Christchurch earthquakes.
The flood waters were only starting to recede as Christchurch-based Smart and his colleagues packed their survey equipment and headed for Hawke’s Bay and Tairīwhiti to gather critical time-sensitive data.
“Hawke’s Bay Regional Council put out a call to ask who could pitch in,” explains hydrodynamics technician Jochen Bind. “And NIWA, amongst a whole bunch of other organisations, said ‘yes, we’ll be there’.”
Smart and Bind were two of several NIWA staff, alongside teams from agencies and locations across the country, who answered the call.
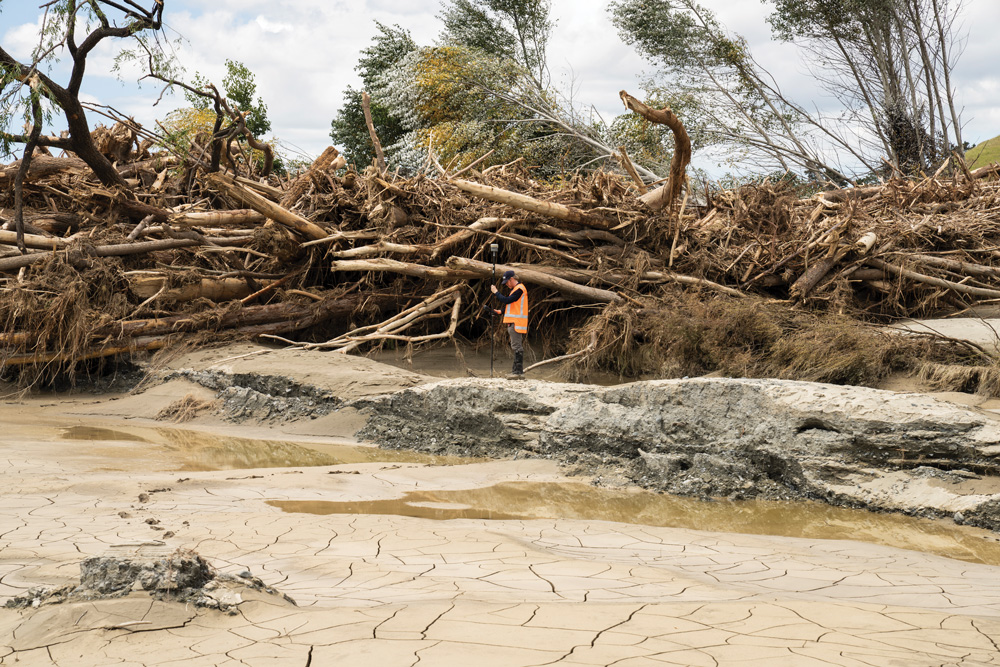
The first sites they tackled were the stopbank breaches and extensive flooding caused by the Tūtaekurī, Ngaruroro and Esk Rivers.
The data captured is now being used to calibrate flood models and help pinpoint the mechanisms driving sediment transport and stopbank breaches. It will be key to designing new flood defences.
“It’s really important when there’s a natural disaster like this that we capture the water depths, levels and extents, because an event is the real thing. It’s not a model, it’s a one hundred percent perfect model,” says Smart.
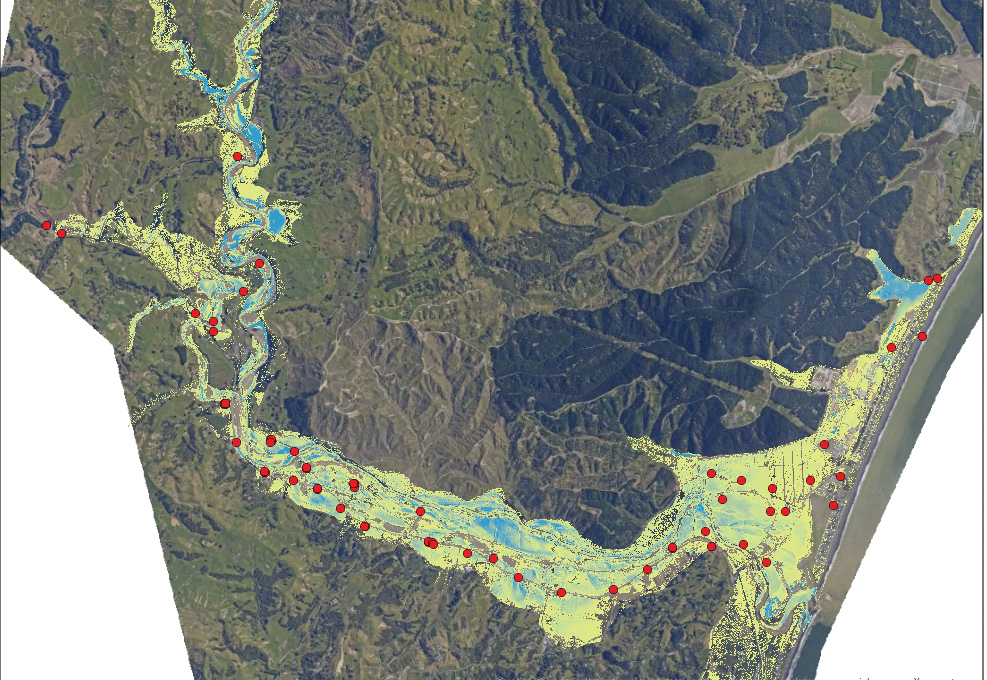
As the survey team worked on the ground, NIWA also joined forces with the University of Canterbury (UC) and Christchurch Helicopters, to collect aerial LiDAR data, covering the worst affected areas.
LiDAR – which stands for Light Detection and Ranging – is a method of rapidly capturing topographic data to build 3D maps. With the LiDAR instrument mounted on a helicopter, a team led by UC’s Professor James Brasington flew rapid response surveys of stop banks for Hawke’s Bay Regional Council.
The LiDAR flights then moved to wider coverage of impacted rivers and flood plains across Hawke’s Bay and Gisborne regions.
“The LiDAR data has been critical for investigating the impact of Cyclone Gabrielle,” says NIWA hydrodynamics scientist Dr Hamish Biggs.
By comparing the post-Gabrielle helicopter LiDAR data with LiDAR surveys from 2020 by Land Information New Zealand (LINZ), researchers can investigate stopbank breaches, woody debris piles, riverbank erosion, flood inundation depths and sediment deposits.
The LiDAR data is also a critical input for NIWA’s flood modelling work.
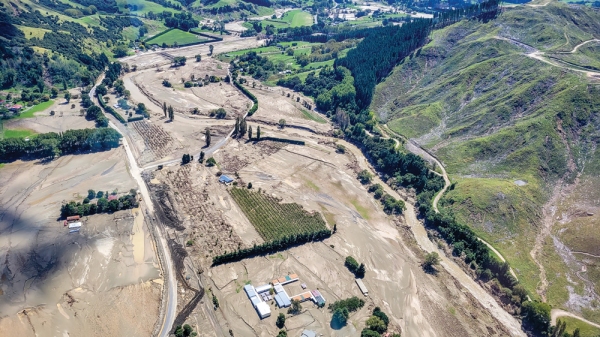
Sediment is one of the biggest challenges for communities facing the long road of recovery. It’s estimated that about eight million tonnes of river sediment and four million tonnes of hillside erosion lies in the Esk Valley alone.
Sediment transport scientist Dr Arman Haddadchi and environmental monitoring technician Hamish Sutton sampled 50 sites across the valley.
“The amount of sediment deposited through the lower catchment was mind-blowing, and just devastating to the agricultural and horticultural lands,” says Haddadchi.
“Lab analysis of the samples will help us understand more about particle size distribution, stratification and contamination by toxic chemical and biological substances.”
Dust created by the wind or clean-up activities, and smoke from debris burn off, is also compounding air quality problems.
To gain insights into what people are inhaling, NIWA air quality researchers led by Dr Elizabeth Somervell are working with local health and air quality experts to set up monitoring networks across Hawke’s Bay and Tairāwhiti.
These findings, along with the sediment sampling work, will help councils and communities make decisions about how best to tackle recovery.
Millions of tonnes of sediment have also poured out the river estuaries into Hawke Bay. NIWA marine scientists have begun mapping around 200km² of coastal seafloor using multibeam echosounder equipment.
This data will build on surveys carried out six years ago, assessing where the sediment outwash has settled and possible impacts on biodiversity and the marine environment.
Mā te haumaru ō te wai is a five-year research programme funded by the Ministry of Business, Innovation and Employment (MBIE). Led by Dr Emily Lane, the team is developing a system to map flood hazard consistently across the whole country.
It will reveal how flood risk across New Zealand will vary over the next 100 years, as climate-induced changes, such as rising rainfall and sea levels, interact with land-use changes.
In Gabrielle’s wake, the team refocused their efforts on urgent new flood hazard maps for the worst affected parts of Hawke’s Bay.
Additional investment by MBIE has enabled the work to be extended across the rest of the region and Tairāwhiti.
“We need to understand what will happen when the next extreme event comes our way. How have changes in riverbed levels and channels from sediment deposits altered the flood hazard? And what is the impact of the changing climate?” says Lane.
“Councils need to be able to respond to this event as quickly as possible to provide certainty to their residents. They are already making decisions about managed retreat and rebuilding stopbanks.”
In addition, NIWA and GNS Science have begun working directly with Cyclone Gabrielle recovery agencies using the RiskScape analysis tool.
RiskScape is a sophisticated software application that enables users to rapidly work out the dangers and impacts of a range of natural hazards.
It will help councils and other agencies make maximum use of the new flood maps, and other data being produced, to inform their response.
The version of RiskScape being used for the Gabrielle response includes a dashboard for agencies tasked with short- and long-term recovery decisions for individuals, communities and sectors.
“It’s highly customisable, and will let users input the data they’re interested in to assess vulnerability of assets and people to future storms and floods,” says NIWA hazard analyst Ryan Paulik.
“This will help response planning, including difficult discussions about things like managed retreat,” he says.
Back by the Tūtaekurī stopbank breach, Graeme Smart takes in the devastation around him.
He was here so quickly, he says it reminds him of his experience living through the Christchurch earthquakes and their aftermath. But he also talks warmly about the community spirit he witnessed then, and is seeing again now.
Smart clearly considers he is working for the local community, helping them respond to this disaster and prepare for the next.
“Until we had climate change, past behaviour of weather was the best indicator of future behaviour. This is getting really uncertain now because disastrous events like this are happening in many countries.
“It’s like there’s a step-change in the way that the climate is behaving and it’s very difficult for us to predict into the future,” says Smart.
“But whatever happens, if we measure what is happening, we’re partly on that journey.”
Adapting to change
World Weather Attribution (WWA) is an initiative led by climate scientists from Imperial College London that works to quantify the role of climate change in extreme weather events.
In February, WWA worked with NIWA climate scientist Dr Sam Dean and others to quickly determine the contribution of climate change to Cyclone Gabrielle’s intense rainfall. Such studies usually take years to complete.
The rapid nature of the study meant there was large uncertainty in the results. However, the team found evidence in rainfall measurements that very heavy rainfall is now more common in the affected regions, with climate change by far the most likely explanation.
“The study contributes to a wealth of evidence that here in Aotearoa New Zealand, adapting to a changing flood risk, now and for the foreseeable future, is one of the greatest challenges we face,” says Dean.