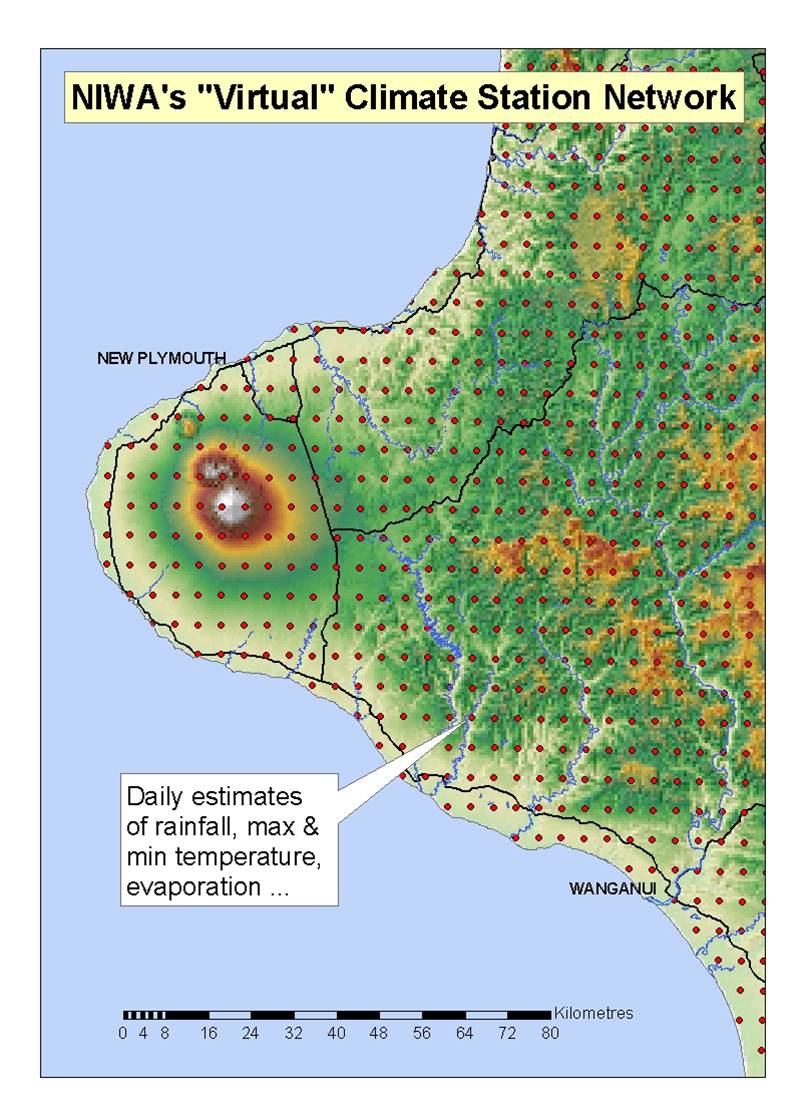
Virtual climate station estimates are produced every day, based on the spatial interpolation of actual data observations made at climate stations located around the country.
Virtual Climate Station Network (VCSN) data are estimates of daily rainfall, potential evapotranspiration, air and vapour pressure, maximum and minimum air temperature, 10cm earth temperature, relative humidity, solar radiation, wind speed and soil moisture on a regular (~5km) grid covering the whole of New Zealand (11491 virtual climate station locations). The virtual stations start with rain values only in 1960. From 1972 all listed VCSN variables except wind are available, and from 1997 includes wind. The estimates are produced every day, based on the spatial interpolation of actual data observations made at climate stations located around the country.
The operational Virtual Climate Station Network (VCSN) data are derived from around 150 automatic climate stations owned and operated by NIWA and MetService. These data are transmitted to and stored in NIWA’s National Climate Database, CliDB. The VCSN data are updated with a 2-day delay to ensure all the automatic station data are used. Each month the VCSN data for the previous month are regenerated to take into account any issues with data quality and to use additional manually-collected rainfall data.
A thin-plate smoothing spline model is used for the VCSN spatial interpolations. This model incorporates two location variables (latitude and longitude) and a third "pattern" variable. For example, for rainfall the 1951–80 mean annual rainfall digitised from an expert-guided contour map is used to aid the interpolation (Tait et al. 2006; Tait et al. 2012). The software used for the interpolations is ANUSPLIN (Hutchinson 2012). A similar interpolation procedure is used by the Australian Bureau of Meteorology to deliver estimated weather data at similar resolution over all Australia (Jeffrey et al. 2001).
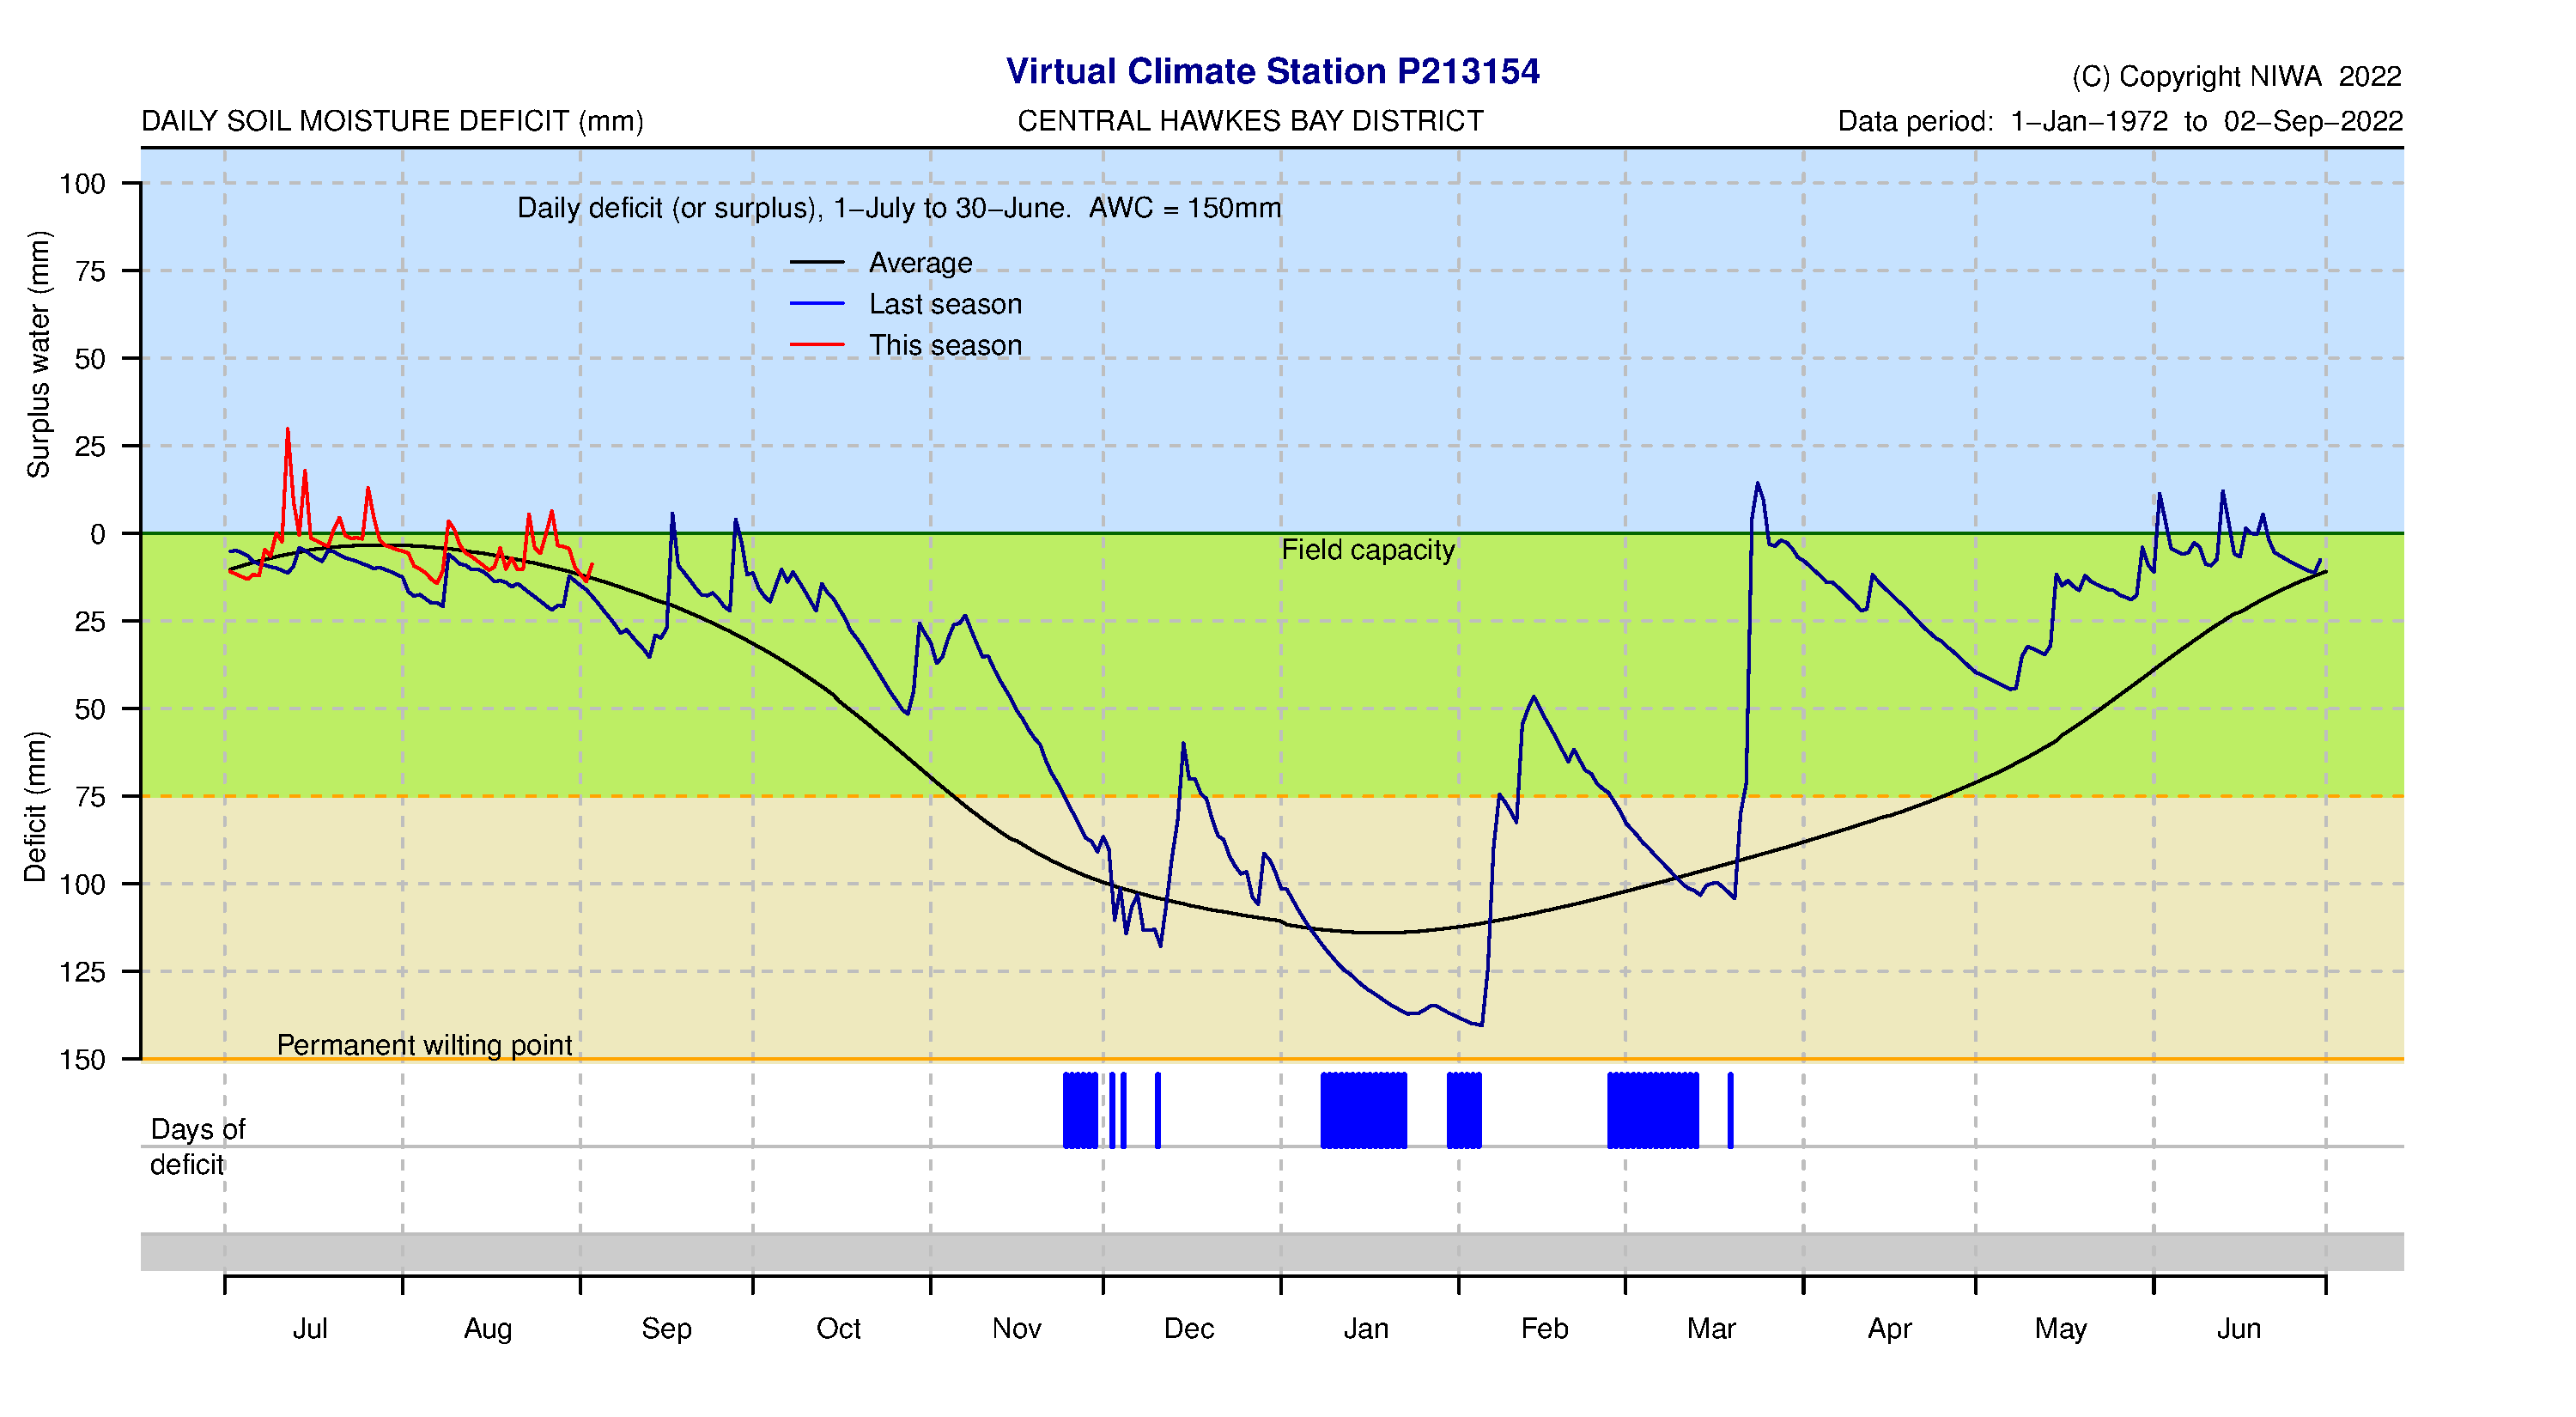
Soil moisture is derived (in mm) using a 1D water balance model, as desribed in Kandel et al. (2005). The model has one parameter, the soil store capacity (Smax). Rainfall is assumed to infiltrate into a soil store from which moisture is depleted by evapotranspiration loss. The model keeps track of the soil store for each timestep. When the soil store is full, it is assumed to be saturated and the excess rainfall becomes surface runoff. Evapotranspiration is assumed to continue at its potential rate until the soil water store drops to half capacity. Evapotranspiration then decreases linearly to zero when the store is empty. For the simulations here, a Smax value of 150 mm is used for all the modelling grids.
VCSN data details
- Sample VCSN dataset
- Geospatial layer representing the VCSN grid points
- Virtual Climate Station Network (VCSN) data technical description
VCSN data access
References
Cichota R, Snow V, Tait A 2008. A functional evaluation of virtual climate station rainfall data. New Zealand Journal of Agricultural Research, 51(3), 317–329.
Clark M, Hreinsson E, Martinez G, Tait A, Slater A, Hendrikx J, Owens I, Gupta H, Schmidt J, Woods R, 2009. Simulations of seasonal snow for the South Island, New Zealand. Journal of Hydrology (NZ), 48(2), 41-58.
Hutchinson M, 2012. ANUSPLIN version 4.3. https://researchers.anu.edu.au/publications/38018
Jeffrey SJ, Carter JO, Moodie KB, Beswick AR 2001. Using spatial interpolation to construct a comprehensive archive of Australian climate data. Environmental Modelling & Software 16(4): 309–330.
Kandel DD, Chiew FHS, Grayson RB, 2005. A tool for mapping and forecasting soil moisture deficit over Australia. Cooperative Research Centre for Catchment Hydrology, Technical Report 05/02, 18 pp. (ISBN 1-920813-21-7).
Romera A, Beukes P, Clark C, Clark D, Levy H, Tait A, 2010. Use of a pasture growth model to estimate herbage mass at a paddock scale and assist management on dairy farms. Computers and Electronics in Agriculture, 74(1), 66–72.
Tait A, Turner R 2005. Generating multiyear gridded daily rainfall over New Zealand. Journal of Applied Meteorology 44(9): 1315–1323.
Tait A, Henderson R, Turner R, Zheng XG 2006. Thin plate smoothing spline interpolation of daily rainfall for New Zealand using a climatological rainfall surface. International Journal of Climatology 26(14): 2097–2115.
Tait A., Woods R 2007. Spatial interpolation of daily potential evapotranspiration for New Zealand using a spline model. Journal of Hydrometeorology, 8, pp 430–438.
Tait A, 2008. Future projections of growing degree days and frost in New Zealand and some implications for grape growing. Weather and Climate 28, 17-36.
Tait A, Liley B, 2009. Interpolation of daily solar radiation for New Zealand using a satellite data-derived cloud cover surface. Weather and Climate, 29, 70-88.
Tait A, Sturman J, Clark M, 2012. An assessment of the accuracy of interpolated daily rainfall for New Zealand. Journal of Hydrology (NZ), 51(1), 25-44.
Related links
Virtual Climate Station Network (VCSN) data technical description
-

Virtual Climate Station Network (VCSN) data technical description
Virtual Climate Station Network (VCSN) data technical description