NIWA can map any aspect of climate.
For example:
- Where can I grow grapes?
- Where could we best locate a wind farm?
- Do I need to upgrade my flood protection scheme?
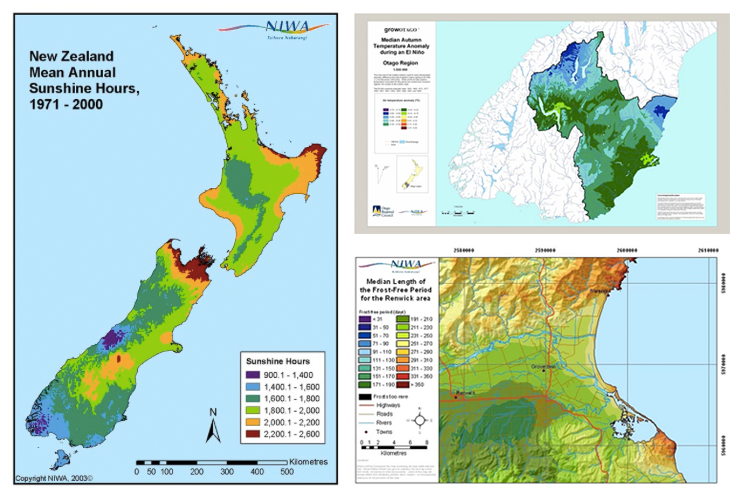
All our maps have been updated to the latest 30-year climate normal period, 1981-2010. We can map from the national, through to the regional, to the local.
More information on national and regional climate maps
The data behind our maps
We build our maps using data from NIWA’s extensive national climate database, satellite data, and output from global-scale and local-scale climate models. Our maps are created using a Geographic Information System (GIS). As a result, we can make attractive images and provide valuable climate information as digital layers to be incorporated into your specific project.
An analysis of the mapping error
We have performed a detailed analysis of the spatial interpolation model prediction error for a number of climate variables. The analysis can be downloaded below.
Model prediction error analysis (PDF 3.1 MB)
Many uses for NIWA mapping services:
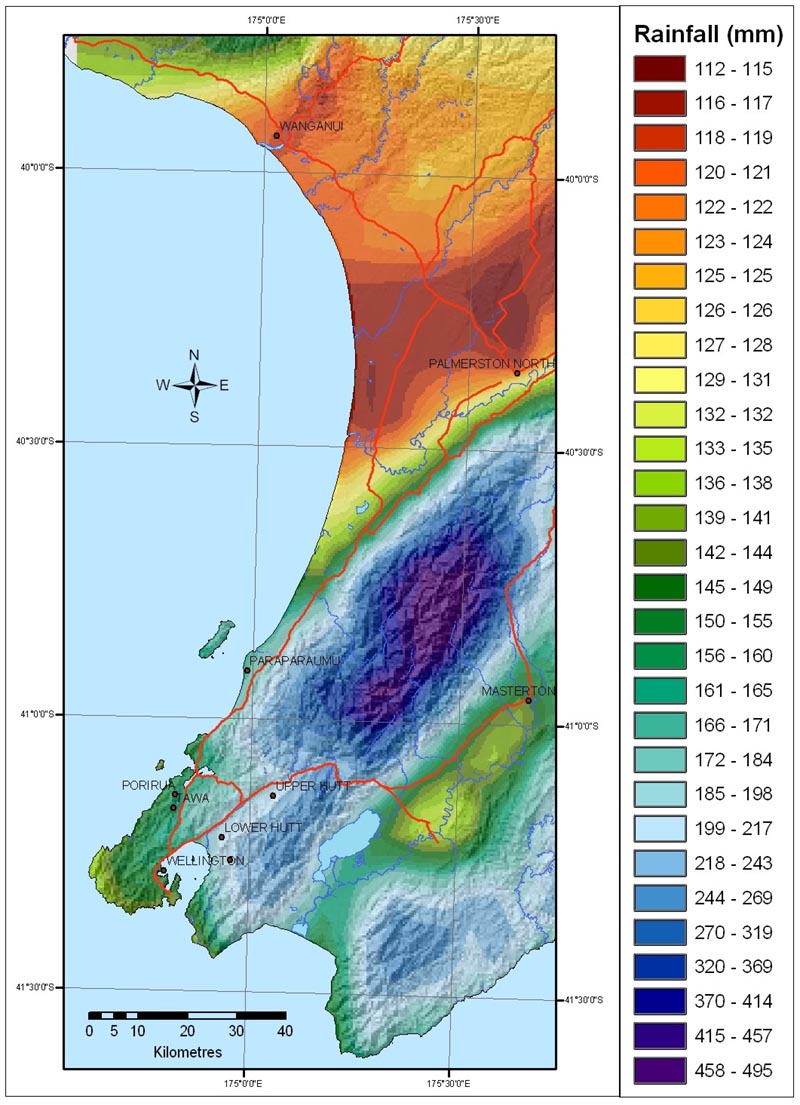
Flood estimation
The map below of the 100-year return period 24-hour rainfall total for the lower North Island is based on a High Intensity Rainfall Design System (HIRDS). It can be used for the estimation of design rainfalls (e.g., for river flood estimation), and to assess the rarity of observed storm events.
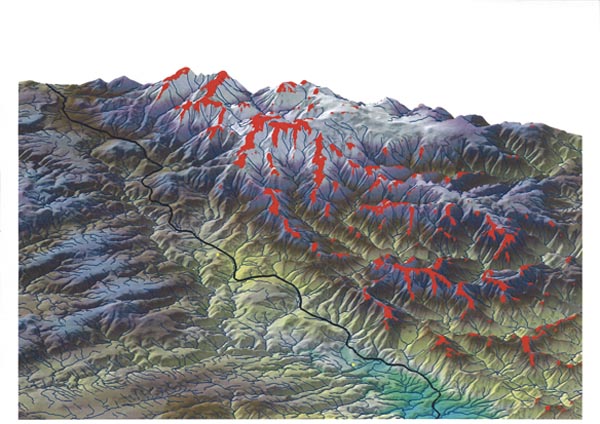
Wind power generation
Potential sites for wind power generation are shown in red. The sites have been identified as having a mean annual wind speed of more than 8 m/s (28.8 km/h) - see the map to the right for an example.
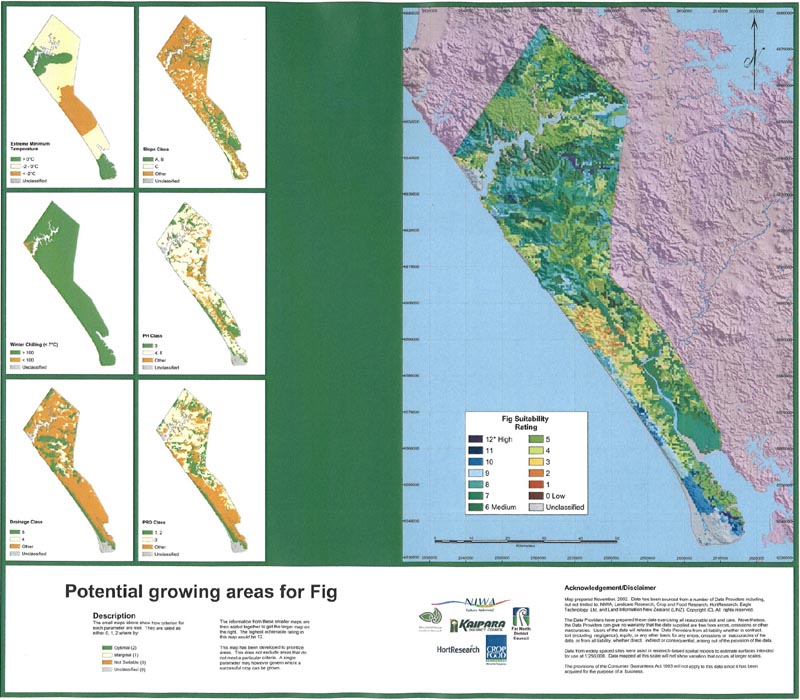
Crop sustainability
Combining maps of climate parameters with soil maps and specific crop requirement information enables us to produce crop suitability maps like this one showing the potential growing areas for fig. The map below was created for the Kaipara and Far North District Councils.
Types of climate maps available
You can get maps of the following climate parameters:
- rainfall total
- number of days of rain
- air temperature
- soil temperature
- sunshine hours
- solar radiation
- potential evapotranspiration
- relative humidity
- growing degree days
- cooling degree days
- wind speed
All maps are available as GIS layers.
Variability
Often, understanding the variability is just as important as knowing the mean conditions. We can show the variability of the data by mapping the standard deviation, or the range, or the one-year-in-ten high and low values, or the number of days in excess of a specified threshold.
Also, we can produce special combination maps, such as the mean annual number of days with rainfall greater than 1mm and maximum temperature less than 5°C, for example.
Other climate data products from NIWA
Acknowledgements
NIWA’s climate mapping research has been funded by the Foundation for Research Science and Technology under the Public Good Science Fund contract C01X0202, “Adaptation to Climate Variability and Change”.
Climate mapping projects for the specific areas shown here have been additionally funded by Otago Regional Council, Tararua District Council, Far North District Council, Kaipara District Council, private businesses, and individuals.
-

Other Climate data products
Short-term to long-term data estimation