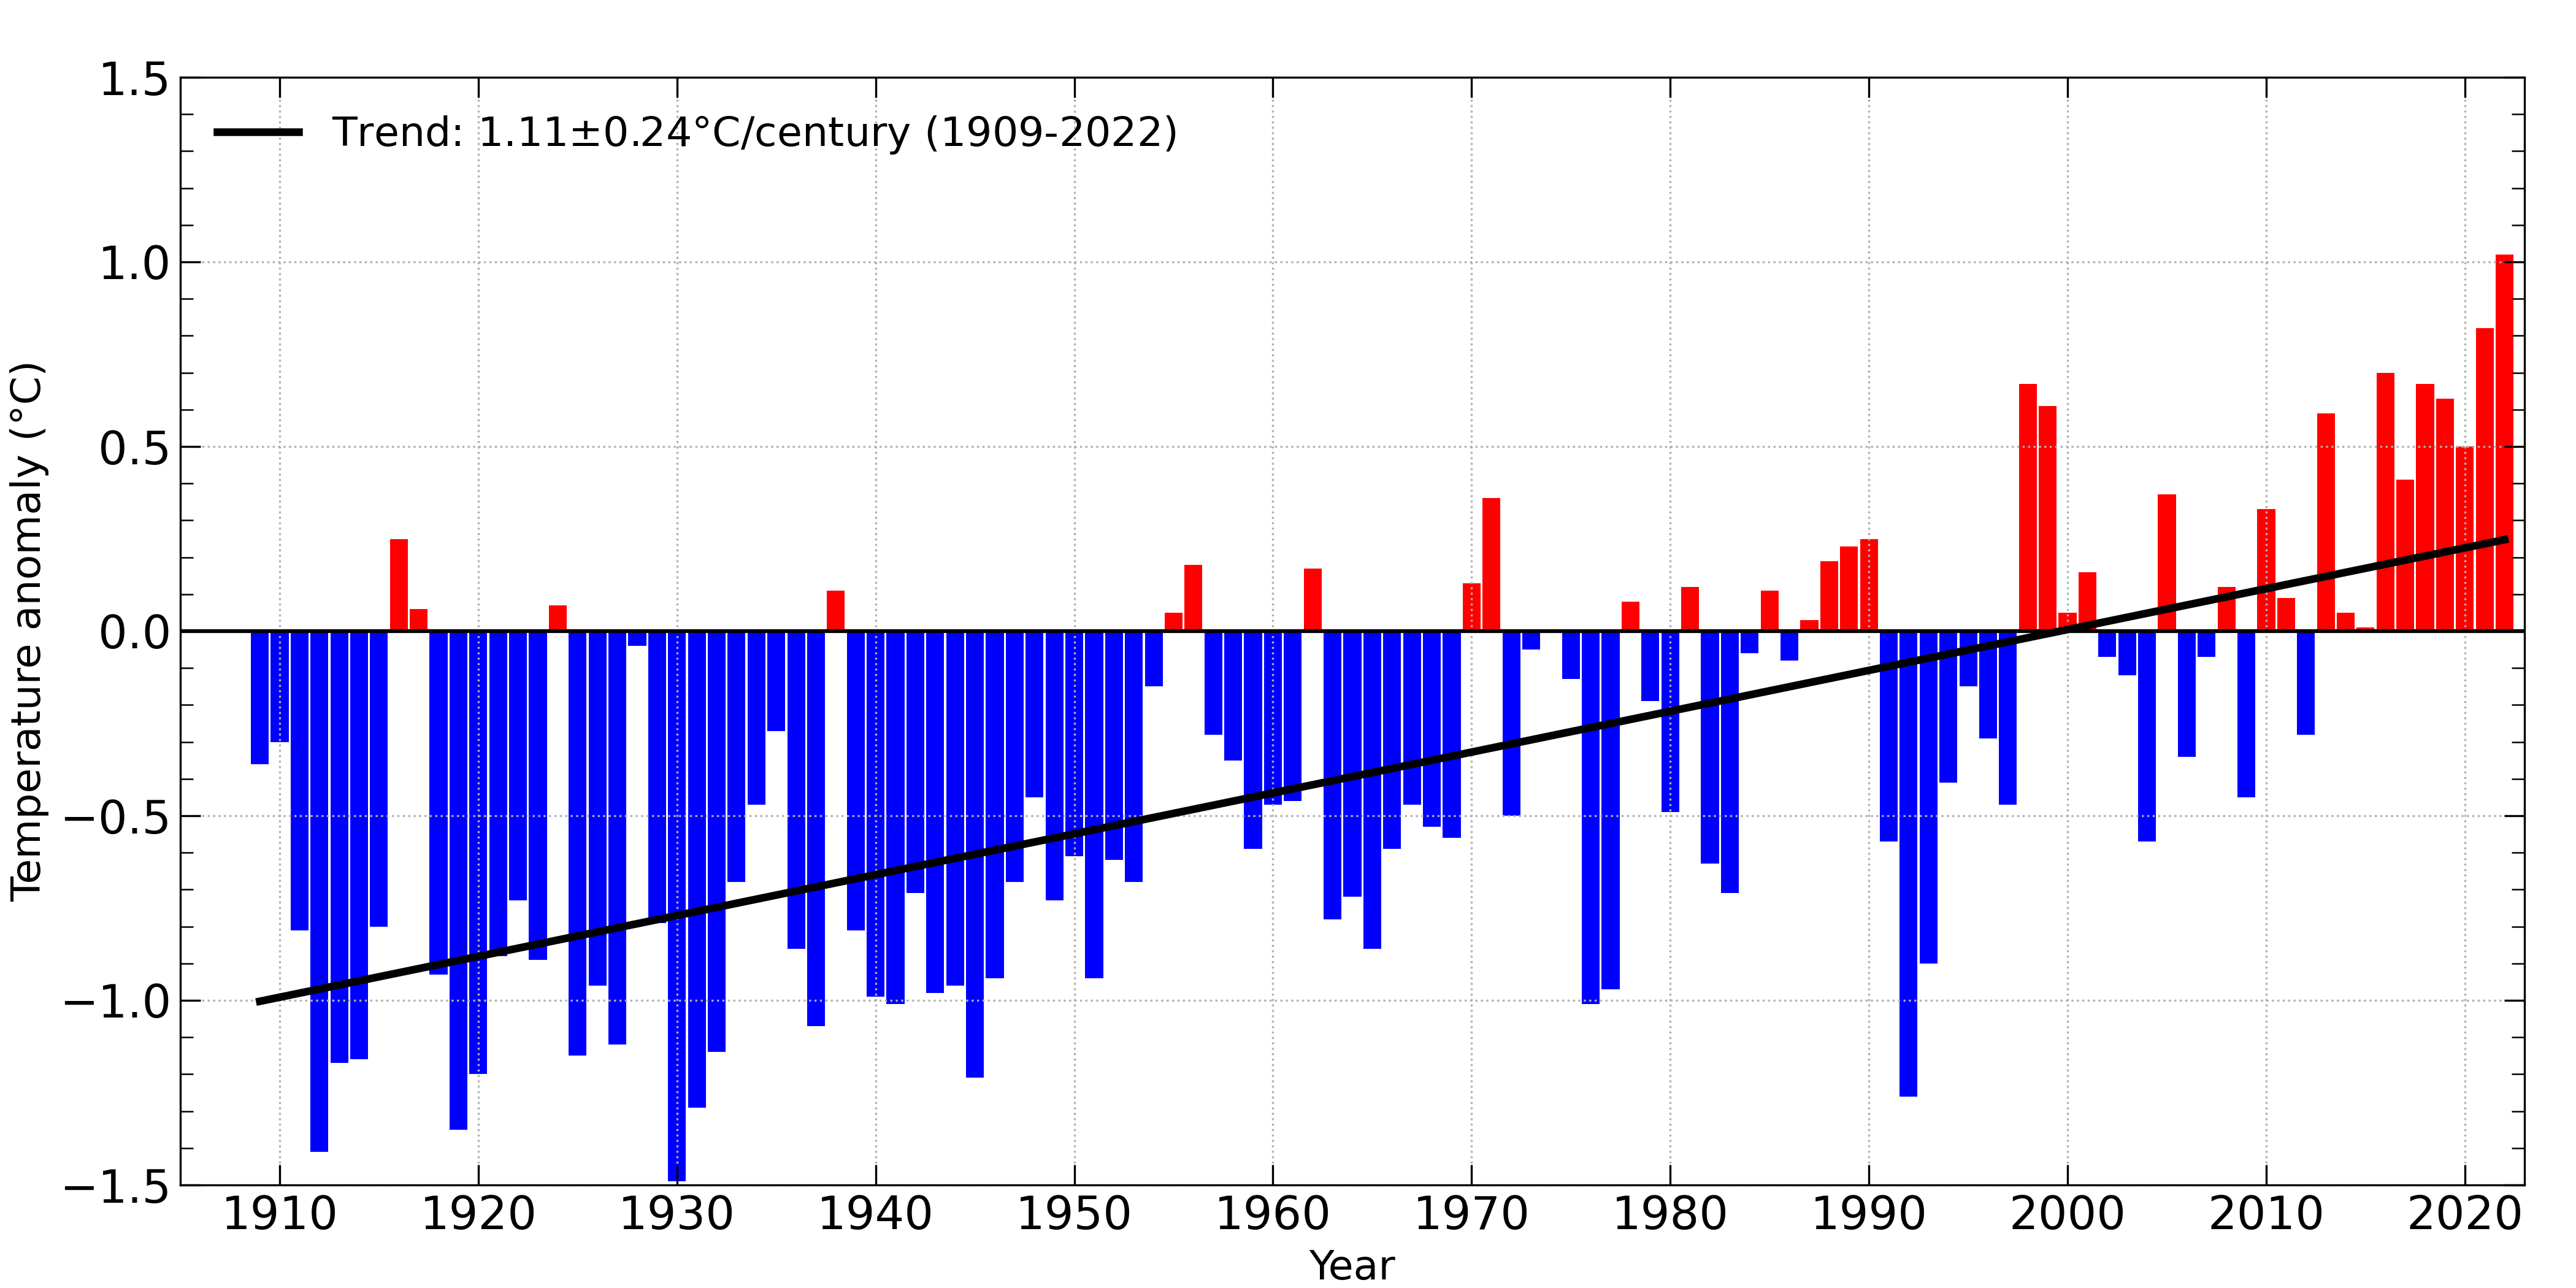
NIWA's long-running 'seven-station' series shows NZ's average annual temperature has increased by about 1°C over the past 100 years.
Warmest years
The warmest year since the start of this record in 1909 is the year 2022, with an annual mean temperature of 13.76°C, or +1.02°C above the 1991-2020 average.
The five warmest years on the basis of monthly mean temperatures are:
- 2022 (+1.02˚C),
- 2021 (+0.82°C)
- 2016 (+0.70˚C)
- 2018 and 1998 (tied on +0.67°C).
The five warmest years on the basis of monthly maximum temperatures are:
- 2022 (+0.94˚C)
- 2021 (+0.79˚C)
- 1998 (+0.75˚C)
- 2016 (0.73˚C)
- 1999 (+0.71˚C).
The five warmest years on the basis of monthly minimum temperatures are:
- 2022 (+1.09˚C)
- 2021 (+0.86˚C)
- 2018 (+0.81˚C)
- 2016 (+0.67˚C)
- 1998 (+0.59˚C).
NZ 7-station annual average temperature, minus 1991-2020 normal (adjusted for site changes):
Locations in the "seven station" series
The series has been derived from seven locations. These locations were chosen because they provide broad geographical coverage and long records (with measurements started at all sites by 1909):
- Auckland
- Masterton
- Wellington
- Hokitika
- Nelson
- Lincoln
- Dunedin
How the 'seven-station' series is constructed
For each location, temperature records from a number of local sites have been merged together to form a long time series. When merging different temperature records like this, it is necessary to adjust for climatic differences from place-to-place, or even changes in exposure or instrumentation at the same site. If no adjustments are made, significant biases could be introduced. For example, the longest record in the country comes from Dunedin, with climate readings taken at six sites throughout its history.
Learn more about why climate data sometimes need to be adjusted
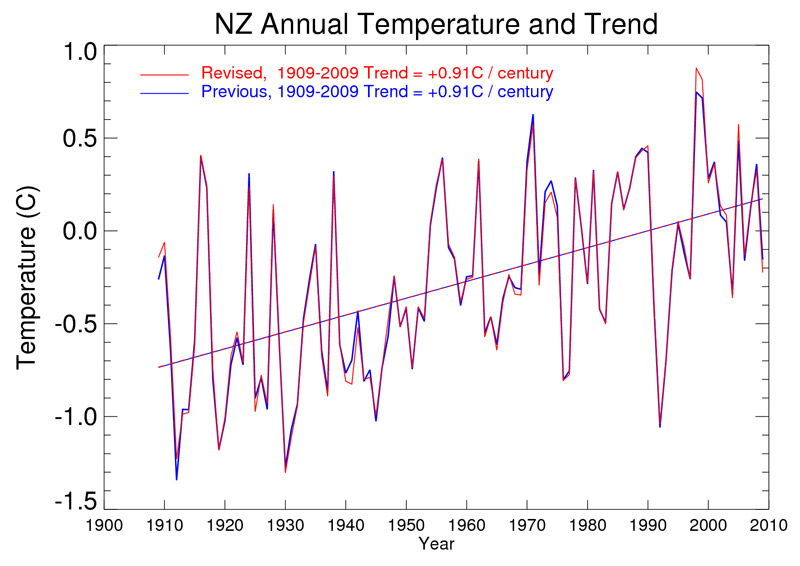
Our new analysis confirmed the warming trend
An overall review of the seven station adjustments was performed in 1992. In 2010, as a result of increased interest in the series, NIWA re-analysed the adjustments for the seven locations.
The key result of this revisiting was that the New Zealand-wide warming trend was almost exactly the same as in the previous assessment. In other words, either approach gives an accurate trend result. So without a doubt, on the basis of the 'seven-station' series, New Zealand did indeed get about 0.9°C warmer over the course of last one hundred years.
The pattern of warming is also consistent with changes in sea surface temperature and prevailing winds.
In terms of the detail, the re-analysis concluded that some sites have warmed more than previously calculated, and other sites warmed less, but these variations between the old and new series are within the margin of error.
This overview document discusses the revision of the 'seven-station' series in more detail:
Summary of NIWA’s “Seven-Station” Temperature Series, December 2010 (PDF 293 KB)
The adjusted data
This spreadsheet contains the adjusted annual data used to compile the 'seven-station' series:
NIWA 'seven-station' temperature series: annual data for mean temperature [XLS 23 KB]
In this file, you will find:
- annual average temperature for each location, and for the 7 locations combined
- annual anomaly (difference from the 1981-2010 average) for each location, and for the 7 locations combined.
This spreadsheet contains the adjusted monthly data for the 'seven-station' composite series:
NIWA 'seven-station' temperature series: monthly data for mean temperature [XLS 20 KB]
In this file, you will find:
- monthly and annual average temperature anomaly (difference from the 1981-2010 average), averaged over the 7 locations
- monthly and annual average temperature climatology (the 1981-2010 average), averaged over the 7 locations.
Note, also, that:
- similar Excel files can be obtained from NIWA (through [email protected]) for the annual minimum temperatures and maximum temperatures for the 7-station series
- in the 2010 Review, the anomalies were calculated relative to the 1971-2000 average, but have since been updated relative to the 1981-2010 climatological average. This does not alter the actual site temperatures or the trend, only the anomaly.
- a change has been to one of the Hokitika adjustments since the 2010 Review report. See the revised January 1945 adjustment
- other changes to the raw data are detailed on the additional technical notes page
Schedule of adjustments
NIWA has documented its analysis for each of the 7 locations, including all the station offsets used to merge temperature records for each place:
More information about the offsets
Scientific references about the temperature series adjustment process, and the internationally accepted best practice approaches to adjusting raw climate data to accurately calculate temperature trends:
Download a combined report
A report is available which includes the overview and the reports for each of the seven stations:
Report on the Review of NIWA’s ‘Seven-Station’ Temperature Series [PDF 8MB]
Each of these documents is available separately by following the other links on this page.
Changes to this page
Over time NIWA has added new material to this section and refined the way that it is presented. For transparency these changes are detailed:
-

Why climate data sometimes need to be adjusted
How do climate scientists identify a real temperature trend? -
Combining data from multiple sites in Auckland
Temperature measurements made at three sites in Auckland over roughly the same period -
Combining temperature data from multiple sites in Wellington
Early temperature measurements were made at a site in Thorndon, but the site was relocated in 1928 to Kelburn: 120m higher -
Technical note: some points of detail about adjustments for Auckland
Missing data
Breaks in the lines on the temperature graphs occur where there are missing data. For the purpose of this illustration, annual averages are calculated only where there is a complete year of monthly values available on the NIWA Climate Database. In the case of Albert Park, some data are missing due to persistent vandalism of equipment there. -
Technical note: some points of detail on adjustments for Wellington
Making adjustments when combining data from multiple sites in Wellington