On this page
- What is a climate change scenario?
- Downscaling to New Zealand
- New Zealand regional climate change scenarios
- Changes in extremes
- References
This material is based on the IPCC 6th Assessment report.
For a summary of likely impacts based on the IPCC 6th Assessment report, see Aotearoa New Zealand climate change projections guidance.
See Climate Change Projections for New Zealand for the detailed 2016 NIWA report to Ministry for the Environment on New Zealand climate change projections based on the IPCC 5th Assessment.
What is a climate change scenario?
Predicting human-induced ("anthropogenic") changes in climate, over the next 100 years, for a particular part of New Zealand requires:
- A prediction of global greenhouse gas and aerosol emissions for the next century
- A global carbon cycle model to convert these emissions into changes in carbon dioxide concentrations (and similar models for calculating concentrations of other greenhouse gases and aerosols)
- A coupled atmosphere-ocean global circulation model (AOGCM) which uses the greenhouse gas and aerosol concentration information to predict climate variations forward in time.
- Downscaling of the AOGCM results through a procedure which takes account of the influence of New Zealand’s topography on local climate. This can be done either statistically or with a high resolution regional climate model.
Given our current knowledge and modelling technology, there are uncertainties in each of these steps. For example, emission predictions depend on the difficult task of predicting human behaviour, such as changes in population, economic growth, technology, energy availability and national and international policies, including predicting the results of international negotiations on constraining greenhouse gas emissions. Our understanding of the carbon cycle and of sources and sinks of non-carbon dioxide greenhouse gases is still incomplete. As discussed in NIWA’s climate modelling web page, there are significant uncertainties in current global climate model predictions—particularly at the regional level.
The climate change scenario approach recognises these uncertainties. A scenario is a scientifically-based projection of one plausible future climate for a region. For guidance on regional impacts of climate change, a range of scenarios is desirable. These can span credible estimates of future greenhouse gas emissions, and the uncertainty range in climate model predictions.
IPCC 6th assessment scenarios
Shared Socioeconomic Pathways (SSPs) (O’Neill et al., 2017). The SSP scenarios start in 2015, and are abbreviated as SSP1-1.9, SSP1-2.6, SSP2-4.5, SSP3-7.0 and SSP5-8.5, in the order of increasing greenhouse gas emissions. The SSPs represent the outcomes of a range of twenty-first century climate policies. The following definition of each SSP is adapted from IPCC (2021):
- SSP1-1.9 and SSP1-2.6 are scenarios with very low and low greenhouse gas emissions, with CO2 emissions declining to net zero around or after 2050, followed by varying levels of net negative CO2 emissions.
- SSP2-4.5 is an intermediate greenhouse gas emissions scenario, with CO2 emissions remaining around current levels until the middle of the century.
- SSP3-7.0 and SSP5-8.5 are high and very high greenhouse gas emissions scenarios, with CO2 emissions that roughly double from current levels by 2100 and 2050, respectively.

Downscaling to New Zealand
Six GCMs were selected for ‘dynamical’ downscaling, and some results are presented below. For this downscaling approach, six models were used to drive a global atmopsheric model with higher resolution over New Zealand.

The six models were chosen to validate well on present climate. Daily output data were further downscaled to a 5-kilometre grid for the following climate variables:
Table: Summary details of the various climate indicators provided through a web portal hosted by the Ministry for the Environment. A cross indicates whether the indicator is provided in annual and seasonal formats.
| Climate Indicator | Annual | Seasonal | Units historical | Units change | Additional Details |
| T | x | x | °C | °C | Daily mean 2m air temperature |
| TX | x | x | °C | °C | Daily maximum 2m air temperature |
| TN | x | x | °C | °C | Daily minimum 2m air temperature |
| DTR | x | x | °C | °C | Daily temperature range |
| TX25 | x | x | days | days | Number of hot days (>25°C) |
| TX30 | x | x | days | days | Number of very hot days (>30°C) |
| FD | x | x | days | days | Number of frost days (<0°C) |
| TXx | x | °C | °C | Temperature on hottest day of the year | |
| TNn | x | °C | °C | Temperature on coldest day of the year | |
| GDD5 | x | GDD | GDD | Growing degree days (base 5°C) 1 - accumulated number of degrees above 5°C | |
| GDD10 | x | GDD | GDD | Growing degree days (base 10°C) 1 | |
| CD18 | x | CDD | CDD | Cooling degree days (base 18°C) 2 - accumulated number of degrees above 18°C | |
| HD18 | x | HDD | HDD | Heating degree days (base 18°C) 3 - accumulated number of degrees below 18°C | |
| PR | x | x | mm | % | Total rainfall |
| DD1mm | x | x | days | days | Number of dry days (<1mm) |
| RR1mm | x | x | days | days | Number of wet days (≥1mm) |
| RR25mm | x | x | days | days | Number of heavy rainfall days (>25mm) |
| R99pVAL | x | x | mm | % | Heavy rainfall value (99th percentile) |
| PEDsrad | x | mm | mm | Potential evapotranspiration deficit Calculated using a water balance model with precipitation and potential evapotranspiration (PET). | |
| sfcWind | x | x | m s-1 | % | Average daily 10m wind speed |
| Wd10 | x | x | days | days | Number of days with average wind speed above 10 m s-1 |
| Wd99pVAL | x | x | m s-1 | % | Strong winds value (99th percentile) |
| hurs | x | x | % | % | Average relative humidity |
| rsds | x | x | W m-2 | W m-2 | Incoming solar radiation |
2,3. https://www.ipcc.ch/report/ar6/wg1/downloads/report/IPCC_AR6_WGI_Annex_VI.pdf
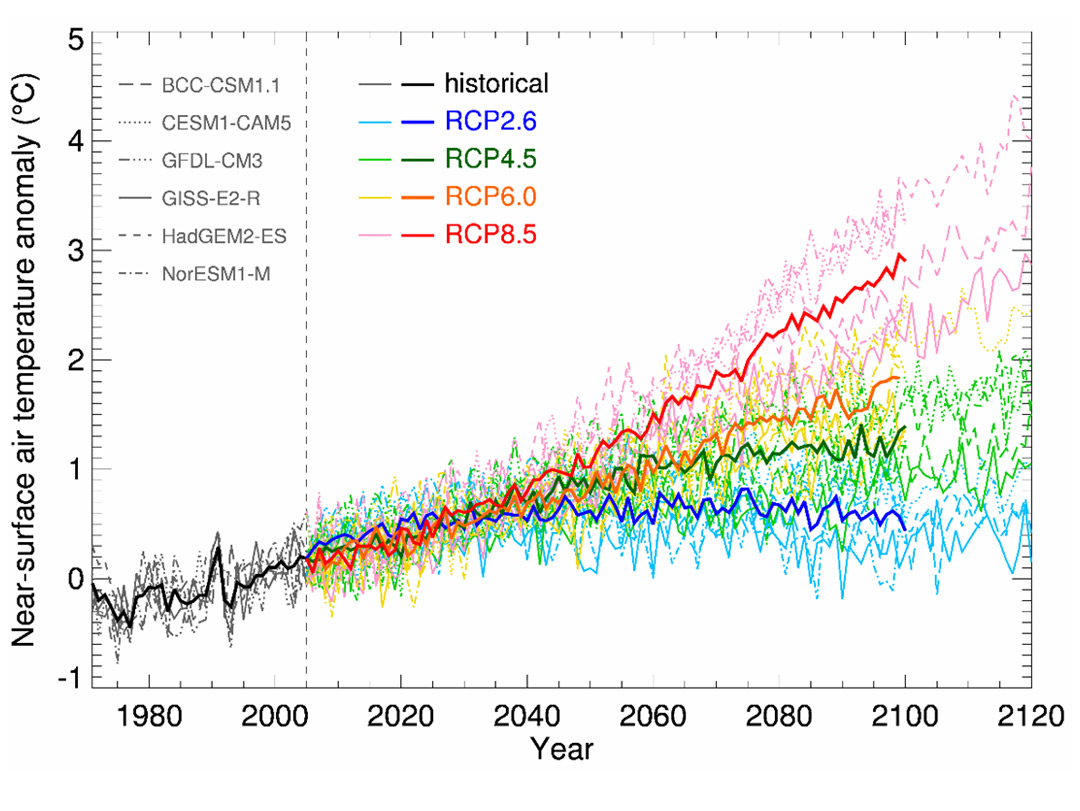
Figure 2 shows temperature projections over New Zealand to the year 2120 from the 24 climate simulations carried out by NIWA (6 models by 4 SSPs).
New Zealand regional climate change scenarios
Mean temperature
Figure 3 below shows the regional model projections of New Zealand mean temperature at the end of the century (2081-2090 average, relative to 1986-2005) under SSP2-4.5 and SSP3-7.0. Temperature increases everywhere, and the increases tend to be larger in summer, and in the North Island, and at higher altitude.

Precipitation
Figure 4 below shows the regional model projections of New Zealand mean precipitation at the end of the century (2081-2090 average, relative to 1986-2005), under RCP8.5. In summer, precipitation generally either decreases or shows little change for most of the country, except for the West Coast of the South Island, and parts of Canterbury. In winter, precipitation changes show a pattern of increases in the west and south, and decreases in the east and north of the country, reflecting an increase in prevailing westerly quarter winds. Small changes in precipitation are usually a consequence of lack of consensus between the different climate models in the seasonal changes in circulation.

Changes in extremes
The greatest impact of climate change is likely to be experienced first by changes in extremes rather than by changes in mean conditions.
High and low temperature extremes
Increasing temperatures result in more “hot days” and fewer frosts. Figure 5 quantifies these changes by the end of the century. New Zealand, with its maritime climate, does not experience the extreme high temperatures that occur in many other parts of the world. A daily maximum temperature threshold of 25°C has therefore been chosen to mark a “hot day” in Figure 5. This threshold has a practical application for New Zealand agriculture—beef and dairy cattle tend to start experiencing heat stress at temperatures above this threshold.
Hot days increase much more in already warmer regions of the country (like the north of the North Island), whereas cold (frosty) nights will show much larger decreases in occurrence in colder regions. For example, very little change in frost frequency occurs in warmer coastal parts of the North Island.

Heavy rainfall and dry days
A warmer atmosphere can hold more moisture, and so the potential for more intense rainfall events is increased. Cycling of water through the atmosphere (i.e., evaporating from the surface, transportation by winds, and ultimately precipitating out) accelerates under global warming by about 3% per degree of warming, which is not as fast as the rate of increase in moisture holding capacity (about 7-8% per degree of warming). Thus, recharge of atmospheric moisture takes a bit longer and results in more dry days in many locations. Thus for rainfall, as opposed to temperatures, extremes increase at both ends of the spectrum: more heavy rainfall and more dry days.
Figure 6 illustrates this pattern of extremes. Almost the entire country shows some increase in heavy rainfall, with increase above 30% in much of Otago and Southland. “Heavy” or “extreme” rainfall is defined here as the 99th percentile of the daily rainfall distribution over 1986-2005 (at every 5 km pixel on the map). For places where it rains, on average, every 3 or 4 days, this corresponds approximately to the average annual maximum. More extreme rainfall, such as 1 in 100 year events, are expected to show even larger increases.
The number of dry days (daily precipitation of less than 1mm) increases over most of New Zealand. The banded pattern over the Southern Alps is thought to be due, at least in part, to more precipitation falling as rain which falls out more quickly in the west, compared to snow which falls more slowly and gets carried further across the mountains.

Strong winds
Figure 7 shows projected changes in strong winds. As with rainfall, the 99th percentile threshold is determined (for both present and future climate) by ranking daily values over a 20-year period (1986-2005 and 2081-2100). The figure maps the percentage change in the 99th percentile threshold.
The largest increases in extreme daily wind speed occur in coastal Canterbury and central Otago, with increases in excess of 10%, by the end of the century. It is likely that these increases are associated with stronger foehn winds in the lee of the Southern Alps, occurring in winter and spring with stronger prevailing westerlies.
References
Intergovernmental Panel on Climate Change (IPCC). 2013. Climate Change 2013: The Physical Science Basis. Contribution of Working Group I to the Fifth Assessment Report of the Intergovernmental Panel on Climate Change [Stocker, T.F, D. Qin, G.-K. Plattner, M. Tignor, S.K. Allen, J. Boschung, A. Nauels, Y. Xia, V. Bex and P.M. Midgley (eds.)]. Cambridge University Press, Cambridge, United Kingdom and New York, NY, USA, 1535 pp, doi:10.1017/CBO9781107415324.
Ministry for the Environment, 2016. Climate Change Projections for New Zealand: Atmospheric Projections based on Simulations undertaken for the IPCC Fifth Assessment. Prepared by A.B. Mullan, A. Sood, and S. Stuart. NIWA Client Report WLG2015-31. June 2016.
van Vuuren DP, Edmonds J, Kainuma M, Riahi K, Thomson A, Hibbard K, Hurtt GC, Kram T, Krey V, Lamarque JF, Masui T, Meinshausen M, Nakicenovic N, Smith S, Rose SK. 2011. The representative concentration pathways: an overview. Climatic Change 109: 5–31.