A weekly update describing soil moisture patterns across the country to show where dry to extremely dry conditions are occurring or imminent. Regions experiencing significant soil moisture deficits are deemed “hotspots”. Persistent hotspot regions have the potential to develop into drought.
Facts: Soil Moisture
In the North Island, the past week (through 9 March) resulted in generally little rainfall for most locations. Typically amounts were less than 15 mm, with particularly meagre amounts observed in Northland and Auckland. Pockets of higher rainfall amounts were observed in Bay of Plenty, Hawke’s Bay, and Wellington, where a few areas saw as much as 30-50 mm. This resulted in nearly all of the North Island seeing moderate soil moisture decreases in the past week, with the greatest decreases observed in northern and western regions. The driest soils across the North Island, when compared to normal for this time of the year, are found in western Taranaki and coastal Horowhenua, while the wettest soils for this time of the year are found along most of the east coast.
No hotspots are currently located in the North Island.
In the South Island, heavy rain was observed in the past week (through 9 March) across most of the West Coast, where amounts of 150-200 mm or more were observed, particularly in higher terrain. Amounts of 30-75 mm were also widespread across the remainder of the West Coast, Tasman, much of Canterbury, and Fiordland. Meanwhile, lower amounts of less than 25 mm were observed in Nelson, Marlborough, Otago, and Southland. This resulted in substantial soil moisture increases for most of the West Coast, interior Canterbury, and Fiordland. However, some further drying occurred in Southland. The driest soils in the South Island, when compared to normal for this time of the year, are located in coastal Buller District and interior Southland, while the wettest soils for this time of the year are found in northern Canterbury.
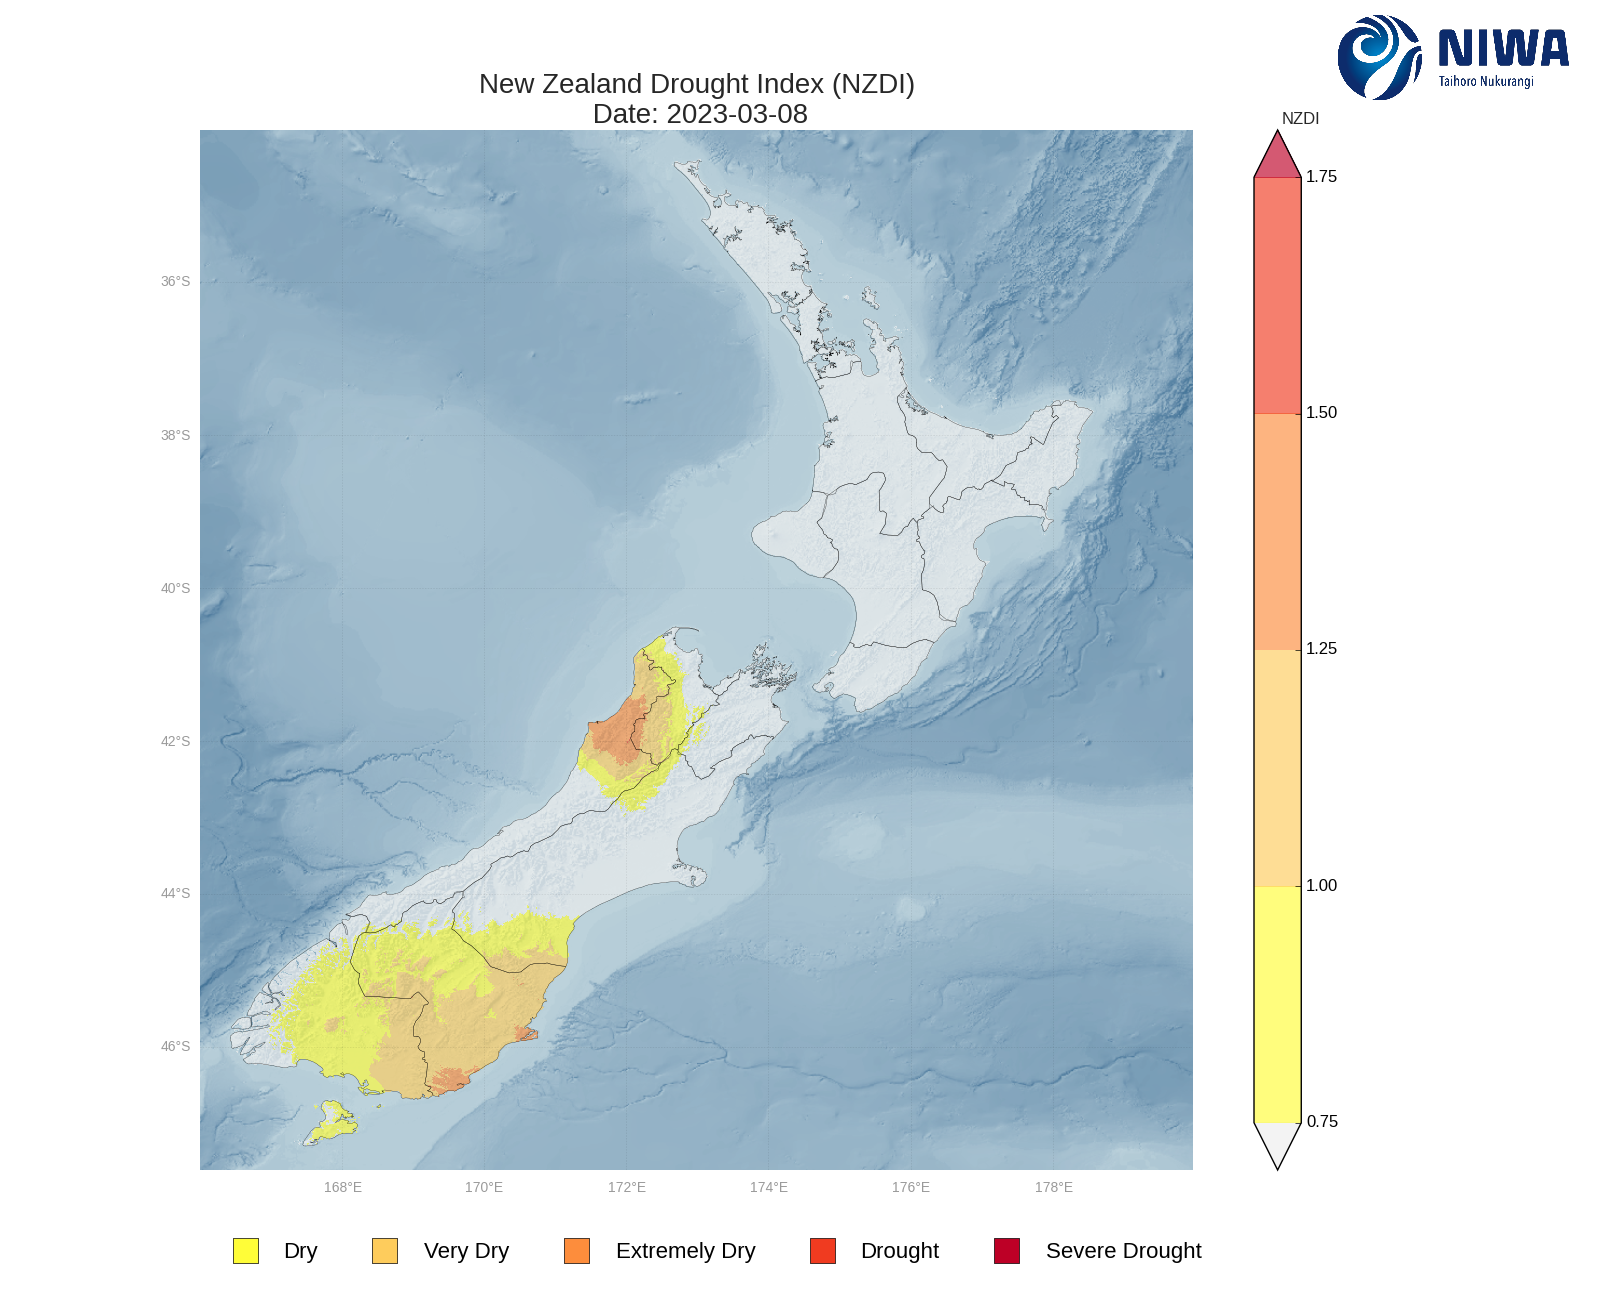
Previous hotspots in coastal Buller District have dissipated in the past week, while scattered hotspots remain across southeastern Otago and interior Southland. As of 8 March, the New Zealand Drought Index (NZDI) map below shows that dry to extremely dry conditions are located in the upper West Coast, southern Tasman, southern Canterbury, and much of Otago and Southland.
Outlook and Soil Moisture
In the North Island, a passing front is bringing areas of heavy rainfall and thunderstorms today (10 March), but conditions will ease this evening and overnight. After generally dry weather over the weekend, a passing front will bring showers on Monday (13 March). High pressure then returns during the middle of next week. There is a chance that more rain could approach New Zealand late next week (approx. 16-17 March), but the confidence level at this time is low. Weekly rainfall totals of 25-40 mm are possible in western and central parts of the North Island, but amounts of less than 25 mm are forecast in parts of Northland, Auckland, and most of the east coast.
Due to the expected rainfall in the next week, soil moisture levels may increase slightly in the western North Island, while at least minor decreases may occur in eastern Northland, Auckland, and the east coast. No hotspots are expected to form in the next week.
In the South Island, most areas will see dry weather through Sunday morning, followed by a front that will deliver moderate to heavy rain to the lower South Island and West Coast from Sunday afternoon to Monday morning (12-13 March). An area of high pressure will then build overhead, delivering generally dry weather through late next week. Weekly rainfall totals of 75-100 mm will be possible from the central West Coast to Fiordland, with lesser amounts in the upper West Coast. Otago and Southland could see 20-40 mm, with amounts of 20 mm or less expected for much of the east coast.
Due to the expected rainfall in the next week, soil moisture levels may increase slightly in the lower West Coast, Southland, and Otago, while soil moisture decreases are likely across much of Canterbury. The current hotspots in Otago and Southland may weaken at least slightly during the next week.
For more information on the potential for dryness in the weeks to come, please check out the drought forecasting tool, a collaboration between NIWA and the Ministry for Primary Industries.
Background:
Hotspot Watch: a weekly advisory service for New Zealand media. It provides soil moisture and precipitation measurements around the country to help assess whether extremely dry conditions are imminent.
Soil moisture deficit: the amount of water needed to bring the soil moisture content back to field capacity, which is the maximum amount of water the soil can hold.
Soil moisture anomaly: the difference between the historical normal soil moisture deficit (or surplus) for a given time of year and actual soil moisture deficits.
Definitions: “Extremely” and “severely” dry soils are based on a combination of the current soil moisture status and the difference from normal soil moisture (see soil moisture maps)
Hotspot: A hotspot is declared if soils are "severely drier than normal" which occurs when Soil Moisture Deficit (SMD) is less than -110 mm AND the Soil Moisture Anomaly is less than -20 mm.
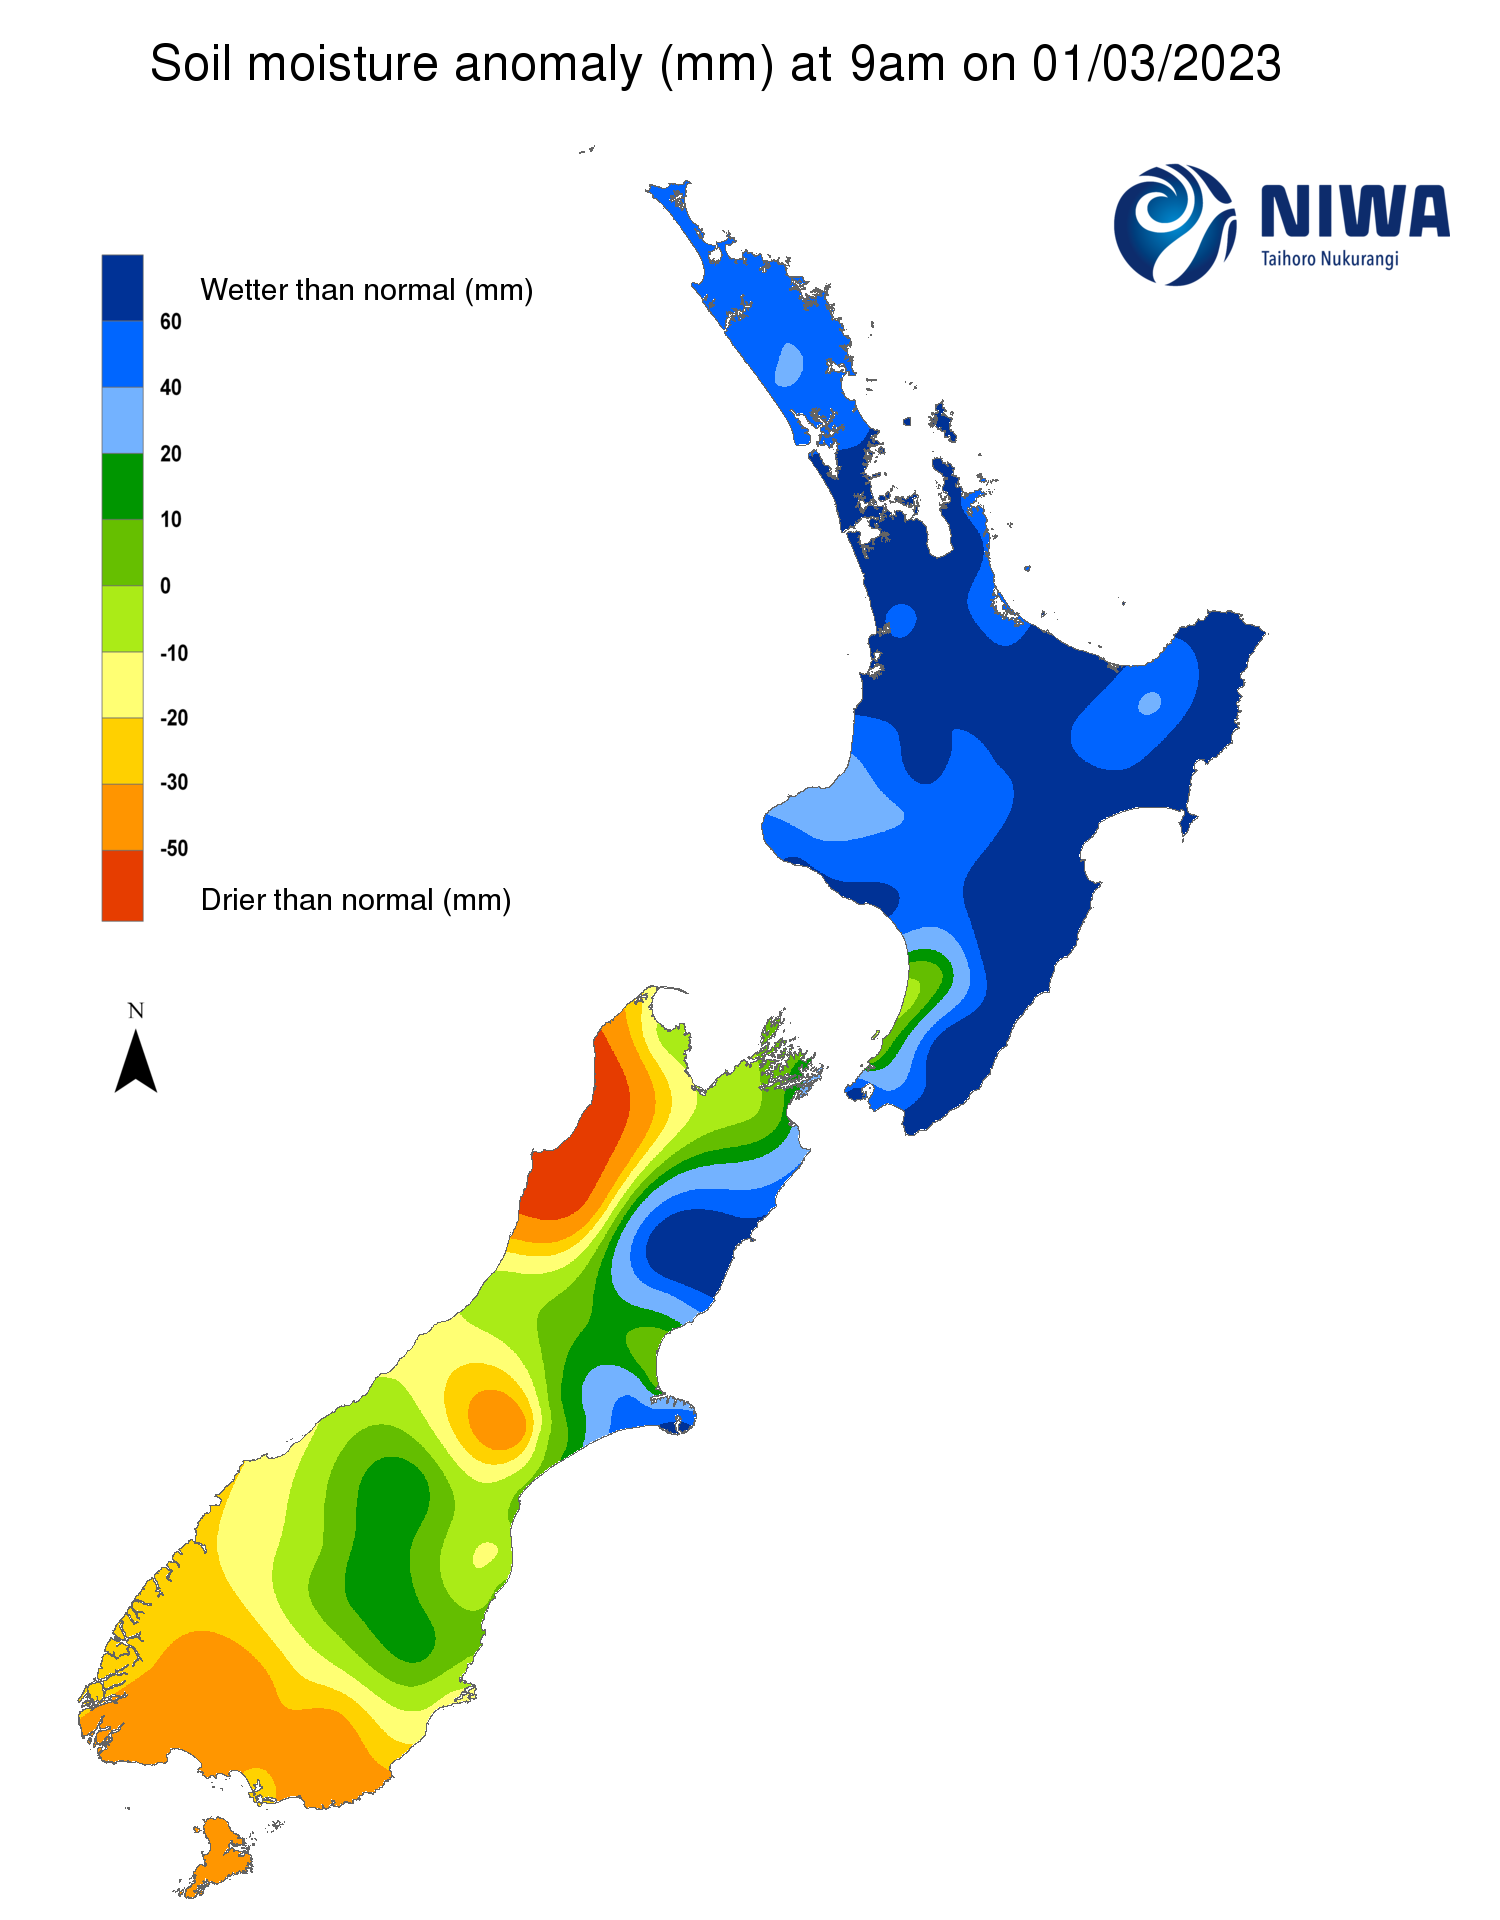
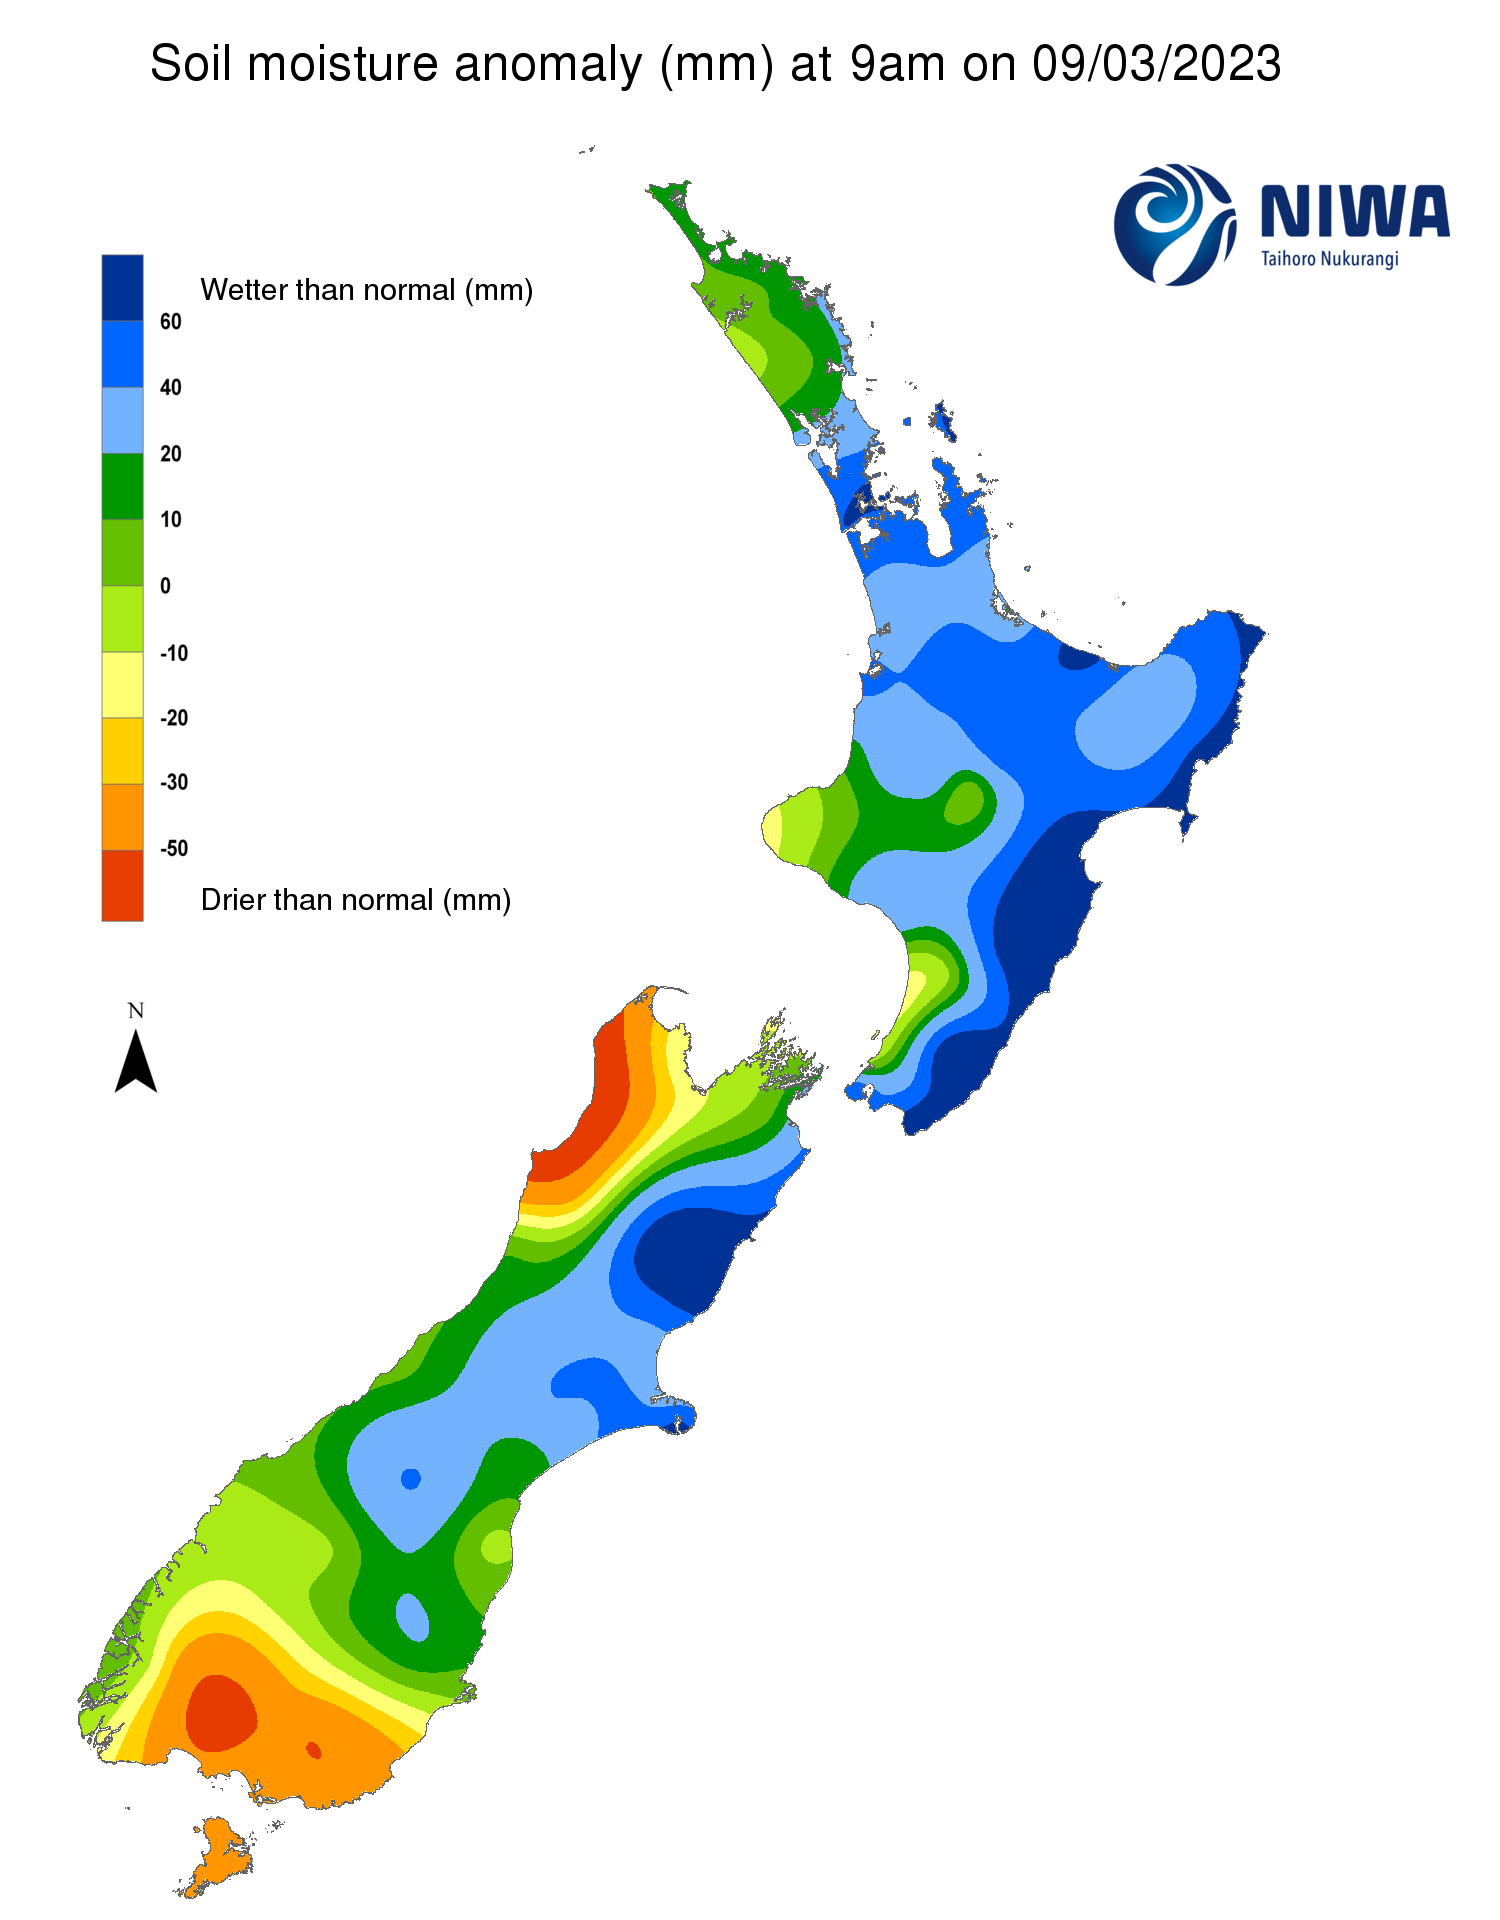
Pictured above: Soil Moisture Anomaly Maps, relative to this time of year. The maps show soil moisture anomalies over the past two weeks.
New Zealand Drought Index (NZDI)
As of 8 March, the New Zealand Drought Index (NZDI) map below shows that dry to extremely dry conditions are currently located in the upper West Coast, southern Tasman, southern Canterbury, and much of Otago and Southland. Please note: some hotspots in the text above may not correspond with the NZDI map. This difference exists because the NZDI uses additional dryness indices, including one which integrates the rainfall deficit over the past 60 days. Changes are therefore slower to appear in the NZDI compared to soil moisture anomaly maps that are instantaneously updated.