NIWA collects wave data, develops and verifies wave forecasting systems, and is developing and producing wave projections, including taking into account expected climate change. This research helps planners and local government to make informed decisions about how climate change will affect coastal regions.
Background
The waters around New Zealand have some of the highest waves in the world. We are exposed to swell coming up from the Southern Ocean, as well as storms in the Tasman Sea and Pacific Ocean.
How are waves generated?
Wind blowing over the sea surface produces short waves or ripples. The stronger the wind, and the more time and distance it has to work on the waves, and the higher and longer they get. In a storm the rough sea is a mixture of waves of different heights and lengths, travelling in different directions. Once started, waves can travel long distances (as "swell"), crossing whole oceans.
Potential consequences of wave hazards
Rough seas can create danger to boating by damaging or capsizing vessels at sea. They can also damage wharves, jetties, oil rigs and other structures, and contribute to coastal erosion. They can be particularly dangerous on exposed coastlines, making bars impassable, and creating strong rips at beaches, creating drowning risk for beachgoers.
The combination of storm surge on top of high tides can cause coastal flooding which damages property and impacts on coastal infrastructure (e.g. by blocking roads). When waves are present as well, an additional rise in sea level due to wave setup can exacerbate this inundation, while also allowing the waves to cause coastal erosion and damage to coastal infrastructure (e.g. seawalls) they normally wouldn't reach.
Wave hazard research at NIWA
NIWA researchers have developed (and are continuously improving) a multi-hazard forecasting system for all weather-related hazards. This provides accurate and location specific warnings of impending weather, river-flood, flood inundation, landslides, snow avalanche, sea-state, sea-level including storm surge, and rip current hazards up to two days in advance, and more general warnings at longer lead times.
Wave and sea-state forecasting
In the part of this programme focused on sea state forecasting, we:
- collect wave data from monitoring instruments for operational use and to validate our models
- develop and verify deterministic and probabilistic forecasting systems for waves, coupled to associated forecast systems for weather, tides and storm surge.
Operational wave forecast system
NIWA has developed an operational wave forecast system based on Wave Watch III, a spectral model developed by several collaborators around the World. The examples below use this forecasting system.
NIWA’s wave models increase in resolution towards mainland Aotearoa New Zealand. These domains (resolution) are GLOBALWAVE (17 km), NZWAVE (4 km) and NZWAVE-HR (2 km). Find out more about these forecast models here.
The wave models accommodate the processes of wind generation, white-capping and bottom friction, and include a direct estimate of non-linear energy transfer through four-wave interactions. The highest resolution model includes water level and currents from tides and storm surge. The inclusion of these processes is important because changes in water level modify the depth in which the waves will propagate. In addition, opposing currents can steepen waves.
Example: Polar blast storm of June 2021 generated the largest wave height on record
A sequence of large energetic storms swept across the ocean south of New Zealand in late-June 2021, bringing high seas to the Southeast coast of Aotearoa New Zealand. The video below shows the predicted significant wave height (representing the crest-to-trough height of a "typical" wave) for that period.
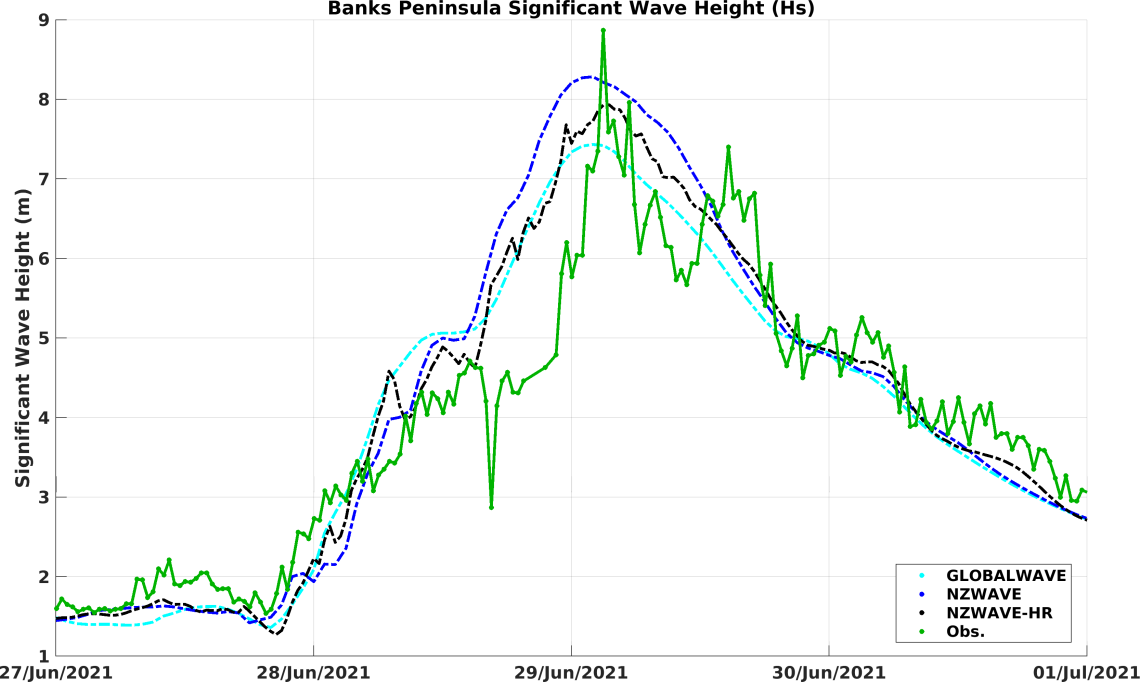
Example: Comparison between the models and observations at Banks Peninsula
During this large wave event, the forecasts show good agreement with observations at Banks Peninsula, especially NZWAVE-HR.
Wave and storm surge hindcast and climate projections: 1980s to 2100
We have produced regional hindcasts (simulations of the past) and climate projections of waves, swell and storm-surge to support local government and engineering or planning consultants in making decisions about adapting to climate change in coastal areas. The programme includes:
- Generation of 40-year wave and storm surge hindcasts at a consistent national scale and both using the same weather inputs. This simulations of the past help us estimate the return periods (1-in-100-year event) of large events (e.g. Cyclone Gabrielle in 2023).
- Production of future projections for waves/swell and storm surge around New Zealand up to 2100 based on the most recent model projections. These projections help us understand what might happen under warmer climates by 2100 compared to current conditions. These scenarios consider average increase in temperature of 1.5, 2, 2.7, 3.6, or 4+ degrees Celsius.
Wave climate and extreme value analysis
Wave climate represents the statistical description of how wave conditions vary in time and in different parts of the ocean. This is ideally found by actually measuring waves over many years, e.g. with wave buoys, but relatively few such measurements been made around Aotearoa New Zealand.
Consequently, to assess wave climate and derive probabilities of extreme wave conditions, we use hindcasts forced by past wind conditions (example: ERA5) over a sufficient period of time.
To estimate the return period of rare events (e.g. impactful tropical cyclones) we use a method called extreme value analysis (EVA). The outputs from this work can help stakeholders to protect coastal regions. Common EVA methods include the Generalised Extreme Value (GEV) fitted to annual maxima and the Generalised Pareto Distribution (GPD) fitted to Peaks over Threshold (POT).