Due to its position in the 'Roaring Forties', a belt of strong winds in the Southern Hemisphere which generally occur between the latitudes of 40 and 49 degrees, as well as its small size, New Zealand is a windy country.
Extreme winds – There is no widely accepted definition for 'extreme wind'. In New Zealand, in the context of building design, an extreme wind is a wind gust which is strong enough to be dangerous for people, or cause significant damage to buildings and property.
Winds this strong are expected to happen every 500 years or so. Wind events with return periods of more than 2 years usually cause some problems and might be regarded as extreme in contexts such as transmission line damage.
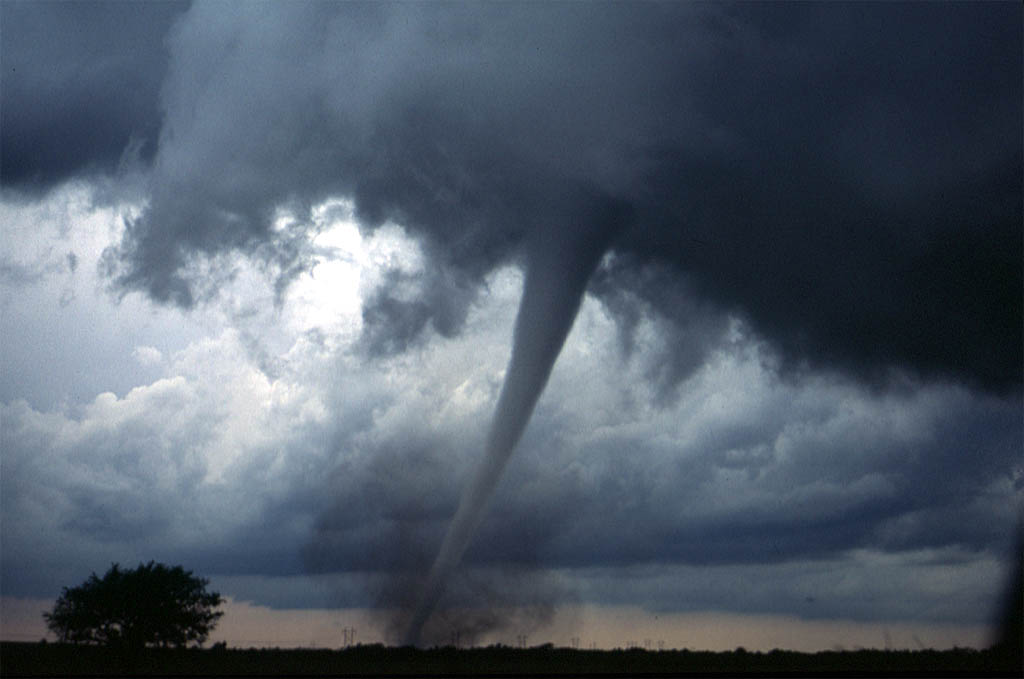
Tornadoes – A tornado is a large rotating column of air (or vortex) that occurs in association with a thunderstorm. It has winds that travel at very high speeds around a central area of very low atmospheric pressure.
The parent thunderstorms typically have very strong updrafts with speeds of 36 km/h and which are developed in a wind-shear environment which causes the updraft to rotate, in turn potentially causing a tornado.
Very strong updraft speeds of over 150km/hr or more have been reported in the United States, but not here in New Zealand.
Causes of extreme winds and tornadoes
Extreme wind gusts are the result of intense turbulence within vigorous storms systems such as ex-tropical cyclones or mid-latitude storms. These systems contain bands of generally strong winds associated with areas of large pressure gradients and these are usually near the centre of low-pressure.
Organised convection, wind-shear, and steep terrain within these bands can all generate the turbulence that gives rise to the extreme wind gusts. Extreme winds can on occasion also be caused by tornadoes and convective downbursts from isolated thunderstorms not associated with a large storm systems.
Potential consequences of extreme winds and tornadoes
Extreme winds and tornadoes can cause deaths and property damage, with the damage being highly unpredictable.
Typical damage experienced in New Zealand includes:
- destruction of buildings, including roofing being blown off, broken windows, and other flying debris
- large scale forest damage and fallen trees or branches falling onto power-lines
- high-sided vehicles and outdoor equipment such as centre-pivot irrigators being blown over
- very tall buildings, suspension bridges and transmission lines can suffer structural failures.
Worst case examples of extreme winds and tornadoes around New Zealand
Some of the worst storms in living memory are:
- Ex-tropical cyclone Bola, in March 1988, when very heavy rains and hurricane-force winds struck the east coast of the North Island causing extensive severe damage and flooding
- The Wahine storm (ex-cyclone Gisele), in April 1968, when an ex-tropical cyclone hit the Wellington region. Fifty three people lost their lives when the Wahine ferry sank in Wellington Harbour.
Some of the worst recent tornadoes have been:
- Dec 2012, a tornado in Auckland killed three people, injured seven others and was responsible for an estimated $13 million in cleanup costs, and $6.5 million in insurance claims
- May 2011, a tornado in Auckland, killed one person, injured several others, as well as causing several million dollars' worth of damage
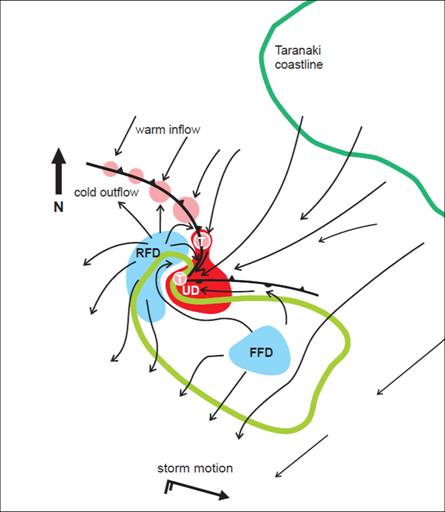
- August 2004, a tornado near Waitara, Taranaki destroyed a farmhouse and killed two people: in July 2007, several tornadoes on the same evening caused damage to homes and other property worth seven million dollars in Oakura and New Plymouth.
Extreme winds and tornado research at NIWA
NIWA carries out a variety of research projects measuring and computer modelling of winds in co-operation with GNS, BRANZ, OPUS and the University of Auckland. In addition, NIWA is building a searchable database of storms and hazards, including tornadoes and strong winds, in New Zealand.