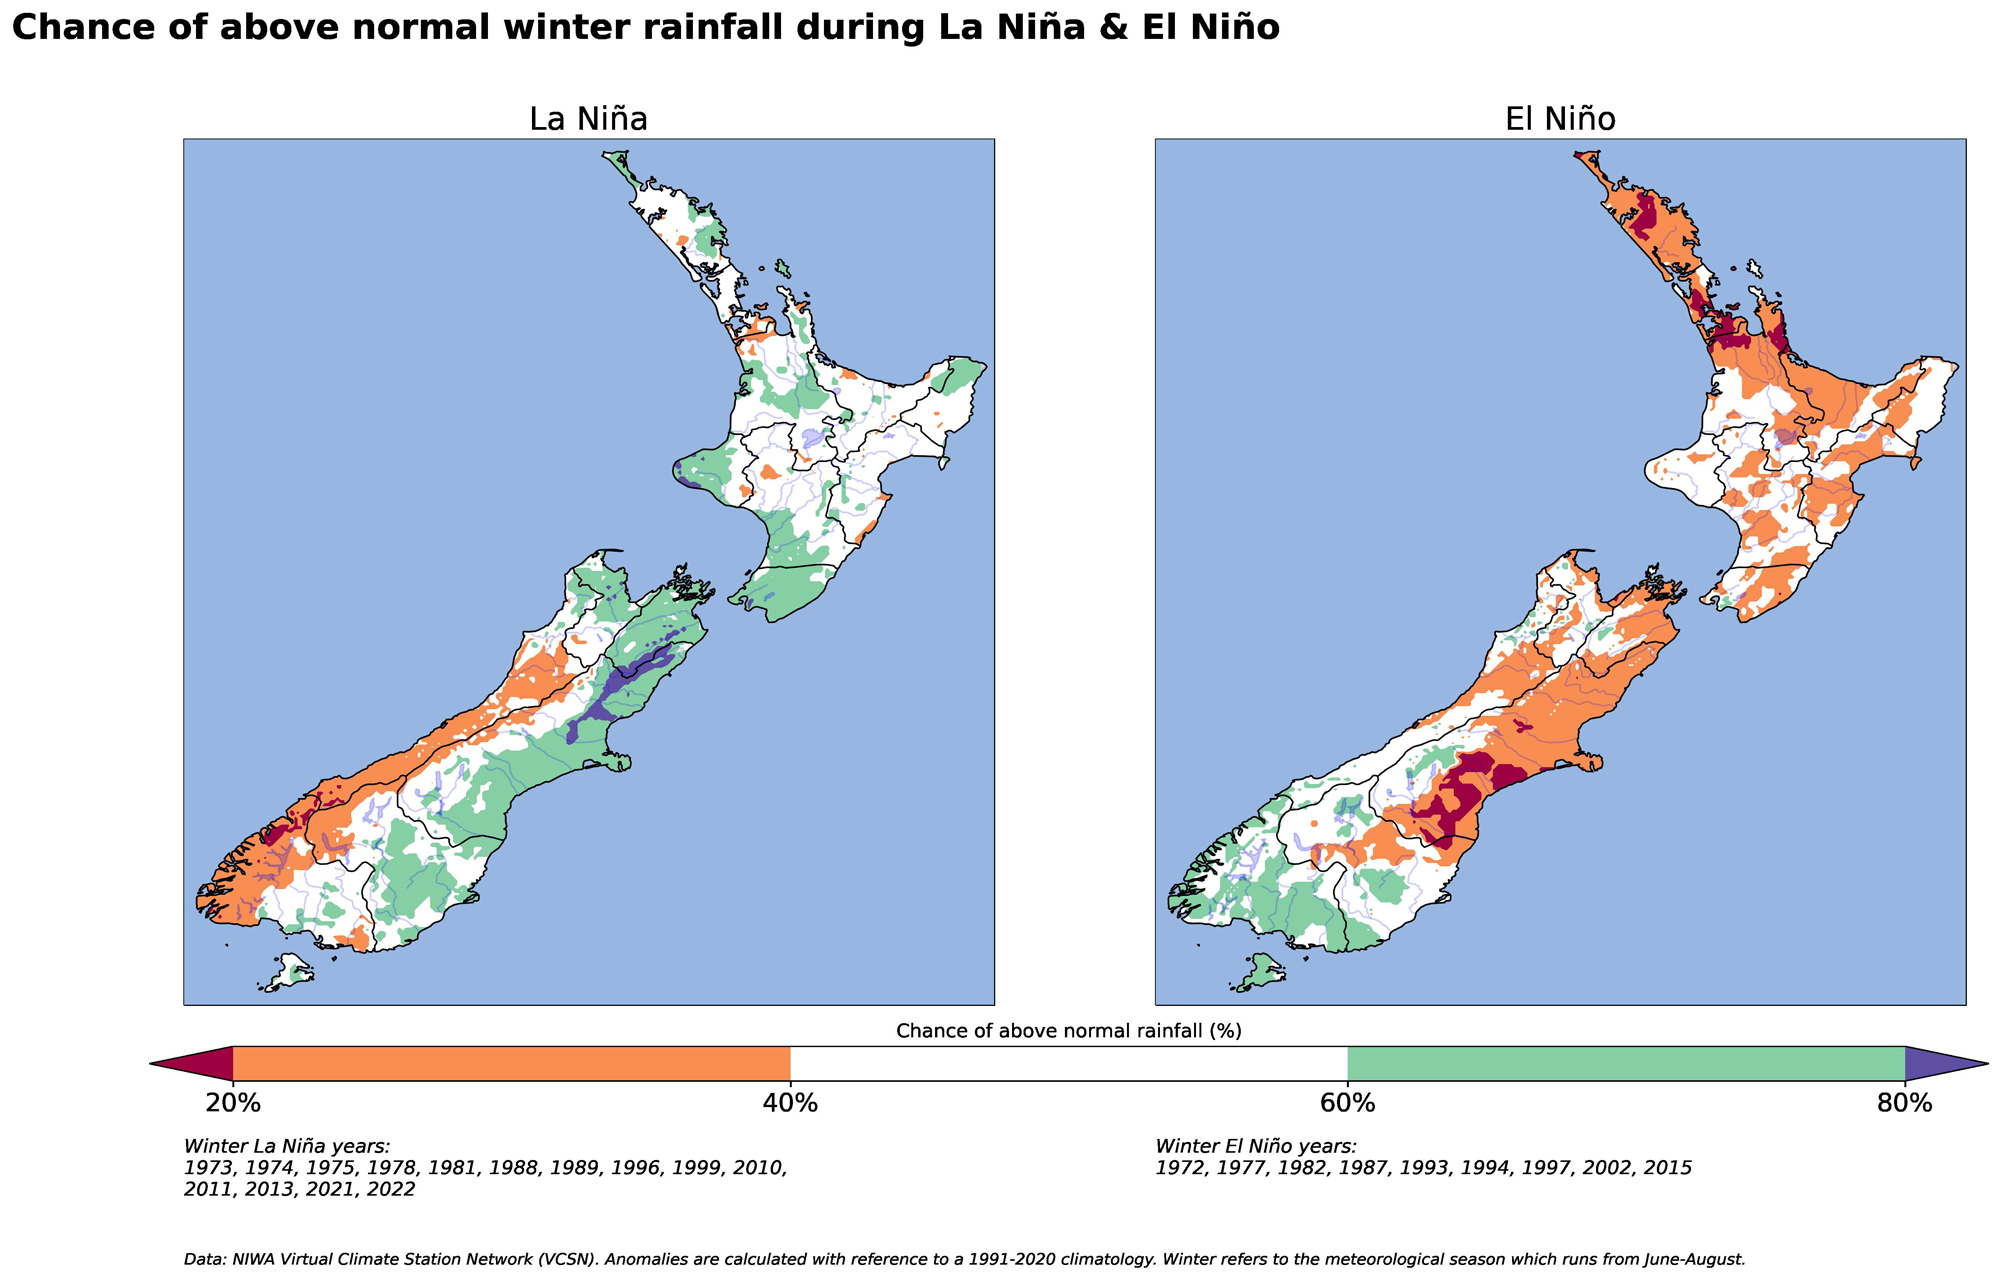
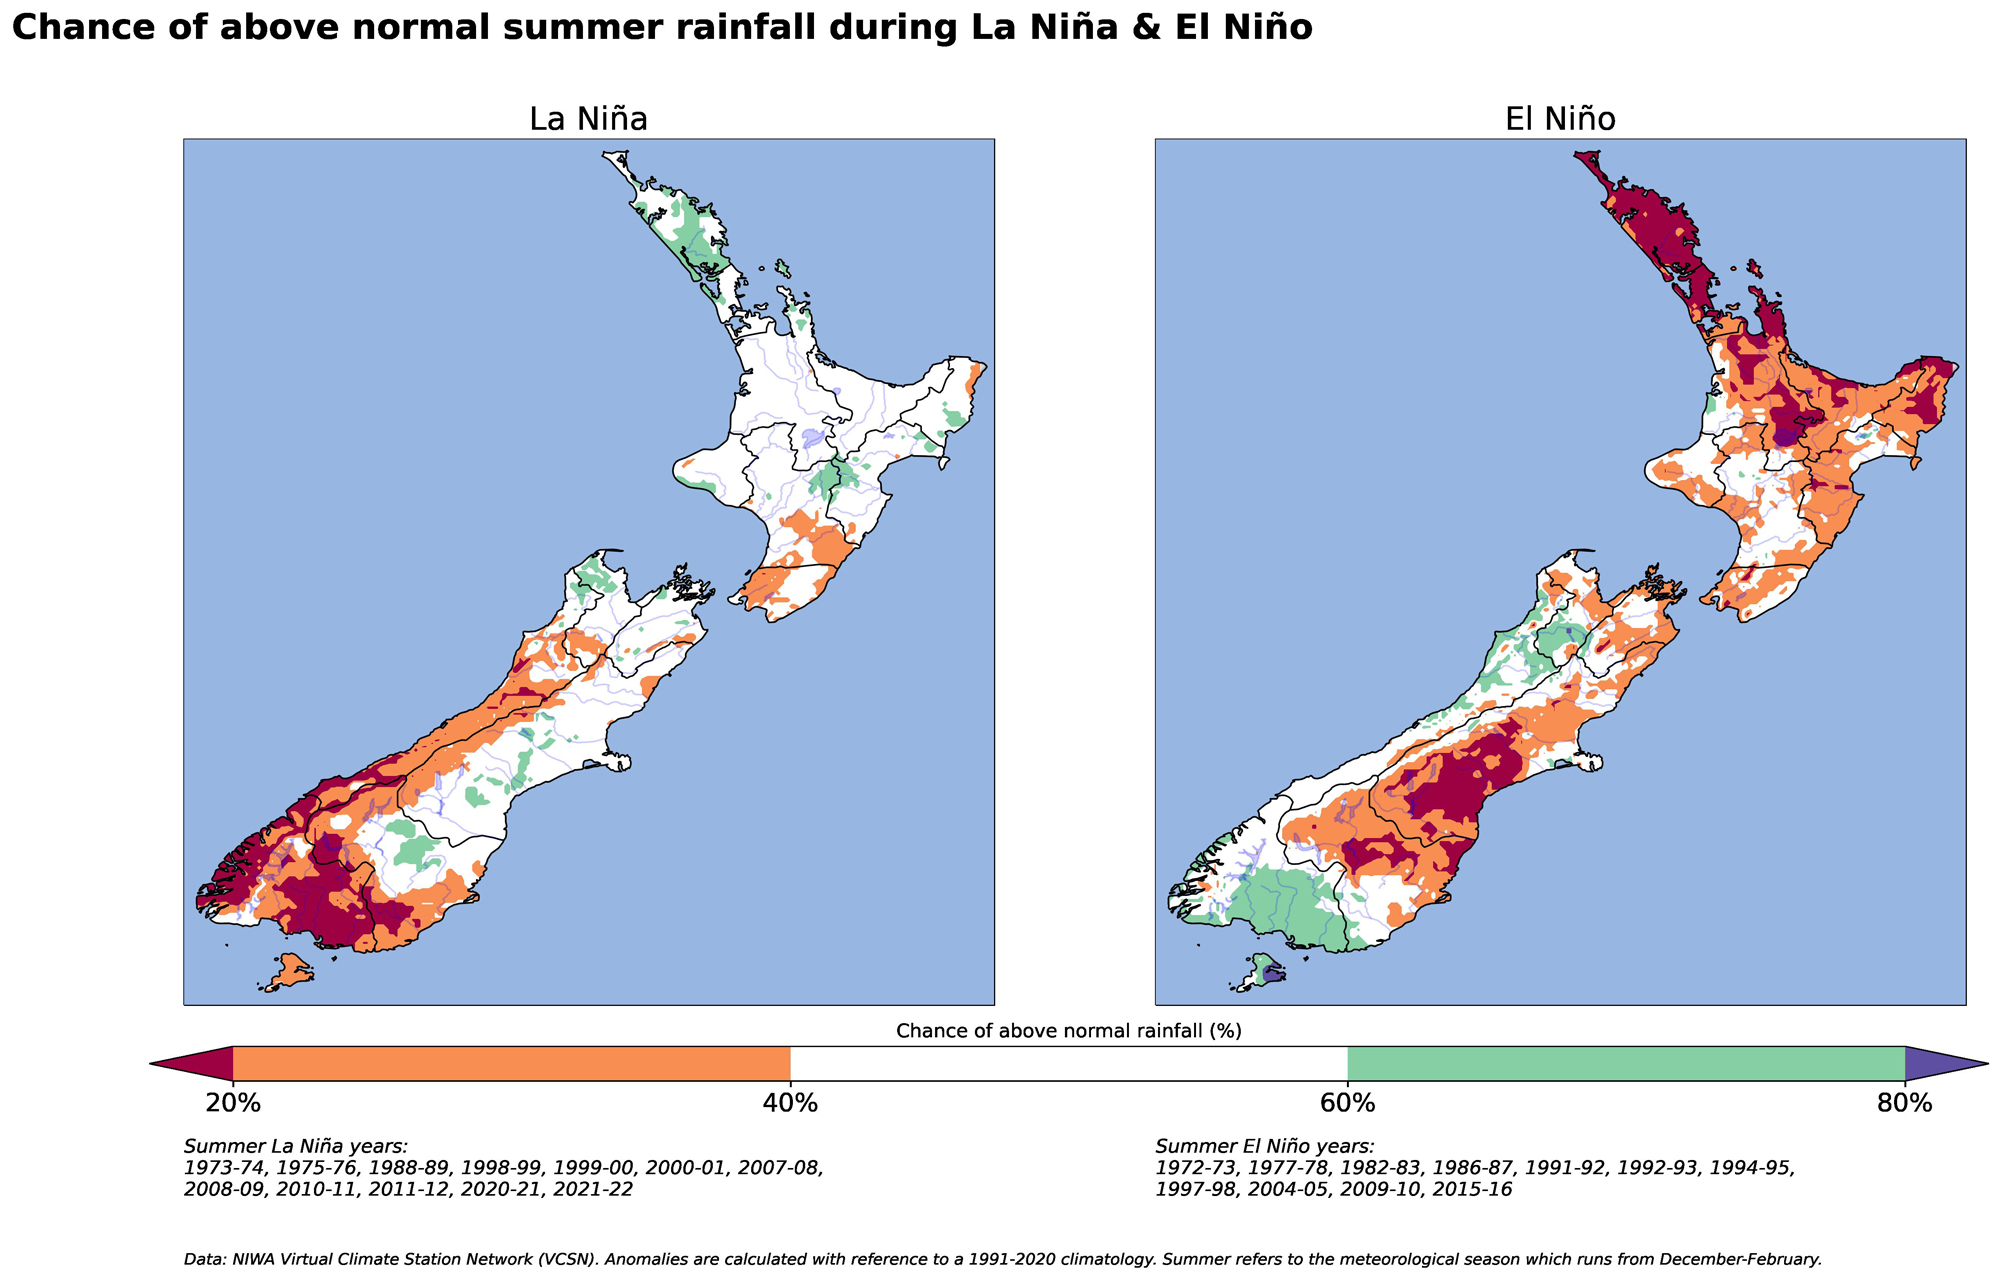
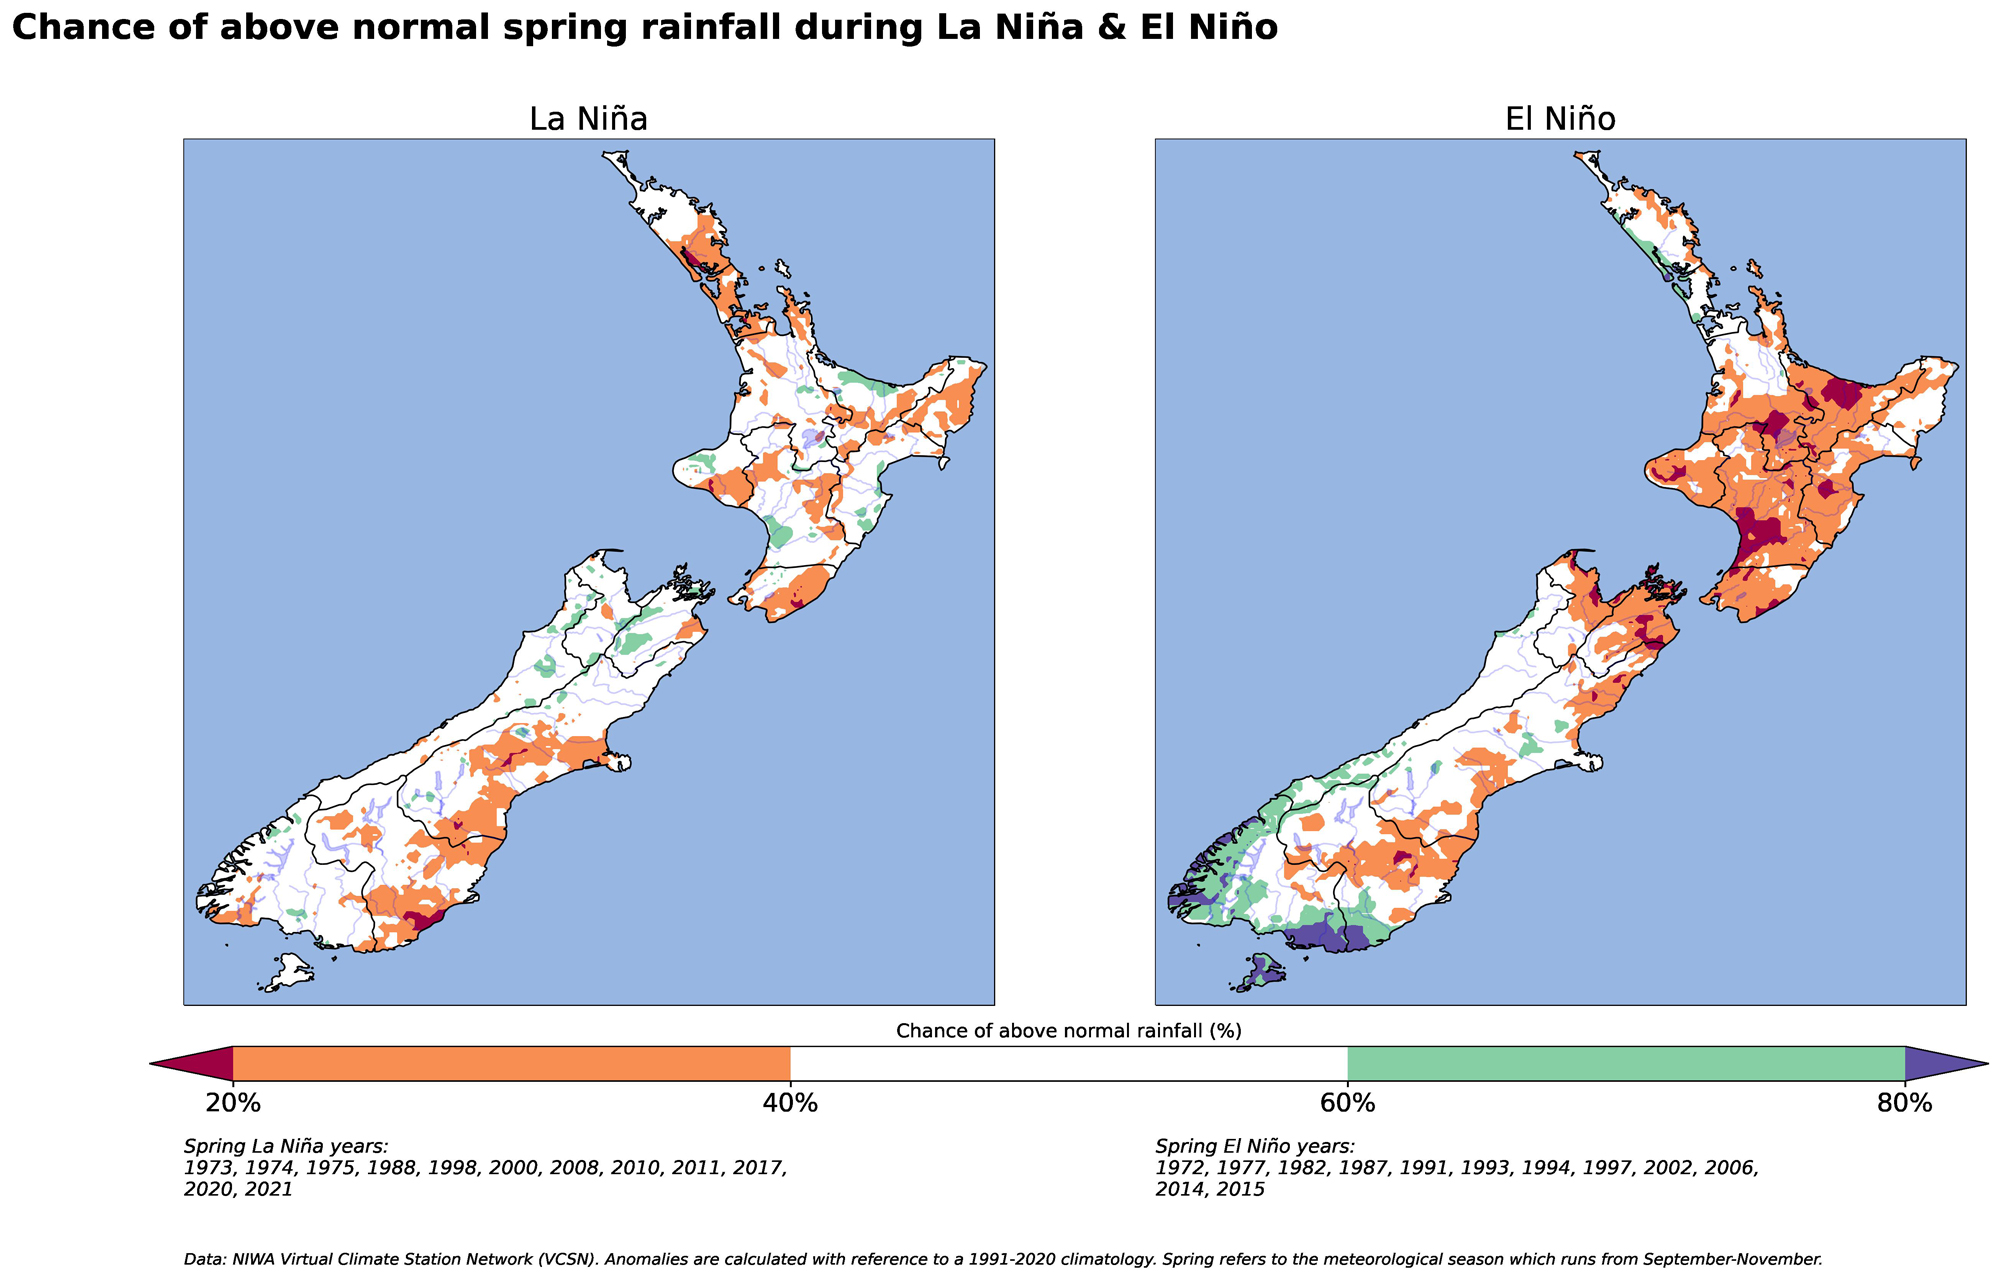
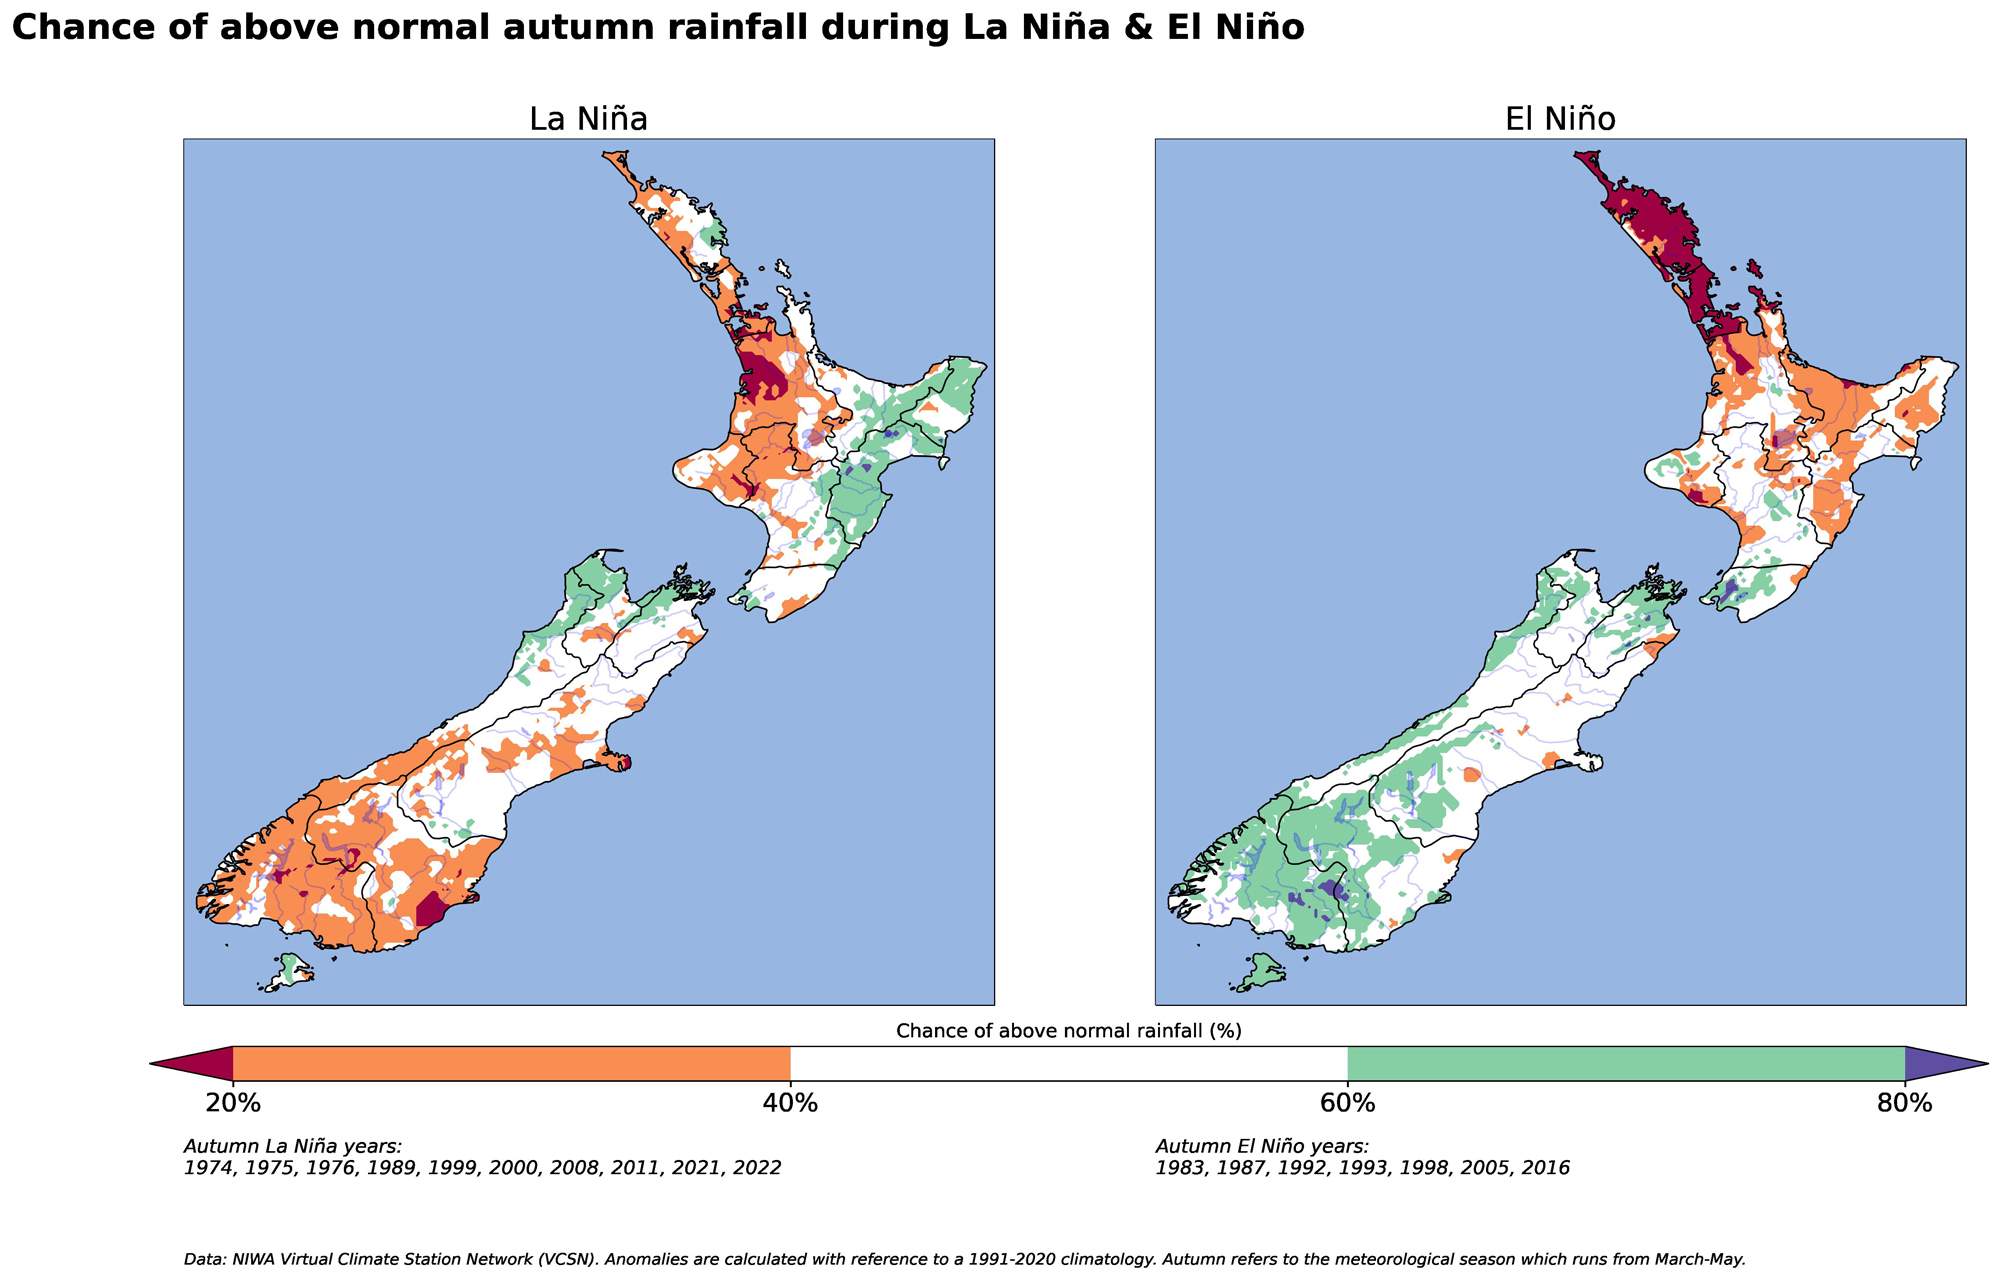
El Niño and La Niña impact seasonal rainfall patterns across Aotearoa/New Zealand. These maps show the probabilities of above normal rainfall (>100% of normal) during historical El Niño and La Niña events. Here’s an example on how to interpret the maps: during El Niño summers, Northland and Auckland have a low chance (<20%, coloured red), of experiencing above normal rainfall.