Unit objective
To observe the relationship between temperature and relative humidity.
Background
Relative humidity is a measure of the water vapour content of the air at a given temperature. The amount of moisture in the air is compared with the maximum amount that the air could contain at the same temperature and expressed as a percentage.
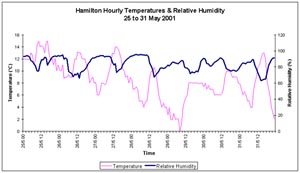
The graph to the right shows the hourly temperature (°C) and relative humidity (%) readings for Hamilton for the last week of May.
Use your answers to the following questions, to explore the relationship between temperature and relative humidity and describe your conclusion clearly and concisely.
Interpreting graphs:
- What normally happens to the temperature at night?
- Was the relative humidity higher at night or during the day?
- When is it usually the warmest time of the day?
- Is the relative humidity usually higher or lower at this time, compared to the rest of the day? Use the definition of relative humidity given above to explain your answer.
Understanding time-related variation:
- Describe how the relative humidity usually changed throughout a day, from midnight to midnight.
- Explain how the temperature varied throughout a day from midnight to midnight.
- Were there any dramatic changes of temperature during the week?
- Describe the relative humidity for the week and how it varied from day to day.
Communicating findings:
- Describe in words the relationship between the two variables during this week?
Weather plots: teacher background
Objectives:
Within a meaningful context, students will be able to: Interpret graphs which represent everyday situations. [A5.3] Make statements about time-related variation. [S5.7] Identify long-term and short-term features in time-series data. [S6.6] Mathematics in the New Zealand Curriculum
Local hourly relative humidity and temperature data could be provided for this activity and the graphs plotted by the students before investigating the relationship between the two variables.
Answers to questions:
- The temperature usually drops during the night.
- The relative humidity is usually higher at night.
- Early afternoon. About 2 o'clock.
- Lower when the temperature is high. Warm air has the potential to hold more water vapour than cool air. R.H. = (amount of moisture)/(maximum amount that could be contained) x 100% If the moisture in the air remains unchanged and the temperature rises, the maximum amount of moisture that the air could hold increases. The numerator is the same and the denominator is increased, so the resulting percentage will be lower.
- Relative humidity is usually high at midnight and in the early morning, drops rapidly, after the sun rises, until it is lowest just after midday. It then increases again to midnight, rapidly in the late afternoon and early evening and levels off around midnight.
- Temperature is usually low at midnight, decreasing in the early hours of the morning, and then increasing rapidly until just after midday. It then decreases during the night.
- No. Night temperatures fell slightly as the week progressed. The temperature was lower than usual on the night and early morning of the 29th.
- Relative humidity decreased slightly as the week progressed. There is a daily cycle. The relative humidity ranges from 63 to 95% during this week.
- As the temperature increases the relative humidity usually decreases or vice versa.
Resource prepared by Lesley Mackintosh RSNZ Teacher Fellow 2001, NIWA
Related links