Outlook Summary
- El Niño has officially arrived. A majority of NIWA’s criteria for classifying an El Niño event were satisfied during September. In particular, the Southern Oscillation Index was firmly in El Niño territory, suggesting the atmosphere has become coupled to the ocean.
- There’s around a 100% chance of El Niño continuing during October-December and over a 95% chance that it will persist through summer. See the background for more info.
- Air pressure is forecast to be above normal to the north of Aotearoa/New Zealand and below normal to the south of the country, leading to more westerly quarter winds than normal.
- Seasonal wind strength is forecast to be above normal across most of the country because of a stronger than normal pressure gradient (difference in pressure over distance) near New Zealand. This will come with periods of potentially damaging winds.
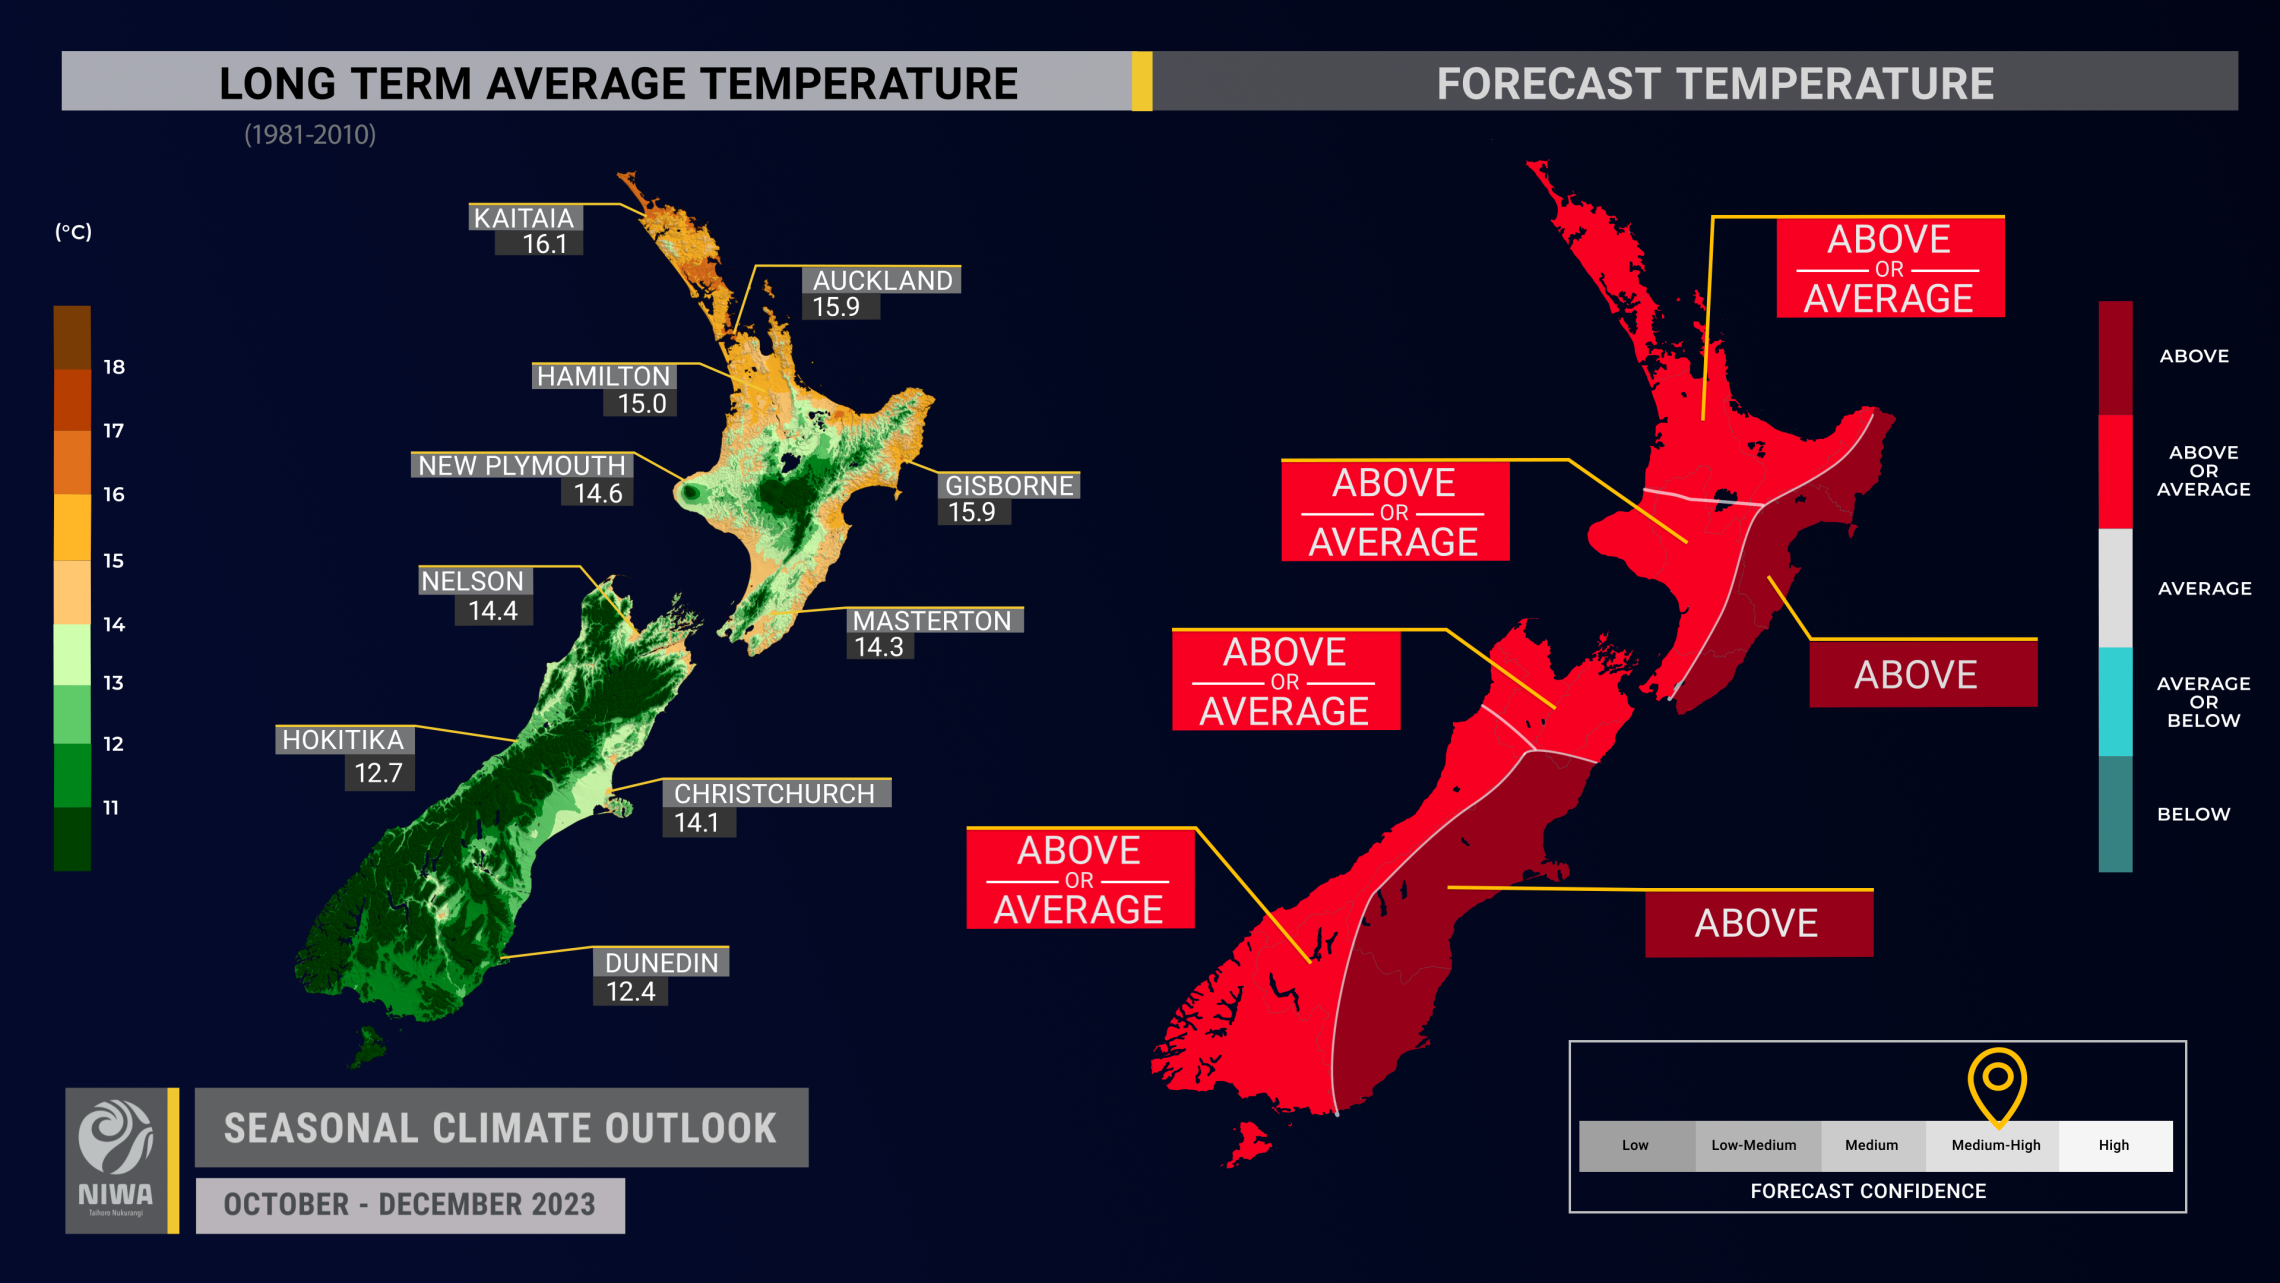
- Temperatures are most likely to be above average in the east of both islands and about equally likely to be near average or above average in all other regions.
- The country will likely be exposed to dramatic temperature swings. Spells of unseasonable warmth from Australian air masses will likely be followed up by sharply colder southerlies, with little middle ground.
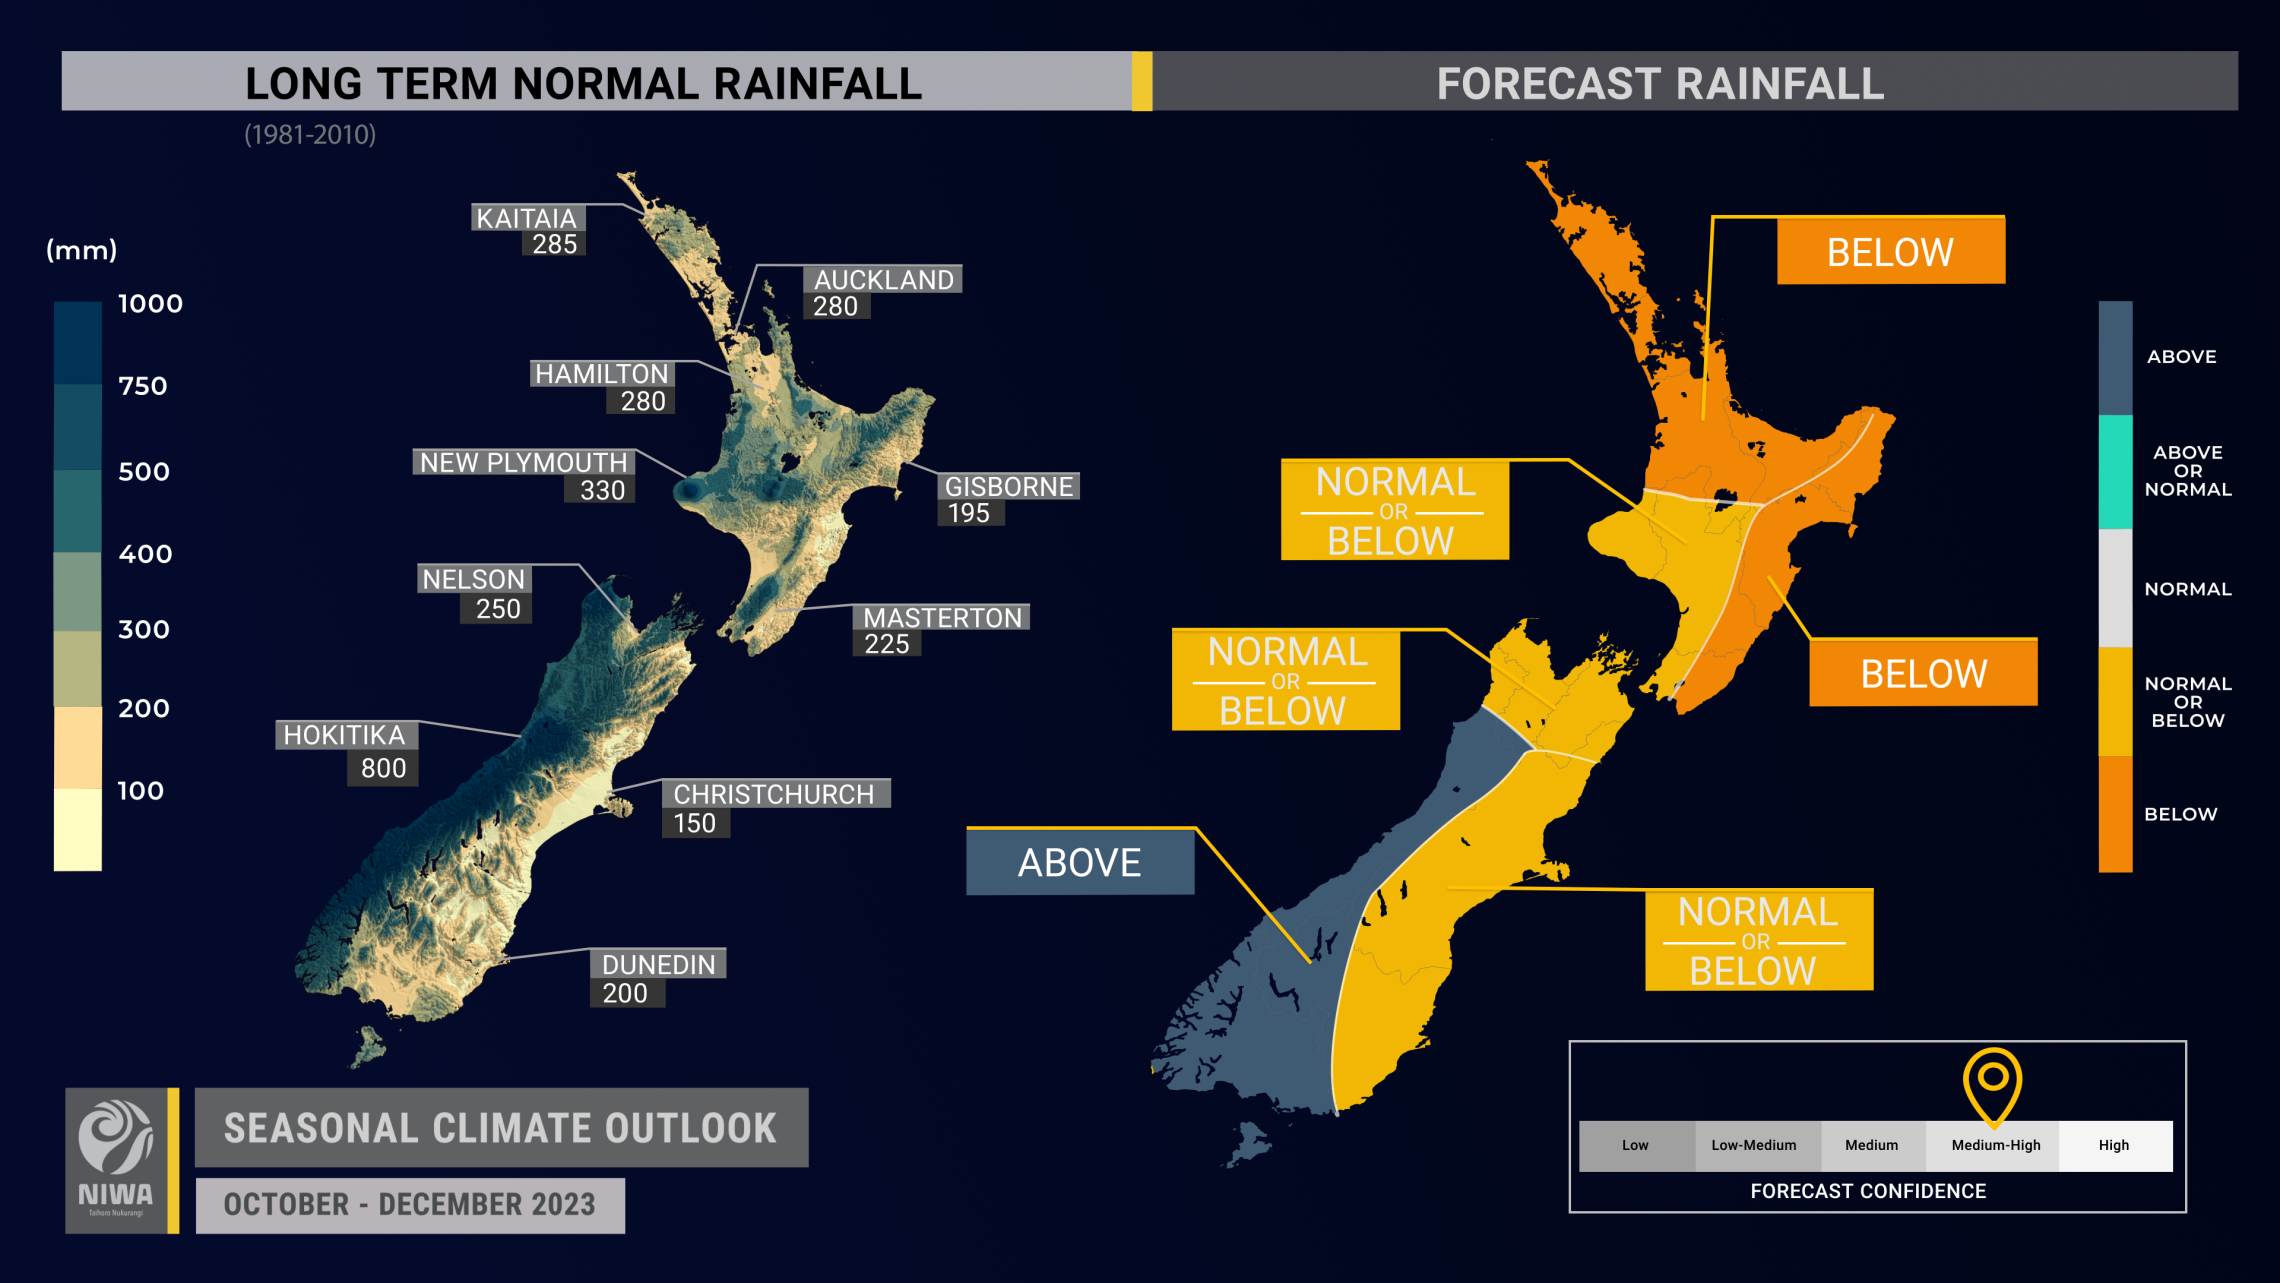
- Rainfall is most likely to be below normal in the north and east of the North Island and above normal in the west of the South Island. Rainfall is about equally likely to be near normal or below normal in all other regions.
- The pressure pattern, delivering more westerly winds, will likely lead to some prolonged dry spells to the north and east of both islands.
- Strong fronts will occasionally impact the western and lower South Island, delivering heavy rainfall and a risk for flooding.
- Coastal sea surface temperatures (SSTs) ranged from 0.41˚C to 1.11˚C above average during September. The risk for widespread and persistent marine heatwaves like those that have occurred in recent years is low.
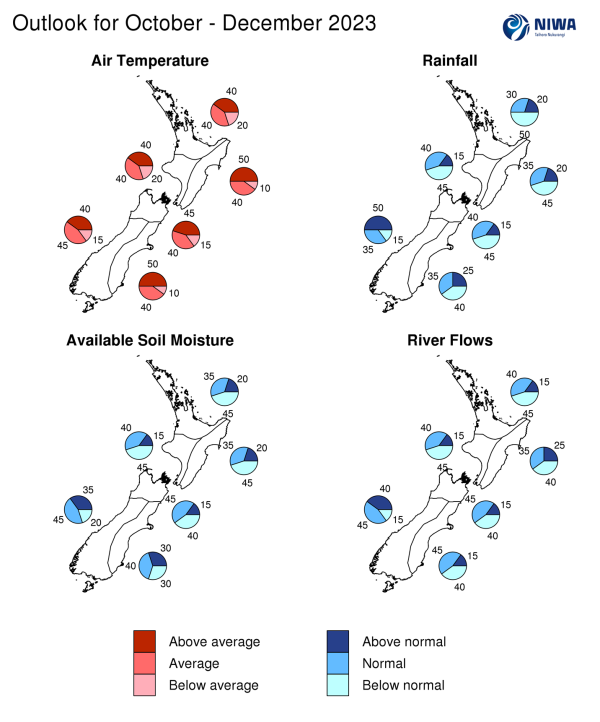
- Soil moisture is most likely to be below normal in the north and east of the North Island, near normal in the west and east of the South Island, and near normal or below normal in the west of the North Island and north of the South Island. River flows are about equally likely to be near normal or above normal in the west of the South Island and near normal or below normal for all remaining regions of the country.
- As of late September, fire danger was low across the country. The arrival of El Niño is expected to result in normal or above normal fire danger. Even a normal fire season will have much greater fire potential than last year for many areas. For more info: www.checkitsalright.nz.
Regional predictions for October– December 2023
Northland, Auckland, Waikato, Bay of Plenty
The table below shows the probabilities (or percent chances) for each of three categories: above average, near average, and below average. In the absence of any forecast guidance there would be an equal likelihood (33% chance) of the outcome for any of the three categories. Forecast information from local and global guidance models is used to indicate the deviation from equal chance that is expected for the coming three-month period. All outlooks are for the three months as a whole. There will inevitably be relatively wet and dry days, and hot and cold days, within a season. The exact range in temperature and rainfall within each of the three categories varies with location and season. However, as a guide, the “near average” or middle category for the temperature predictions includes deviations up to ±0.5°C for the long-term mean, whereas for rainfall the “near normal” category lies between 80 per cent and 120 per cent of the long-term mean. The following outcomes are the most likely for this region:
- Temperatures are equally likely to be near average or above average (40% chance each). Dramatic temperature swings from well above average to well below average are likely, particularly in October.
- Rainfall totals are most likely to be below normal (50% chance). An increased frequency of high pressure systems near the region will likely lead to longer dry spells.
- Seasonal wind speeds are expected to be stronger than normal.
- Soil moisture levels are most likely to be below normal (45% chance) while river flows are about equally likely to be below normal (45% chance) or near normal (40% chance).
|
Temperature |
Rainfall |
Soil moisture |
River flows |
|
|
Above average |
40 |
20 |
20 |
15 |
|
Near average |
40 |
30 |
35 |
40 |
|
Below average |
20 |
50 |
45 |
45 |
Central North Island, Taranaki, Whanganui, Manawatu, Wellington
Probabilities are assigned in three categories: above average, near average, and below average.
- Temperatures are equally likely to be near average or above average (40% chance each). Dramatic temperature swings from well above average to well below average are likely, particularly in October.
- Rainfall totals are about equally likely to be below normal (45% chance) or near normal (40% chance).
- Seasonal wind speeds are expected to be much stronger than normal.
- Soil moisture levels and river flows are about equally likely to be below normal (45% chance) or near normal (40% chance).
|
Temperature |
Rainfall |
Soil moisture |
River flows |
|
|
Above average |
40 |
15 |
15 |
15 |
|
Near average |
40 |
40 |
40 |
40 |
|
Below average |
20 |
45 |
45 |
45 |
Gisborne, Hawke’s Bay, Wairarapa
Probabilities are assigned in three categories: above average, near average, and below average.
- Temperatures are most likely to be above average (50% chance). Frequent westerly winds will likely lead to a higher frequency of hot days (>25˚C). October will have dramatic temperature swings.
- Rainfall totals are most likely to be below normal (45% chance). An increased frequency of westerly winds will likely lead to longer dry spells.
- Seasonal wind speeds are expected to be stronger than normal.
- Soil moisture levels are most likely to be below normal (45% chance) while river flows are about equally likely to be below normal (40% chance) or near normal (35% chance).
|
Temperature |
Rainfall |
Soil moisture |
River flows |
|
|
Above average |
50 |
20 |
20 |
25 |
|
Near average |
40 |
35 |
35 |
35 |
|
Below average |
10 |
45 |
45 |
40 |
Tasman, Nelson, Marlborough, Buller
Probabilities are assigned in three categories: above average, near average, and below average.
- Temperatures are about equally likely to be above average (45% chance) or near average (40% chance). Dramatic temperature swings from well above average to well below average are likely, particularly in October.
- Rainfall totals are about equally likely to be below normal (45% chance) or near normal (40% chance). An increased frequency of westerly winds will likely lead to longer dry spells about Nelson and Marlborough.
- Seasonal wind speeds are expected to be much stronger than normal.
- Soil moisture levels and river flows are about equally likely to be near normal (45% chance) or below normal (40% chance).
|
Temperature |
Rainfall |
Soil moisture |
River flows |
|
|
Above average |
45 |
15 |
15 |
15 |
|
Near average |
40 |
40 |
45 |
45 |
|
Below average |
15 |
45 |
40 |
40 |
West Coast, Southern Alps and foothills, inland Otago, Southland
Probabilities are assigned in three categories: above average, near average, and below average.
- Temperatures are about equally likely to be near average (45% chance) or above average (40% chance). Dramatic temperature swings from well above average to well below average are likely, particularly in October.
- Rainfall totals are most likely to be above normal (50% chance). Strong westerly fronts will occasionally impact the region, delivering heavy rainfall and a risk for flooding.
- Seasonal wind speeds are expected to be much stronger than normal.
- Soil moisture levels are most likely to be near normal (45% chance) while river flows are about equally likely to be near normal (45% chance) or above normal (40% chance).
|
Temperature |
Rainfall |
Soil moisture |
River flows |
|
|
Above average |
40 |
50 |
35 |
40 |
|
Near average |
45 |
35 |
45 |
45 |
|
Below average |
15 |
15 |
20 |
15 |
Coastal Canterbury and the nearby plains, east Otago
Probabilities are assigned in three categories: above average, near average, and below average.
- Temperatures are most likely to be above average (50% chance). Frequent westerly winds will likely lead to a higher frequency of hot days (>25˚C). October will have dramatic temperature swings.
- Rainfall totals are about equally likely to be below normal (40% chance) or near normal (35% chance). An increased frequency of westerly winds will likely lead to longer dry spells, particularly in middle and northern Canterbury.
- For inland and southern Canterbury and east Otago, periodic wetter than normal conditions may occur when rain bands may “spill over” the main divide.
- Seasonal wind speeds are expected to be much stronger than normal.
- Soil moisture levels are most likely to be near normal (40% chance), while river flows are about equally likely to be near normal (45% chance) or below normal (40% chance).
|
Temperature |
Rainfall |
Soil moisture |
River flows |
|
|
Above average |
50 |
25 |
30 |
15 |
|
Near average |
40 |
35 |
40 |
45 |
|
Below average |
10 |
40 |
30 |
40 |
Graphical representation of the regional probabilities
Background
The NINO3.4 Index (which covers the west-central equatorial Pacific) over the last month (through 27 September) was +1.58˚C (climatology: 1991-2020), within the range of a strong El Niño (classified when the NINO3.4 Index is greater than 1.5˚C). The September 2023 NINO3.4 Index is exceeded only by 2015 and 1997, with data back to 1981. The September NINO1.2 Index (eastern equatorial Pacific) of +2.86˚C is exceeded only by 1997. From an oceanic perspective, this strengthening El Niño ranks close to the most significant events in recent decades.
The Southern Oscillation Index (SOI) was well within the El Niño range during September (-1.5) (climatology: 1991 – 2020). The three-month SOI value was -1.0.
El Niño conditions are now occurring, as a majority of NIWA’s criteria for classifying an El Niño event have been satisfied. In particular, the Southern Oscillation Index was firmly in El Niño territory over the last three months, suggesting that the atmosphere is now coupled with the ocean.
Of the models monitored by NIWA, there’s around a 100% chance of El Niño continuing through December and over a 95% chance that the event persists through summer. There’s a 75% chance for the continuation of El Niño conditions through autumn 2024.
In the subsurface equatorial Pacific, anomalies of +3˚C to +6˚C were occurring in the upper 100 metres in the east as of late September. The distribution of the anomalously warm water remained consistent with the development of an east-based canonical El Niño event. The abnormally warm waters are predicted to continue to surface and expand westward over the course of the next three to four months, with the event peaking as a very strong El Niño (classified when the NINO3.4 Index is greater than 2.0˚C) in December 2023-January 2024.
Trade wind strength was below normal in the west-central Pacific just east of the International Date Line and near normal or above normal farther east during September, similar to August. This general theme is expected to continue into October, although there is a stronger indication for a reduction in trades in the east-central Pacific. This may see conditions in the Niño 3 and 3.4 region warm more substantially.
In the Indian Ocean, a positive Indian Ocean Dipole (IOD) event has developed. In its positive phase, the IOD corresponds to cooler (warmer) than average seas in the eastern (western) tropical Indian Ocean. Its development is forecast to be associated with a strong cell of suppressed convection over the wider Australasia region during October-December, which will see high pressure systems commonly migrate from Australia toward northern New Zealand. This pattern is expected to have a strong influence on regional moisture availability and suppress the chance for tropical rainmakers.
This burgeoning positive IOD event has strong similarities with the 2019 event and the indices that monitor the IOD are of nearly identical strength at the end of September 2023 as they were at the end of September 2019.
During the first half of October, the Madden-Julian Oscillation (MJO) is forecast to propagate eastward into the central and eastern Pacific, reaching the Americas around the middle part of the month. This is likely to see a resumption in strong, robust westerly wind flows for New Zealand, some of which could prove damaging, providing changeable temperatures and rain for western areas, and dryness in the north and east.
In the second half of the month, the MJO could briefly pass from the Maritime Continent into the western Pacific (phases 4-6). During October-December, these phases tend to favour more easterly winds for New Zealand with wetter conditions in the east of both islands.
This type of convective forcing has happened periodically in recent months and appears linked to a remnant area of warmer than average ocean water near the International Date Line along the equator – atypical for a classical, east-based El Niño event.
This remnant warmth in the western Pacific will likely continue to influence some level of variability in New Zealand’s air pressure and wind flow patterns in the months to come, with brief windows of weather that are not traditionally associated with the typical circulation patterns of El Niño.
Overall, the combined effects of the El Niño and IOD will favour high pressure near and north of the North Island and low pressure near and south of the South Island over the October-December period. The associated pressure gradient (difference in air pressure) is expected to drive stronger than normal and frequent westerly quarter winds and occasionally intense lows and fronts into the western and lower South Island. More frequent high pressure to the north of the country will also reduce, but not eliminate, the chance for atmospheric rivers.
Seasonal wind strength is predicted to be above normal across the country. The winds will be strong-to-damaging at times, bring warm, dry air from Australia, and culminate in spells of well above average temperatures in eastern areas of both islands. Warm periods will likely be followed up by sharply colder southerlies, contributing to a season that will have even more variability than a typical October-December.
The Southern Annular Mode (SAM) briefly became positive in early September before displaying strongly negative values in the second week of the month, in association with a powerful Southern Ocean low pressure system. During October, a variable SAM is forecast, with incoming high pressure favouring the development of a positive SAM in the first week before low pressure returns in the mid-month, likely seeing the SAM become negative once again.
New Zealand’s coastal water temperatures became more unusually warm in all regions except the east of the South Island during September. At the end of the month, localised marine heatwaves were affecting coastal waters around the North Island and northern South Island. The expectation for stronger winds, in association with El Niño, means that the risk for the development of widespread marine heatwave conditions in New Zealand’s coastal waters is low; however, during periods of unusually warm conditions, localised-to-regional marine heatwaves may develop, particularly near the north and east of both islands. For more information, see the NIWA Sea Surface Temperature Update
Figure 1: 30-day SST anomalies and marine heatwave conditions (stippled), calculated with respect to the 1991-2020 climatological period.
NZ 30-day coastal SST anomalies (to 27 September)
|
North NI |
+0.41˚C |
|
West NI |
+0.66˚C |
|
East NI |
+0.70˚C |
|
North SI |
+0.74˚C |
|
West SI |
+0.57˚C |
|
East SI |
+1.11˚C |
Forecast Confidence
Temperature
Forecast confidence for temperatures is medium-high. An increased frequency of westerly winds, which warm upon descending the Southern Alps and Central Plateau, favours above average seasonal temperatures in the east of both islands. There is strong climate model agreement on the wind flow pattern, which leads to moderate-to-high confidence in predicted temperature regimes.
Rainfall
Forecast confidence for rainfall is medium-high. A combination of strong climate drivers, El Niño and the Indian Ocean Dipole, during the period which their influence is near-peak, lends itself to above average confidence in rainfall patterns. However, a remnant patch of warmer than average ocean water near the International Date Line could produce some variability that goes against the grain of El Niño.