Outlook Summary
- October – December 2020 air pressure is forecast to be higher than normal to the southeast and lower than normal to the north of New Zealand. This is expected to be associated with developing La Niña-like northeasterly air flow anomalies, although a westerly flow anomaly, which may be strong at times, is favoured to continue for much of October.
- NIWA continues in “La Niña Alert”, but based on expected trends in the climate system and the likelihood for New Zealand’s weather patterns to become more aligned with La Niña during October, it is likely that NIWA will confirm La Niña conditions during the next month. According to international guidance, the probability for oceanic La Niña conditions is 77%.
- New Zealand’s coastal water temperatures cooled moderately during September, which was driven by a more active weather pattern producing mixing in the waters surrounding New Zealand. However, with high pressure located near the country in upcoming months, warmer local water temperatures are likely to return and are expected to have an upward influence on air temperatures.
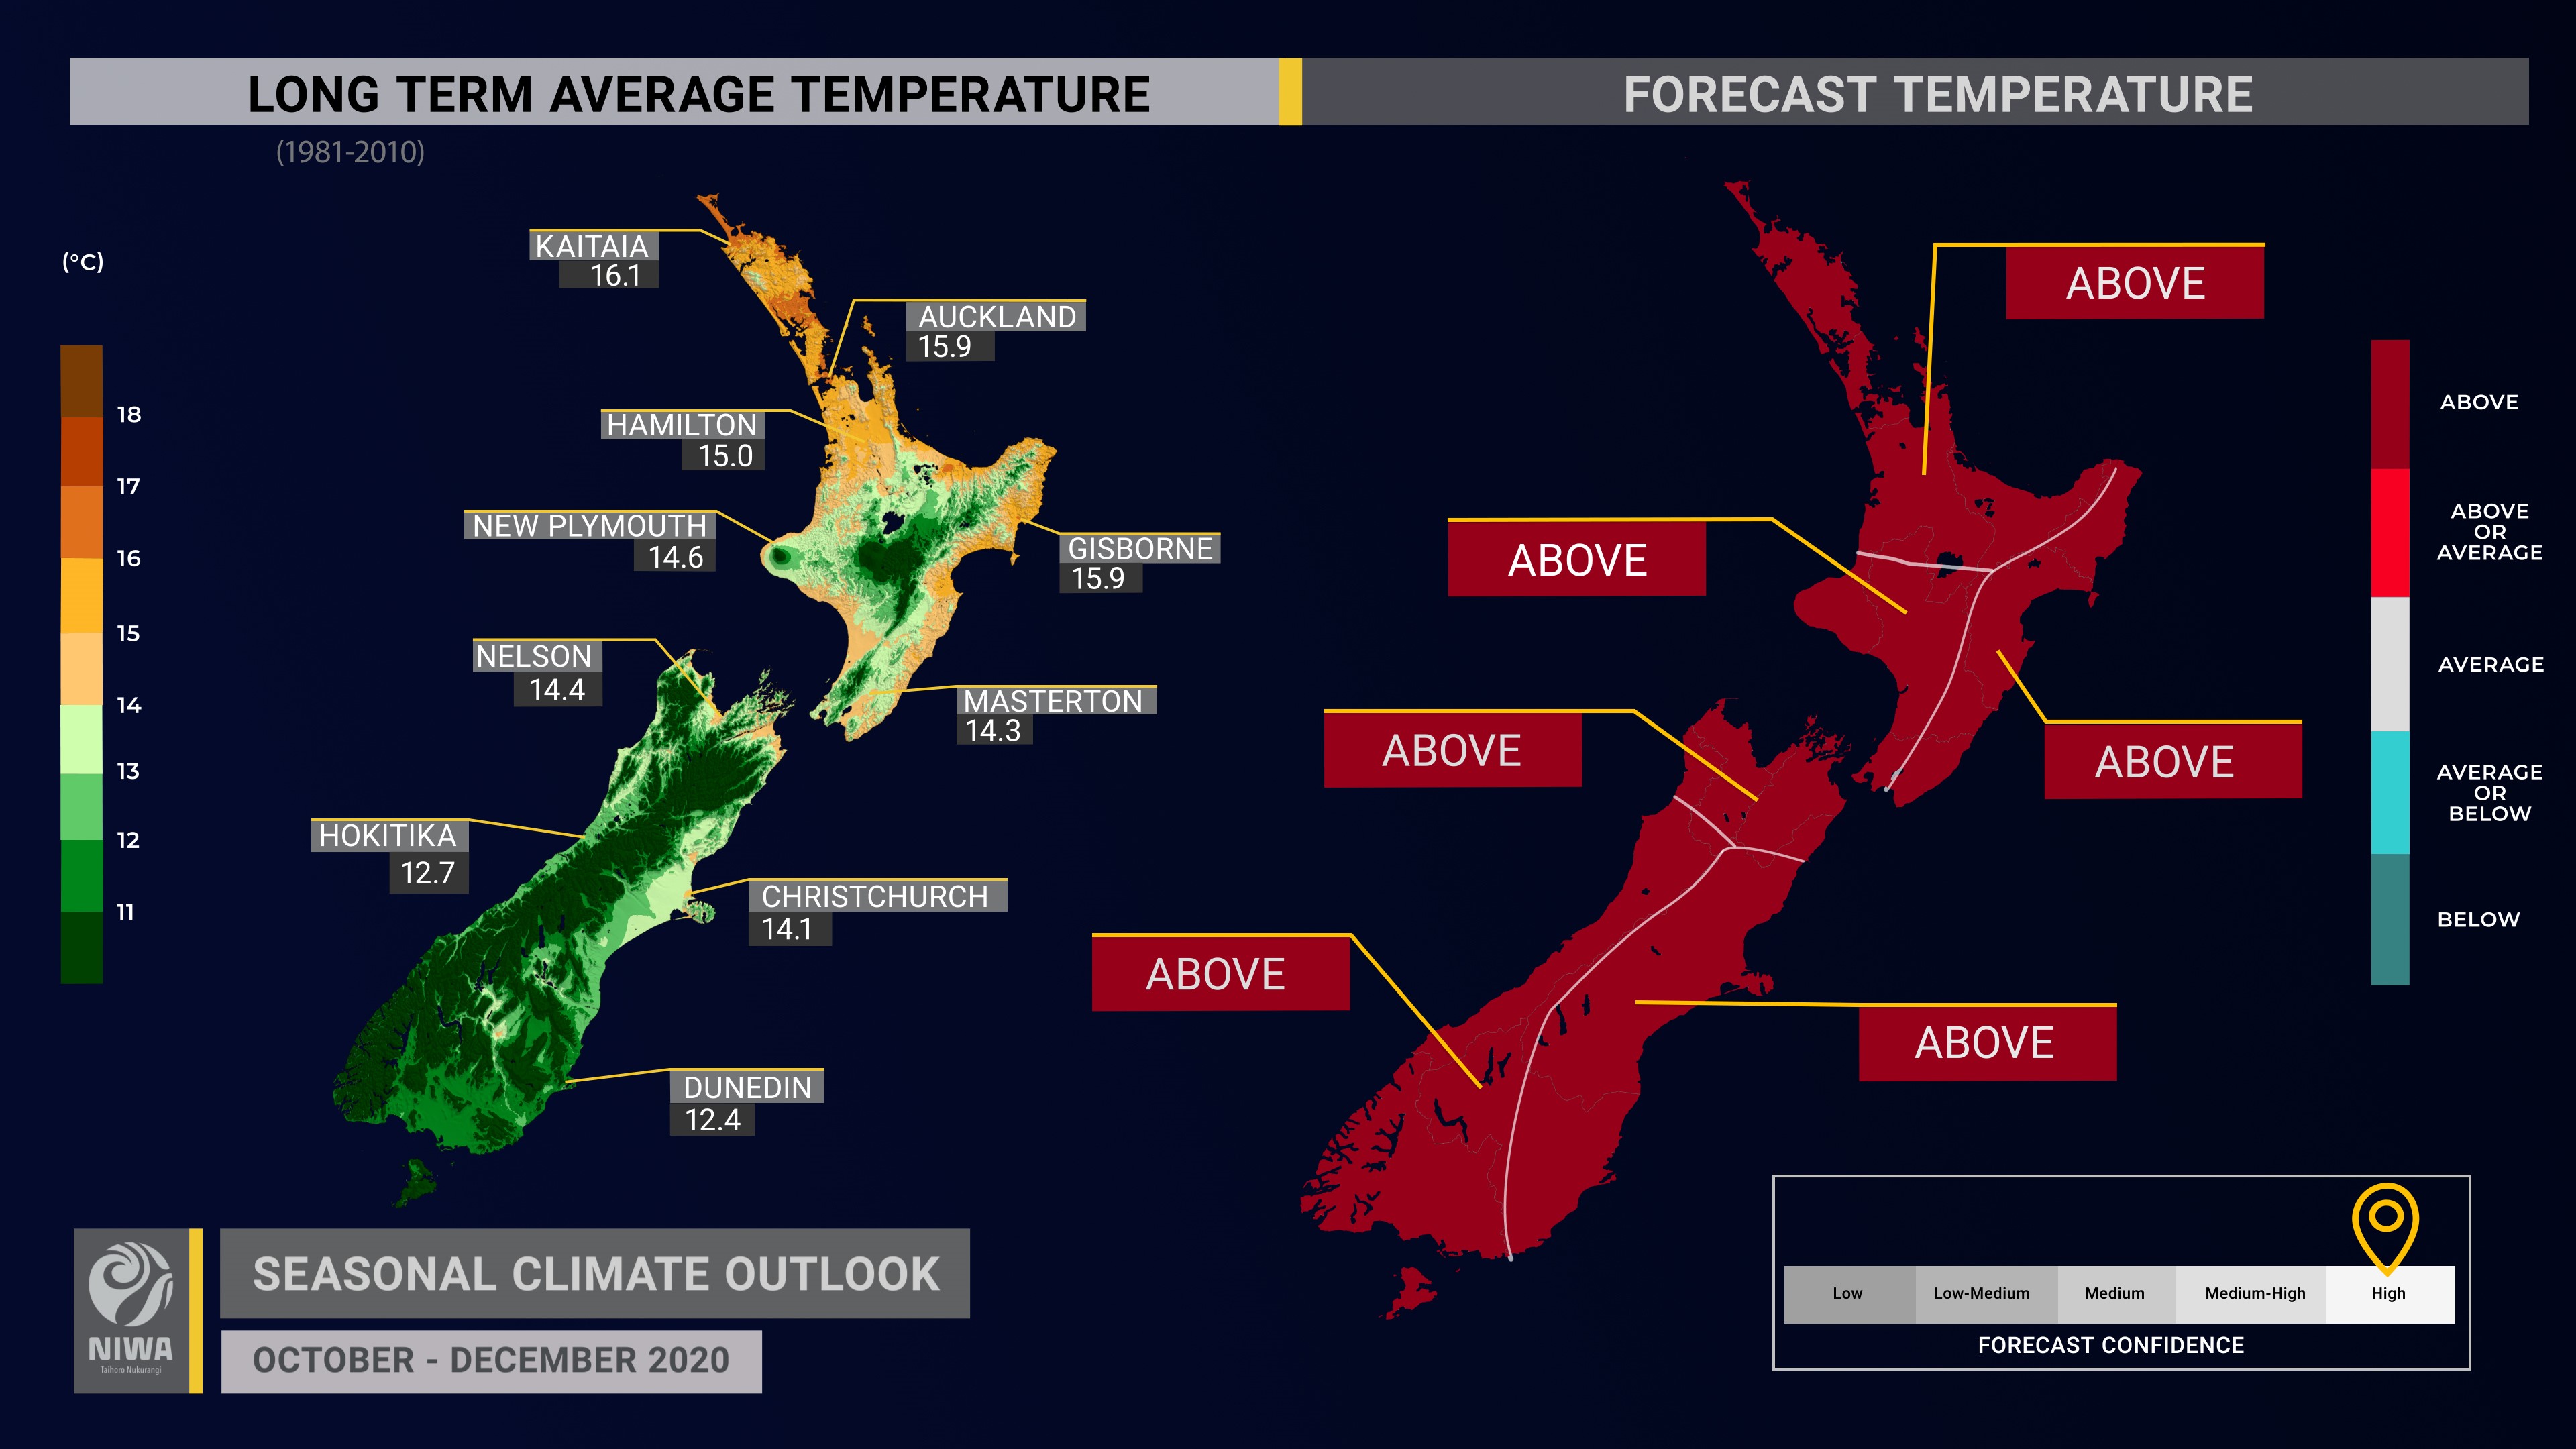
- Air temperatures are very likely to be above average in all regions of New Zealand. High temperature extremes will have an elevated chance of occurring, particularly on days with a strong northwest wind.
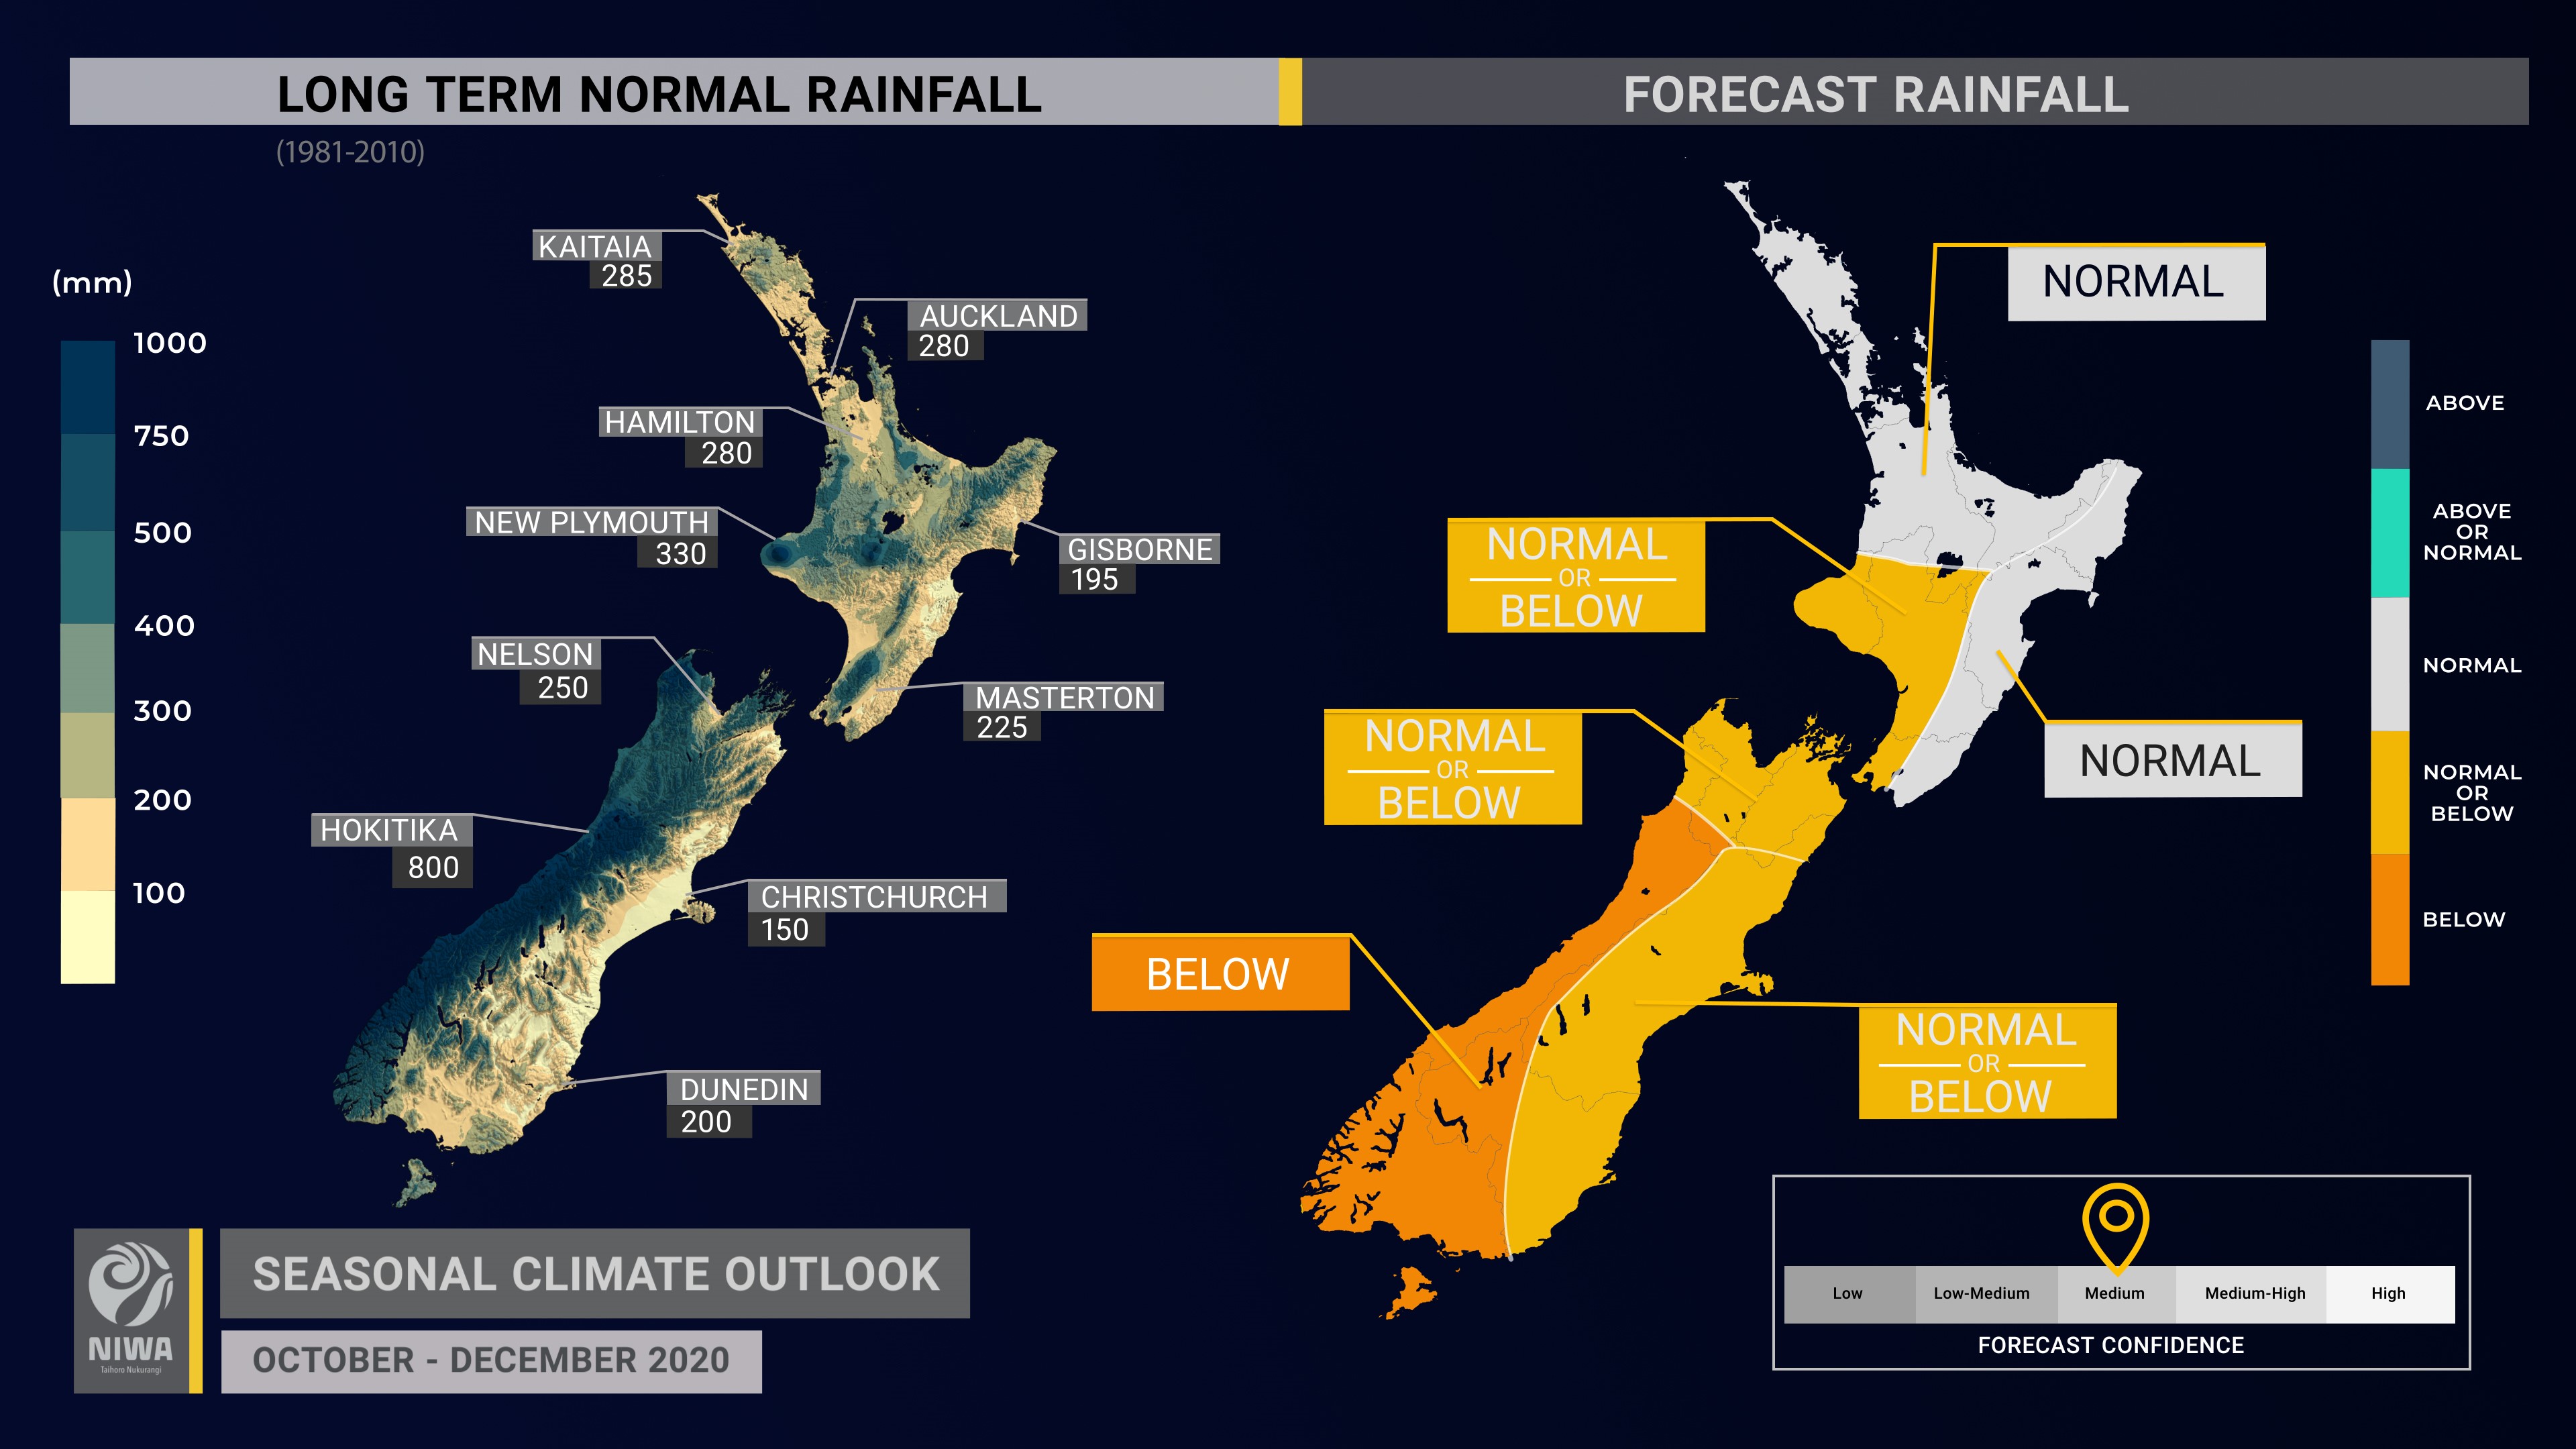
- Rainfall is likely to be near normal in the north and east of the North Island, about equally likely to be near normal or below normal in the west of the North Island and the north and east of the South Island, and below normal in the west of the South Island.
- Later in the three month period, northeasterly winds are expected to expose northern areas, such as Northland, the Coromandel Peninsula, and East Cape, to sub-tropical rainstorms while interior and western areas of the both islands remain sheltered from significant moisture, particularly in South Canterbury, Otago, the West Coast, and Southland.
- For northern New Zealand, including Auckland, a drier than normal start to the three month period is likely, but developing northeasterly winds could introduce more moisture in November or December.
- Past La Niña events have featured a gradual trend toward wetter conditions in northern New Zealand during late spring and early summer, with an increased chance for a moisture-rich tropical connection to develop.
- Soil moisture levels and river flows are most likely to be below normal in the north of the North Island and the east of the South Island. For all other regions, soil moisture levels and river flows are about equally likely to be near normal or below normal.
Regional predictions for October – December 2020
Northland, Auckland, Waikato, Bay of Plenty
The table below shows the probabilities (or percent chances) for each of three categories: above average, near average, and below average. In the absence of any forecast guidance there would be an equal likelihood (33% chance) of the outcome being in any one of the three categories. Forecast information from local and global guidance models is used to indicate the deviation from equal chance expected for the coming three-month period, with the following outcomes the most likely (but not certain) for this region:
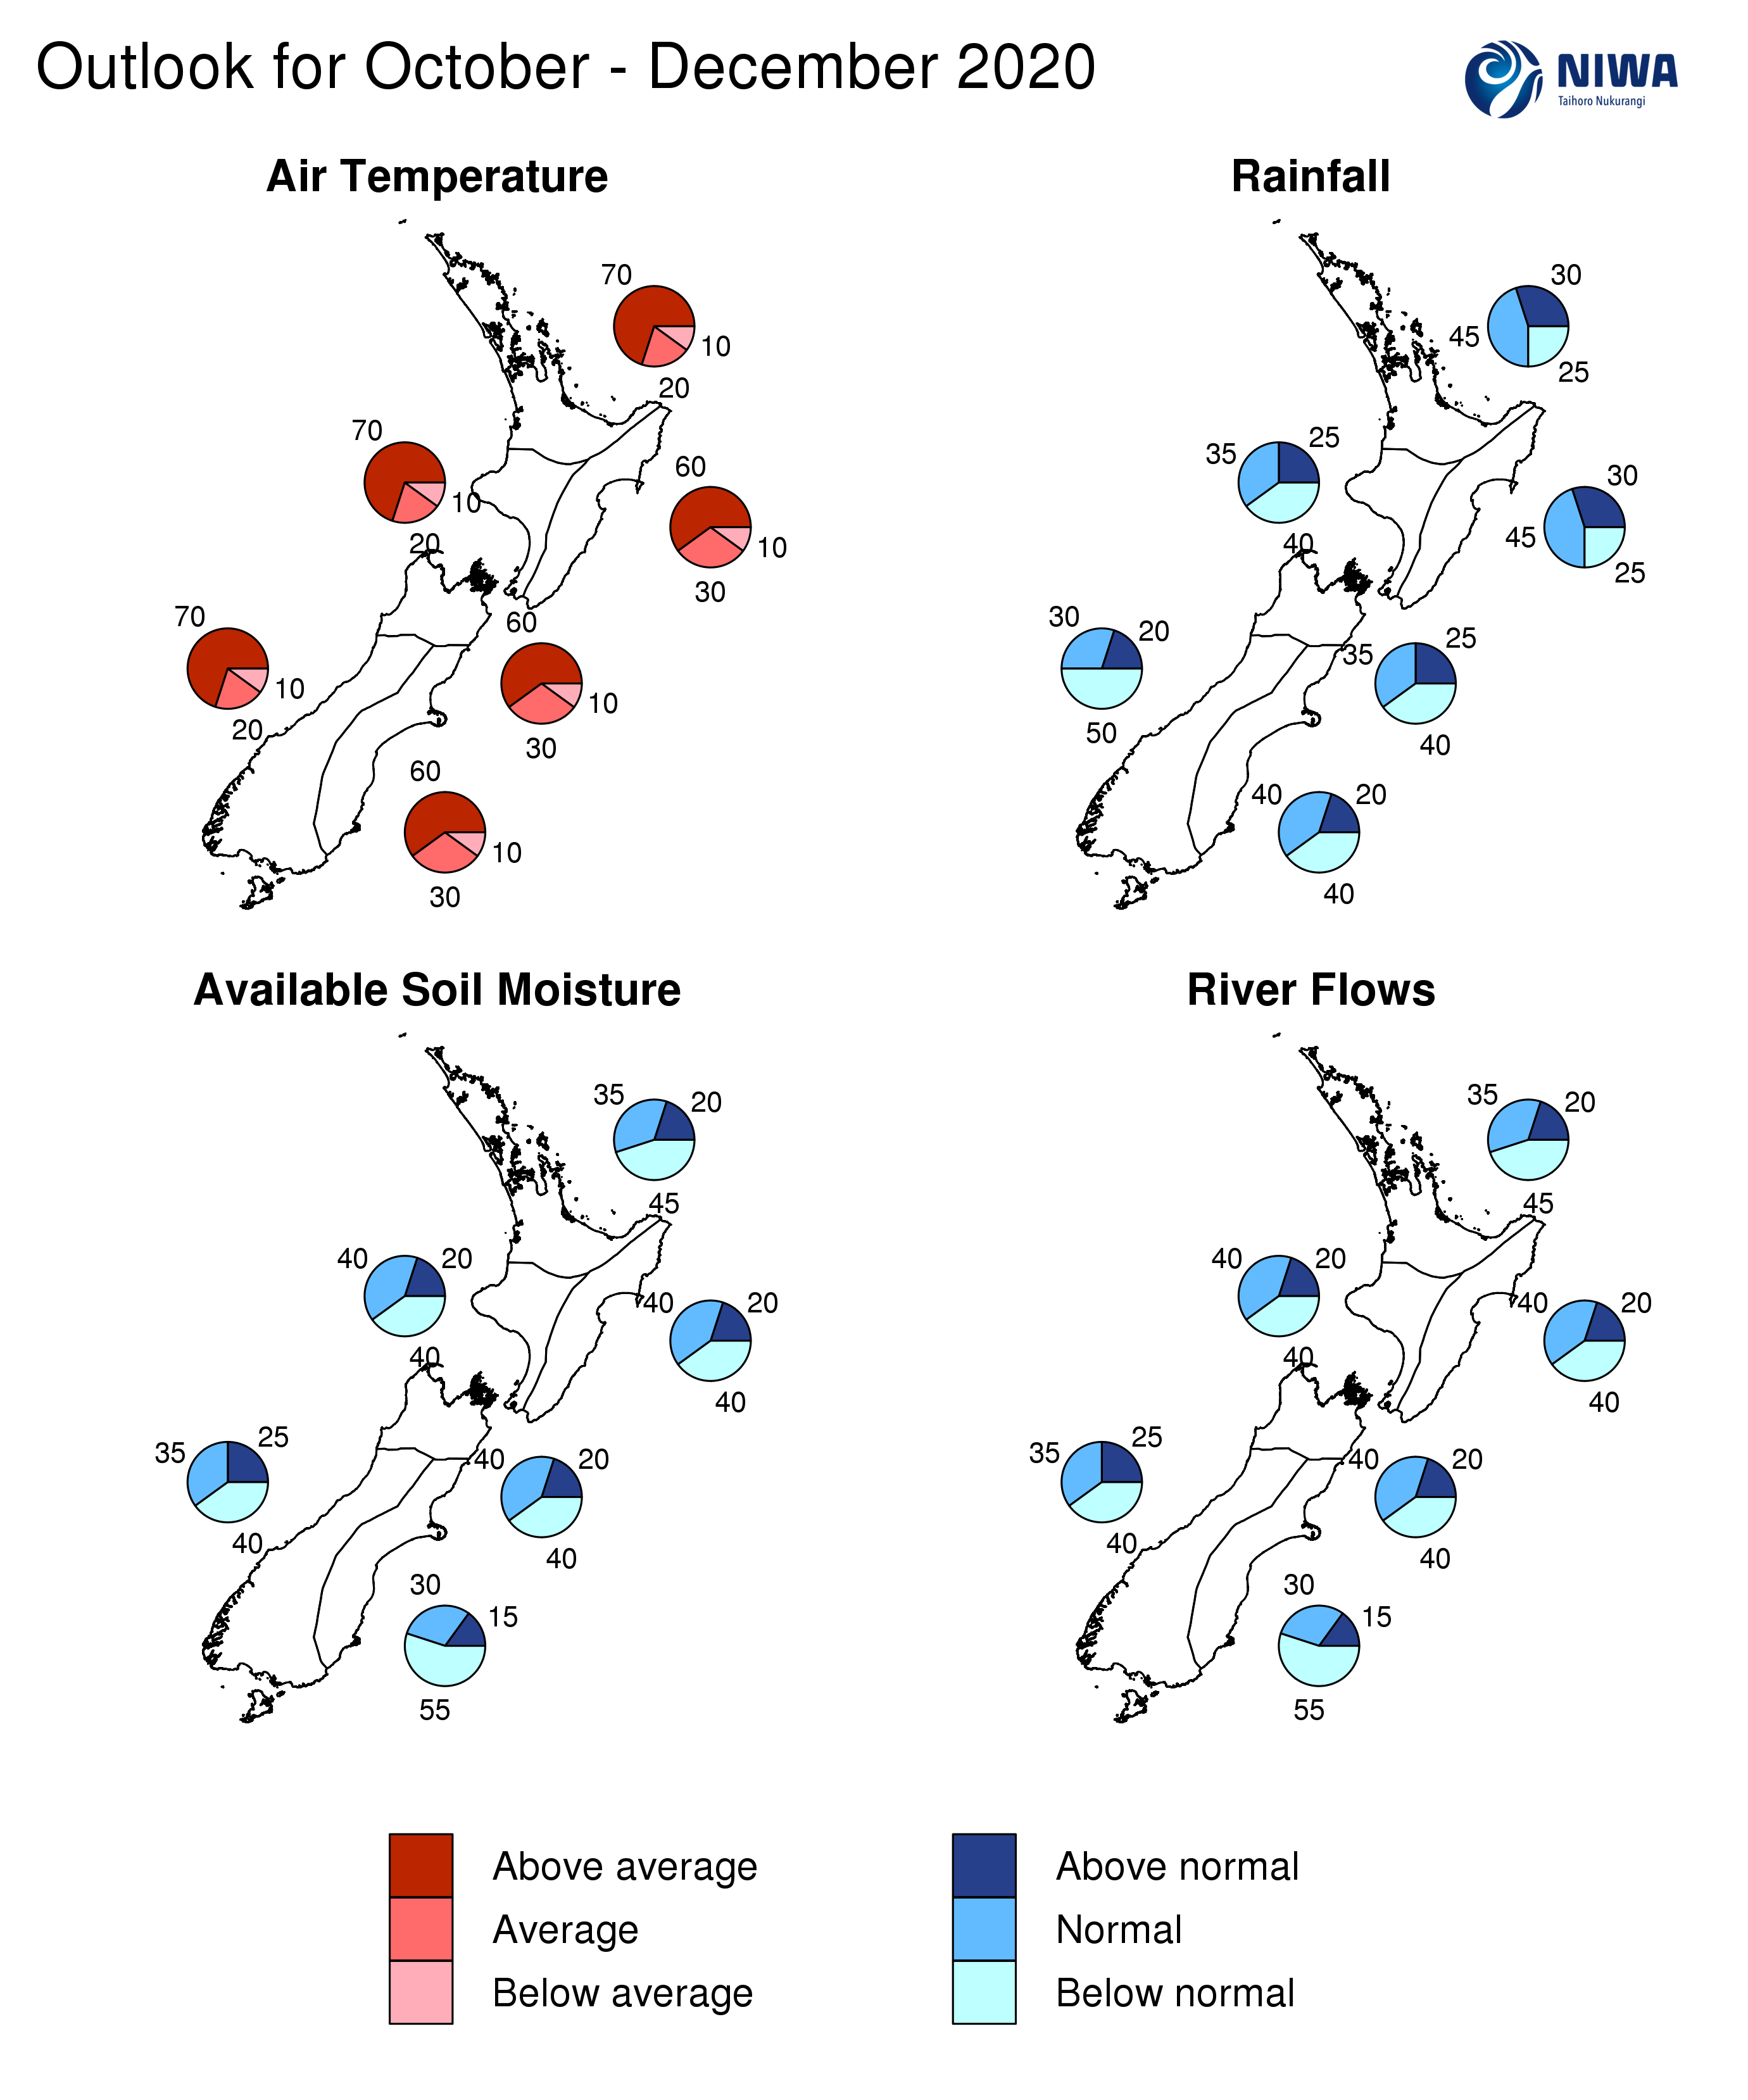
- Temperatures are very likely to be above average (70% chance).
- Rainfall totals are most likely to be near normal (45% chance).
- Soil moisture levels and river flows are likely to be below normal (45% chance).
The full probability breakdown is:
|
Temperature |
Rainfall |
Soil moisture |
River flows |
|
|
Above average |
70 |
30 |
20 |
20 |
|
Near average |
20 |
45 |
35 |
35 |
|
Below average |
10 |
25 |
45 |
45 |
Central North Island, Taranaki, Whanganui, Manawatu, Wellington
Probabilities are assigned in three categories: above average, near average, and below average.
- Temperatures are very likely to be above average (70% chance).
- Rainfall totals are about equally likely to be below normal (40% chance) or near normal (35% chance).
- Soil moisture levels and river flows are equally likely to be near normal (40% chance) or below normal (40% chance).
The full probability breakdown is:
|
Temperature |
Rainfall |
Soil moisture |
River flows |
|
|
Above average |
70 |
25 |
20 |
20 |
|
Near average |
20 |
35 |
40 |
40 |
|
Below average |
10 |
40 |
40 |
40 |
Gisborne, Hawke’s Bay, Wairarapa
Probabilities are assigned in three categories: above average, near average, and below average.
- Temperatures are very likely to be above average (60% chance).
- Rainfall totals are most likely to be near normal (45% chance).
- Soil moisture levels and river flows are equally likely to be near normal (40% chance) or below normal (40% chance).
The full probability breakdown is:
|
Temperature |
Rainfall |
Soil moisture |
River flows |
|
|
Above average |
60 |
30 |
20 |
20 |
|
Near average |
30 |
45 |
40 |
40 |
|
Below average |
10 |
25 |
40 |
40 |
Tasman, Nelson, Marlborough, Buller
Probabilities are assigned in three categories: above average, near average, and below average.
- Temperatures are very likely to be above average (60% chance).
- Rainfall totals are about equally likely to be below normal (40% chance) or near normal (35% chance).
- Soil moisture levels and river flows are equally likely to be near normal (40% chance) or below normal (40% chance).
The full probability breakdown is:
|
Temperature |
Rainfall |
Soil moisture |
River flows |
|
|
Above average |
60 |
25 |
20 |
20 |
|
Near average |
30 |
35 |
40 |
40 |
|
Below average |
10 |
40 |
40 |
40 |
West Coast, Alps and foothills, inland Otago, Southland
Probabilities are assigned in three categories: above average, near average, and below average.
- Temperatures are very likely to be above average (70% chance).
- Rainfall totals are most likely to be below normal (50% chance).
- Soil moisture levels and river flows are about equally likely to be below normal (40% chance) or near normal (35% chance).
The full probability breakdown is:
|
Temperature |
Rainfall |
Soil moisture |
River flows |
|
|
Above average |
70 |
20 |
25 |
25 |
|
Near average |
20 |
30 |
35 |
35 |
|
Below average |
10 |
50 |
40 |
40 |
Coastal Canterbury, east Otago
Probabilities are assigned in three categories: above average, near average, and below average.
- Temperatures are very likely to be above average (60% chance).
- Rainfall totals are equally likely to be near normal or below normal (40% chance).
- Soil moisture levels and river flows are most likely to be below normal (55% chance).
The full probability breakdown is:
|
Temperature |
Rainfall |
Soil moisture |
River flows |
|
|
Above average |
60 |
20 |
15 |
15 |
|
Near average |
30 |
40 |
30 |
30 |
|
Below average |
10 |
40 |
55 |
55 |
Graphical representation of the regional probabilities
Background
The NINO3.4 Index anomaly (in the central Pacific) for September (through the 27th) was -0.71˚C, decreasing from -0.39˚C last month. The NINO 1+2 Index posted a value of -0.76˚C, slightly increasing from -0.89˚C last month. The SOI (Southern Oscillation Index) value for September (through the 28th) was +1.0 (on the La Niña threshold).
Upper-oceanic heat content remained lower than normal in the eastern and central equatorial Pacific with continued decreases observed in the east-central part of the basin since August. Heat content continued to be higher than normal in the western Pacific. Overall, this pattern is well aligned with a developing La Niña event.
In the subsurface ocean, an upwelling Kelvin wave at depth (to 200 m) continues to be observed in the central equatorial Pacific, while shallower water cooled further during September. This feature will likely surface in the east-central equatorial Pacific during the next three months, solidifying an oceanic La Niña state.
Trade winds during September continued to be stronger than normal across the equatorial Pacific, particularly near and west of the International Date Line. This contributed to additional upwelling, which led to continued cooling sea surface temperatures. A surge in trade winds is expected to accelerate cooling across the central Pacific Ocean during October.
According to the consensus from international models, the probability for La Niña conditions is 77% for October – December, an increase of 20% from last month. For the January—March 2021 period, the probability for La Niña is 51% and 46% for ENSO-neutral conditions.
New Zealand’s coastal sea surface temperature anomalies cooled moderately during September, although all regions continue to have positive temperature anomalies. The cooling trend during September was driven by a more active weather pattern producing mixing in the waters surrounding New Zealand. However, with high pressure likely to set up near the country in the coming months, increasing local water temperatures are likely to return. Of note is the forecast by several models for well above average Tasman Sea surface temperatures by the end of the season. The last La Niña event (2017-18) saw marine heatwave conditions develop around New Zealand in November-December 2017.
New Zealand Coastal Sea Surface Temperatures during September 2020 (to the 28th):
|
North NI |
West NI |
East NI |
North SI |
West SI |
East SI |
|
+0.11˚C |
+0.30˚C |
+0.30˚C |
+0.33˚C |
+0.50˚C |
+0.65˚C |
Southern Annular Mode (SAM)
The Southern Annular Mode (SAM) was negative in early September before turning positive through the mid-month, and negative again in late September. The SAM is forecast to turn positive again in early October, associated with high pressure and a lack of rainfall in the New Zealand region.
The Madden-Julian Oscillation (MJO) was intermittently active over the Maritime Continent (Indonesia) during September. However, recent intraseasonal variability suggests the ocean-atmosphere system has yet to fully couple as a traditional La Niña. Tropical forcing from the MJO is expected to continue to be favoured over the eastern Indian Ocean and the Maritime Continent during the next three months, which is consistent with La Niña and should influence New Zealand’s weather and climate as described in this outlook.
Overall, the La Niña-like response is expected to increase through the upcoming three-month period, and the existence of a meaningful ENSO signal should help with climate predictability in New Zealand. However, much of October may still feature a westerly flow anomaly before transitioning to predominant northeasterlies thereafter. A classical La Niña spring involves more northeasterly quarter winds than normal. La Niña springs have historically been associated with below normal rainfall for swaths of the South Island and lower North Island as well as above average temperatures for much of the country.
Forecast Confidence
Temperature
|
Forecast confidence for temperatures is high. Guidance is in strong agreement for a warmer than average three-month period across New Zealand, owing to more northeasterly winds than normal and expected warmer than average coastal sea temperatures. |
Rainfall
|
Forecast confidence for rainfall is medium. Expected La Niña-like conditions in the tropical Pacific help with predictability, although seasonal climate model guidance is a bit wetter than NIWA’s official outlook, which has the benefit of incorporating sub-seasonal and analog-based guidance. |