Outlook Summary
- ENSO-neutral conditions continued during May. The Southern Oscillation Index (SOI) was neutral and central Pacific sea surface temperatures (SSTs) were near average for the time of year.
- Oceanic ENSO-neutral conditions will very likely persist (71% chance) over the next three months.
- The long-standing climate drivers that have contributed to dryness over much of New Zealand are expected to influence our weather for at least the first half of the winter season.
- Climate drivers may evolve late in winter or during spring with the potential for an Indian Ocean Dipole (IOD) event and oceanic La Niña conditions, which could cause a change in temperature and rainfall patterns.
- Although more westerly winds than normal are expected, the aforementioned change in climate drivers could lead to periodic easterly quarter winds, particularly later in the winter season.
- June – August 2020 air pressure is forecast to be higher than normal to the north of, and sometimes over New Zealand. During periods of high pressure, especially during June, cold, frosty mornings are likely in typically colder locations.
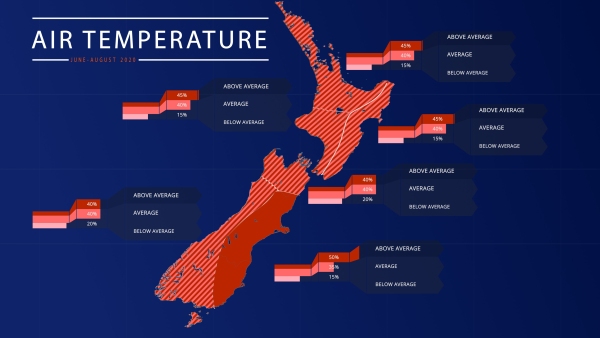
- As a whole, air temperatures are most likely to be above average in the east of the South Island and about equally likely to be near average or above average in all other regions.
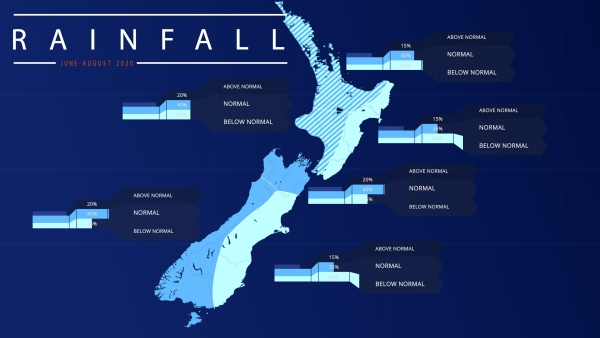
- Rainfall is most likely to be below normal in the east of both islands, near normal in the west and north of the South Island, and about equally likely to be near normal or below normal in the north and west of the North Island.
Chris Brandolino (Principal Scientist - Forecasting), and Ben Noll (Meteorologist/Forecaster) explain the upcoming Seasonal Climate Outlook details for June to August 2020.
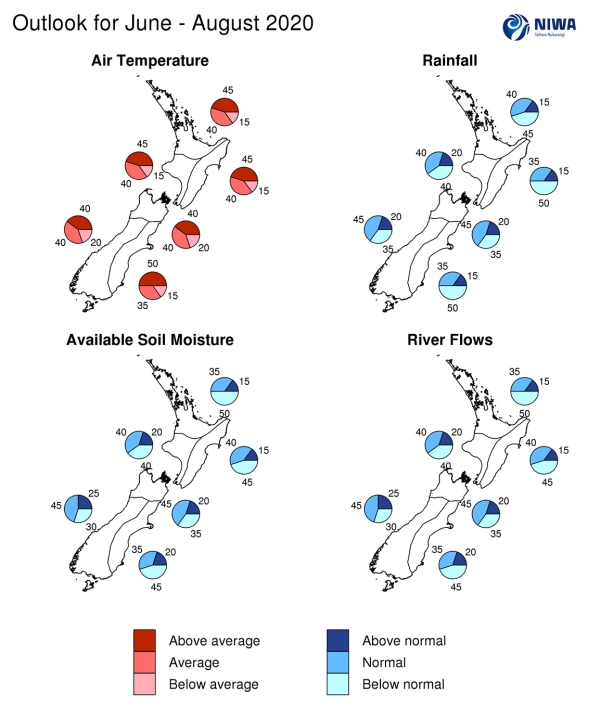
June – August 2020 air temperatures are most likely to be above average (50% chance) in the east of the South Island and about equally likely to near average (40%) or above average (40-45% chance) in all other regions.
June – August 2020 rainfall is most likely to be below normal (50% chance) in the east of both islands, near normal (45% chance) in the west and north of the South Island, and about equally likely to be near normal (40% chance) or below normal (40-45% chance) in the north and west of the North Island.
June – August 2020 soil moisture levels and river flows are most likely to be below normal (45-50% chance) in the north of the North Island and east of the South Island. Near normal soil moisture levels and river flows are most likely (45% chance) in the west and north of the South Island. For the west and east of the North Island, soil moisture levels and river flows are about equally likely to be near normal (40% chance) or below normal (40-45% chance).
Regional predictions for June – August 2020
Northland, Auckland, Waikato, Bay of Plenty
The table below shows the probabilities (or percent chances) for each of three categories: above average, near average, and below average. In the absence of any forecast guidance there would be an equal likelihood (33% chance) of the outcome being in any one of the three categories. Forecast information from local and global guidance models is used to indicate the deviation from equal chance expected for the coming three-month period, with the following outcomes the most likely (but not certain) for this region:
- Temperatures are about equally likely to be near average (40% chance) or above average (45% chance).
- Rainfall totals are about equally likely to be near normal (40% chance) or below normal (45% chance).
- Soil moisture levels and river flows are most likely to be below normal (50% chance).
The full probability breakdown is:
|
Temperature |
Rainfall |
Soil moisture |
River flows |
|
|
Above average |
45 |
15 |
15 |
15 |
|
Near average |
40 |
40 |
35 |
35 |
|
Below average |
15 |
45 |
50 |
50 |
Central North Island, Taranaki, Whanganui, Manawatu, Wellington
Probabilities are assigned in three categories: above average, near average, and below average.
- Temperatures are about equally likely to be near average (40% chance) or above average (45% chance).
- Rainfall totals are equally likely to be near normal (40% chance) or below normal (40% chance).
- Soil moisture levels and river flows are equally likely to be near normal (40% chance) or below normal (40% chance).
The full probability breakdown is:
|
Temperature |
Rainfall |
Soil moisture |
River flows |
|
|
Above average |
45 |
20 |
20 |
20 |
|
Near average |
40 |
40 |
40 |
40 |
|
Below average |
15 |
40 |
40 |
40 |
Gisborne, Hawke’s Bay, Wairarapa
Probabilities are assigned in three categories: above average, near average, and below average.
- Temperatures are about equally likely to be near average (40% chance) or above average (45% chance).
- Rainfall totals are most likely to be below normal (50% chance).
- Soil moisture levels and river flows are about equally likely to be near normal (40% chance) or below normal (45% chance).
The full probability breakdown is:
|
Temperature |
Rainfall |
Soil moisture |
River flows |
|
|
Above average |
45 |
15 |
15 |
15 |
|
Near average |
40 |
35 |
40 |
40 |
|
Below average |
15 |
50 |
45 |
45 |
Tasman, Nelson, Marlborough, Buller
Probabilities are assigned in three categories: above average, near average, and below average.
- Temperatures are equally likely to be near average (40% chance) or above average (40% chance).
- Rainfall totals are most likely to be near normal (45% chance).
- Soil moisture levels and river flows are most likely to be near normal (45% chance).
The full probability breakdown is:
|
Temperature |
Rainfall |
Soil moisture |
River flows |
|
|
Above average |
40 |
20 |
20 |
20 |
|
Near average |
40 |
45 |
45 |
45 |
|
Below average |
20 |
35 |
35 |
35 |
West Coast, Alps and foothills, inland Otago, Southland
Probabilities are assigned in three categories: above average, near average, and below average.
- Temperatures are equally likely to be near average (40% chance) or above average (40% chance).
- Rainfall totals are most likely to be near normal (45% chance).
- Soil moisture levels and river flows are most likely to be near normal (45% chance).
The full probability breakdown is:
|
Temperature |
Rainfall |
Soil moisture |
River flows |
|
|
Above average |
40 |
20 |
25 |
25 |
|
Near average |
40 |
45 |
45 |
45 |
|
Below average |
20 |
35 |
30 |
30 |
Coastal Canterbury, east Otago
Probabilities are assigned in three categories: above average, near average, and below average.
- Temperatures are most likely to be above average (50% chance).
- Rainfall totals are most likely to be below normal (50% chance).
- Soil moisture levels and river flows are most likely to be below normal (45% chance).
The full probability breakdown is:
|
Temperature |
Rainfall |
Soil moisture |
River flows |
|
|
Above average |
50 |
15 |
20 |
20 |
|
Near average |
35 |
35 |
35 |
35 |
|
Below average |
15 |
50 |
45 |
45 |
Graphical representation of the regional probabilities
Background
The NINO3.4 Index anomaly (in the central Pacific) for May 2020 (to the 24th) was +0.01˚C (neutral), a substantial decrease from the previous month. The NINO4 region anomaly fell to +0.17˚C and NINO 1+2 Index decreased to +0.02˚C.
These anomalies are consistent with declining upper-oceanic heat content (OHC) across the equatorial Pacific. In particular, OHC was below average east of the International Date Line, suggestive of an ocean system that may be trending toward La Niña.
Furthermore, in the subsurface ocean, cooler than average temperatures continued to push eastward during May. In fact, some surfacing of these cooler waters was evident in the central and eastern part of the basin. Additionally, subsurface anomalies decreased to -3˚C near 100 m depth, a decrease of 1 to 2˚C compared to the previous month. This also gives validity to the idea that oceanic La Niña conditions could arrive by spring as some models suggest.
La Niña is typically associated with more northeasterly winds in New Zealand and wetter conditions in the north and east.
Trade winds during May were stronger than normal across most of the equatorial Pacific, particularly in the east-central part of the basin. This pattern is expected to continue over the next 1-2 months, likely leading to continued cooling in the equatorial Pacific.
According to the consensus from international models, ENSO-neutral conditions are very likely (71% chance) for the June–August period. The probability for La Niña increases to 31% by spring.
During May, New Zealand’s coastal water temperatures were generally near or slightly above average for the time of year. Slightly warmer coastal SSTs could have an upward influence on air temperatures during at least part of the upcoming season.
New Zealand Coastal Sea Surface Temperatures during May 2020 (to the 26th):
|
North NI |
West NI |
East NI |
North SI |
West SI |
East SI |
|
+0.30˚C |
+0.32˚C |
+0.29˚C |
0.04˚C |
-0.30˚C |
+0.23˚C |
The Southern Annular Mode (SAM) was negative for the first half of May before becoming positive. The SAM is forecast to remain mostly positive during the first half of June, particularly during the 2nd week of the month as high pressure builds over New Zealand.
The Madden-Julian Oscillation (MJO) was convectively active from the Indian Ocean to the Maritime Continent during the second half of May. This was associated with the formation of two cyclones in the tropical eastern Indian Ocean. This pulse also generated a westerly wind burst in the eastern Indian Ocean which could mark the start of a transition toward a negative IOD (Indian Ocean Dipole) pattern. The IOD is an ocean-atmosphere seesaw that impacts sea surface temperatures, rainfall, and wind.
During the next 1-2 months, the MJO will likely be most active over Africa and the western Indian Ocean. Convection and rainfall looks to be suppressed over the tropical Pacific, which may mean that New Zealand will be less exposed to moist northerly air flows during winter.
Historically, phases 8-1-2, which are favoured during June and July, don’t produce above normal rainfall in New Zealand. These same phases also favour average or above average temperatures.
Should a transition toward a negative IOD and La Niña continue, it may be the case that MJO activity becomes more frequent over the eastern Indian Ocean and Maritime Continent, especially during the second half of winter and into spring. This would be associated with a higher chance for above normal rainfall in the north and east of the North Island in time, but not right away.
Forecast Confidence
Temperature
|
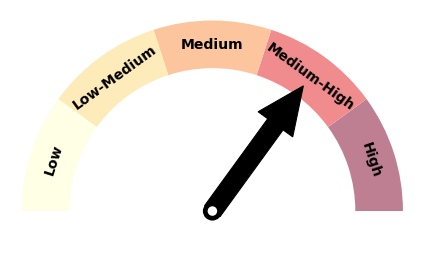
Forecast confidence for temperature is medium to high. There is widespread model agreement that a colder than average winter is unlikely. A westerly quarter air flow anomaly will likely cause unusually warm conditions at times in the east of both islands. Coastal sea surface temperatures are near or slightly above average, further supporting average or above average air temperatures. |
Rainfall
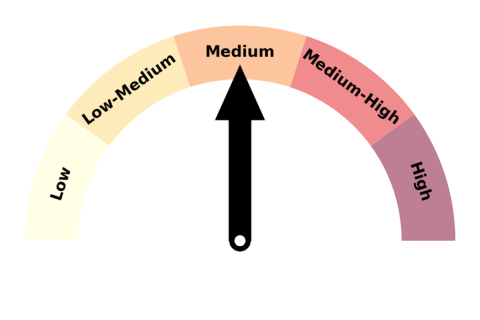
|
Forecast confidence for rainfall is medium. The climate drivers that have caused very dry conditions so far in 2020 are expected to remain in place for at least part of the winter season. Later in the season, the potential emergence of new climate drivers (like the Indian Ocean Dipole and La Niña) could result in changing weather patterns. |