Outlook Summary
- Ocean temperatures in the central Pacific continued to cool during June and are slightly below average for the time of year. Oceanic La Niña conditions (47% chance) and ENSO-neutral conditions (51% chance) are about equally likely for the next three months.
- NIWA’s criteria for a “La Niña watch” have been met. A La Niña watch is issued when ocean waters become unusually cool in the equatorial Pacific, trade winds have increased in strength, and there is an expectation for these conditions to continue for at least several months.
- July – September 2020 air pressure is forecast to be higher than normal to the north of New Zealand. Although westerly quarter air flow anomalies are expected for the season as a whole, the potential development of La Niña can influence periodic northeasterly quarter winds throughout the season.
- During periods of northeasterly winds, the chance for moist, subtropical low pressure systems (similar to those experienced in late June) is expected to increase.
- Air temperatures are most likely to be above average in the east of the North Island and about equally likely to be near average or above average in all other regions. Frosts are likely in typically colder locations.
- Rainfall is about equally likely to be near normal or below normal in the west of the South Island, about equally likely to be near normal or above normal in the east of the North Island, and most likely to be near normal in all other regions.
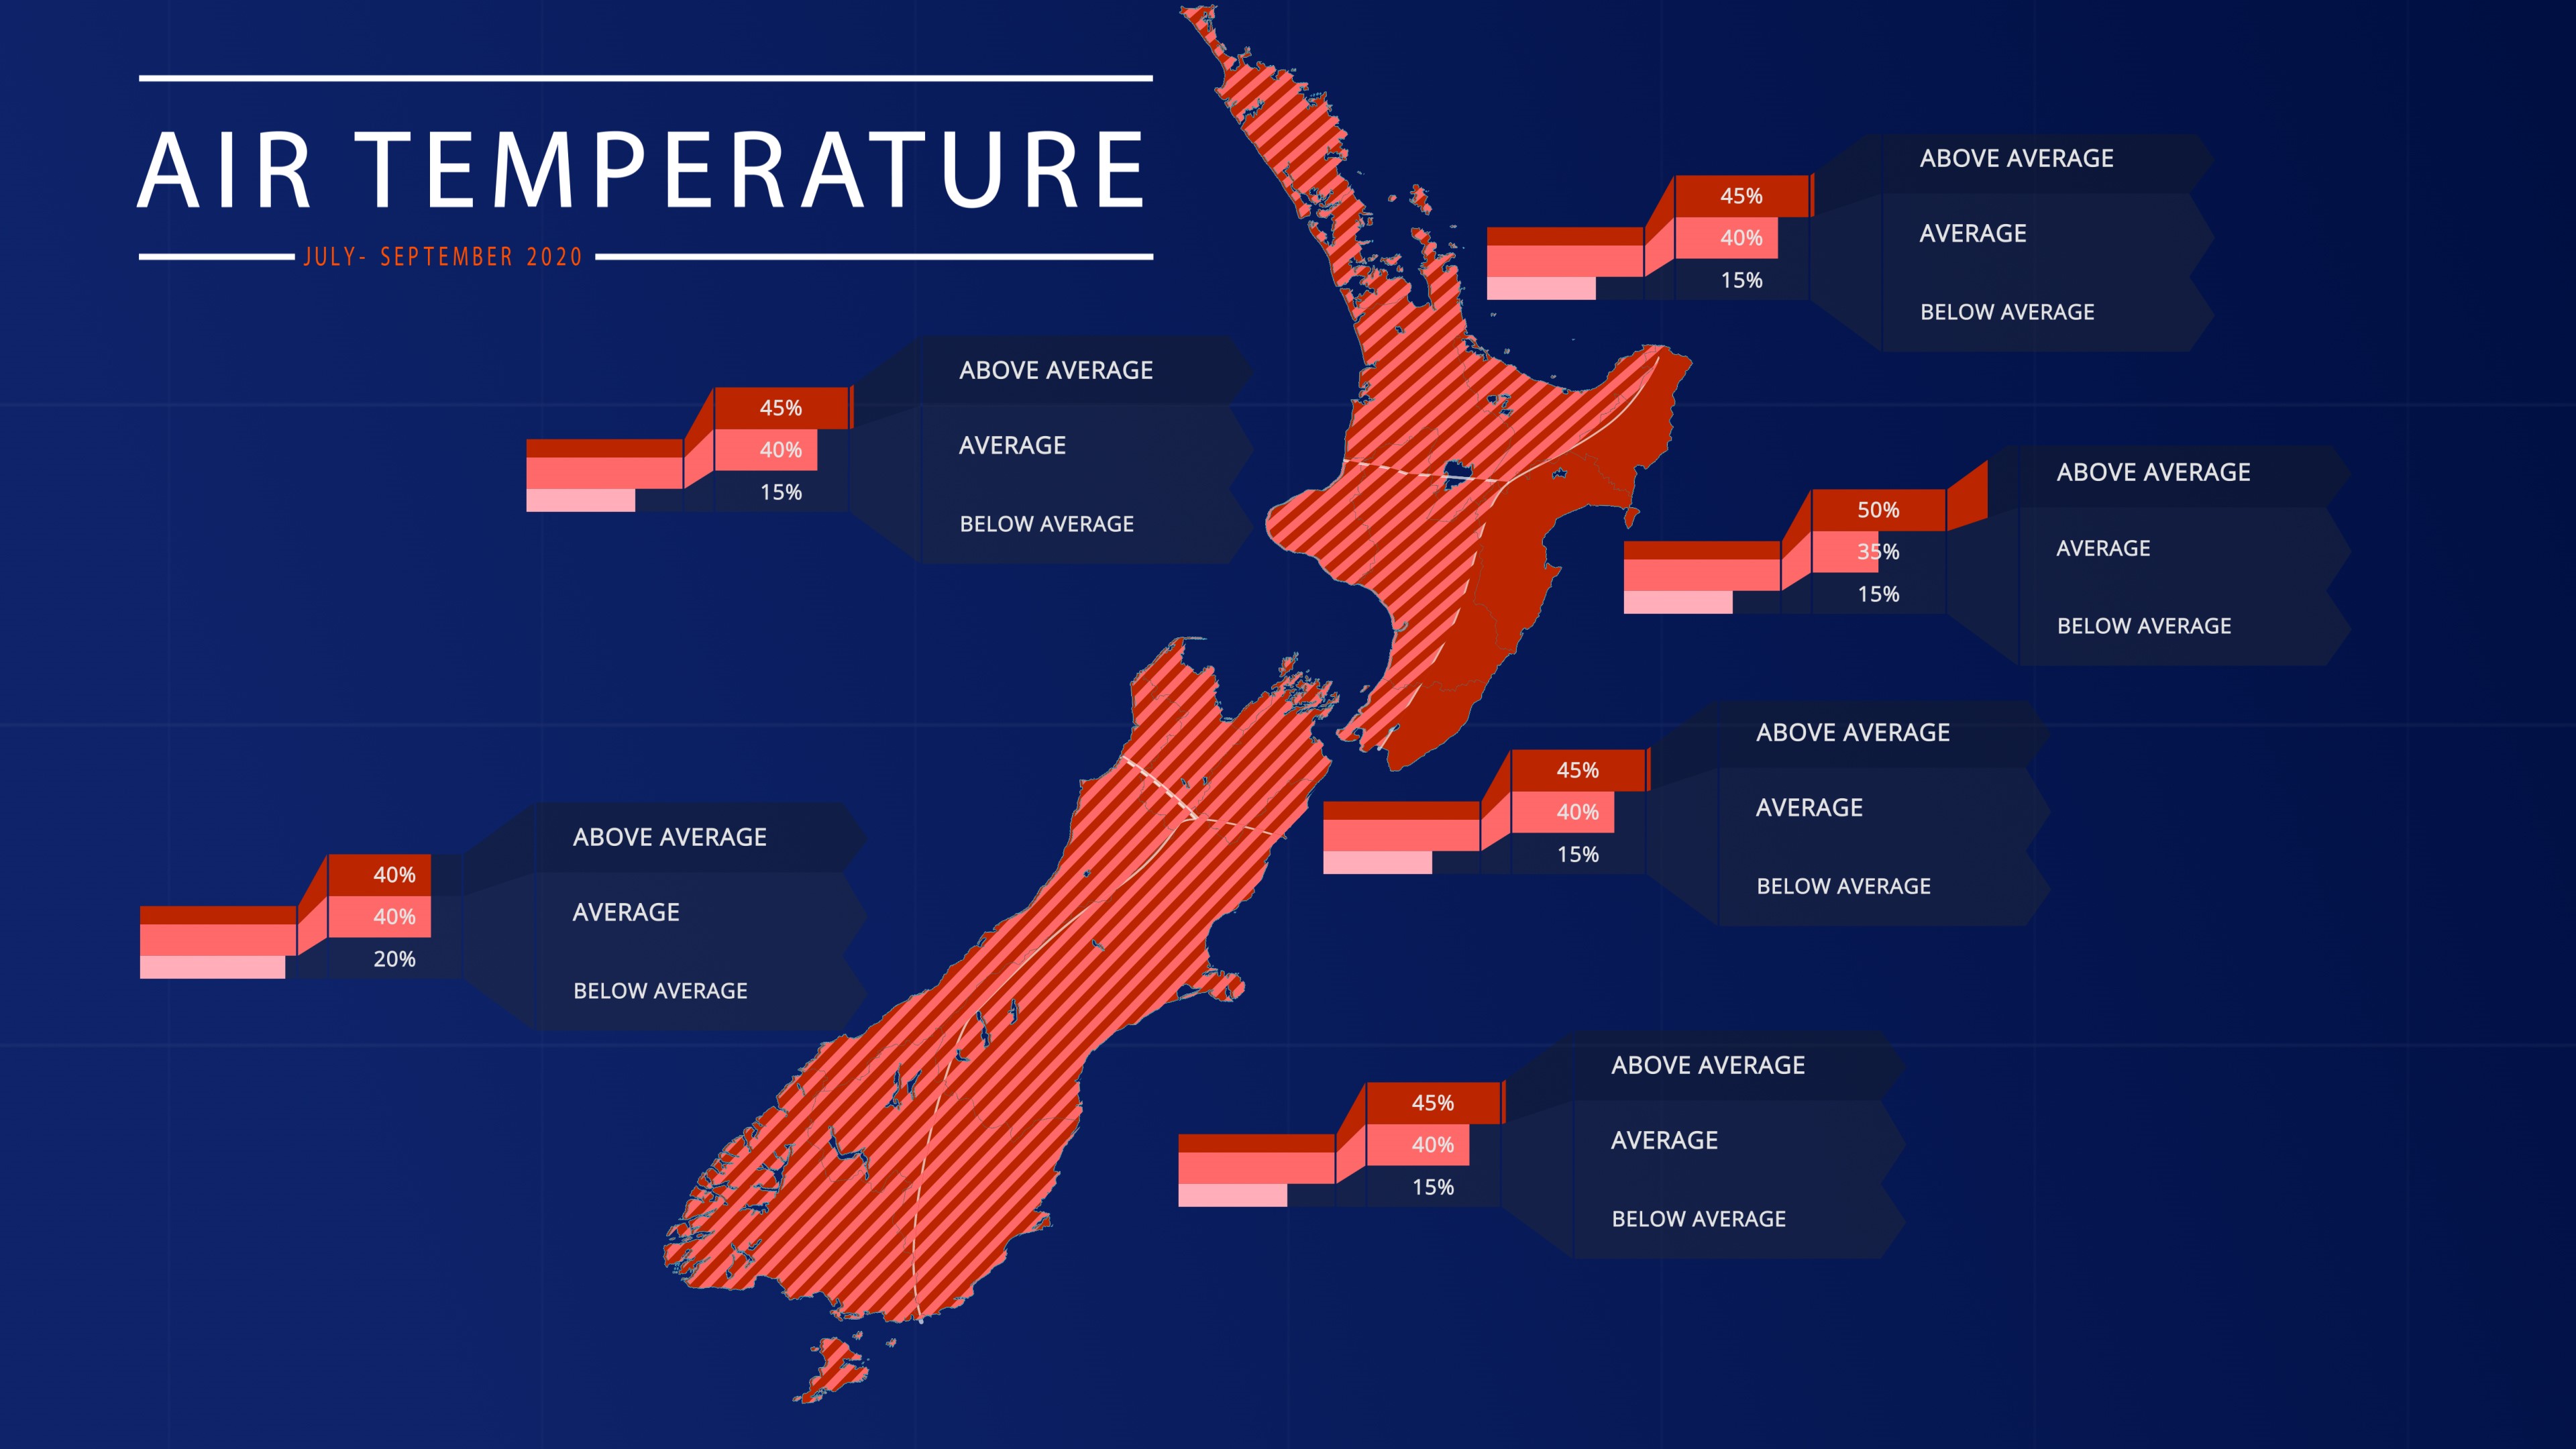
Air temperature
July – September 2020 air temperatures are most likely to be above average (50% chance) in the east of the North Island and about equally likely to be near average (40%) or above average (40-45% chance) in all other regions.
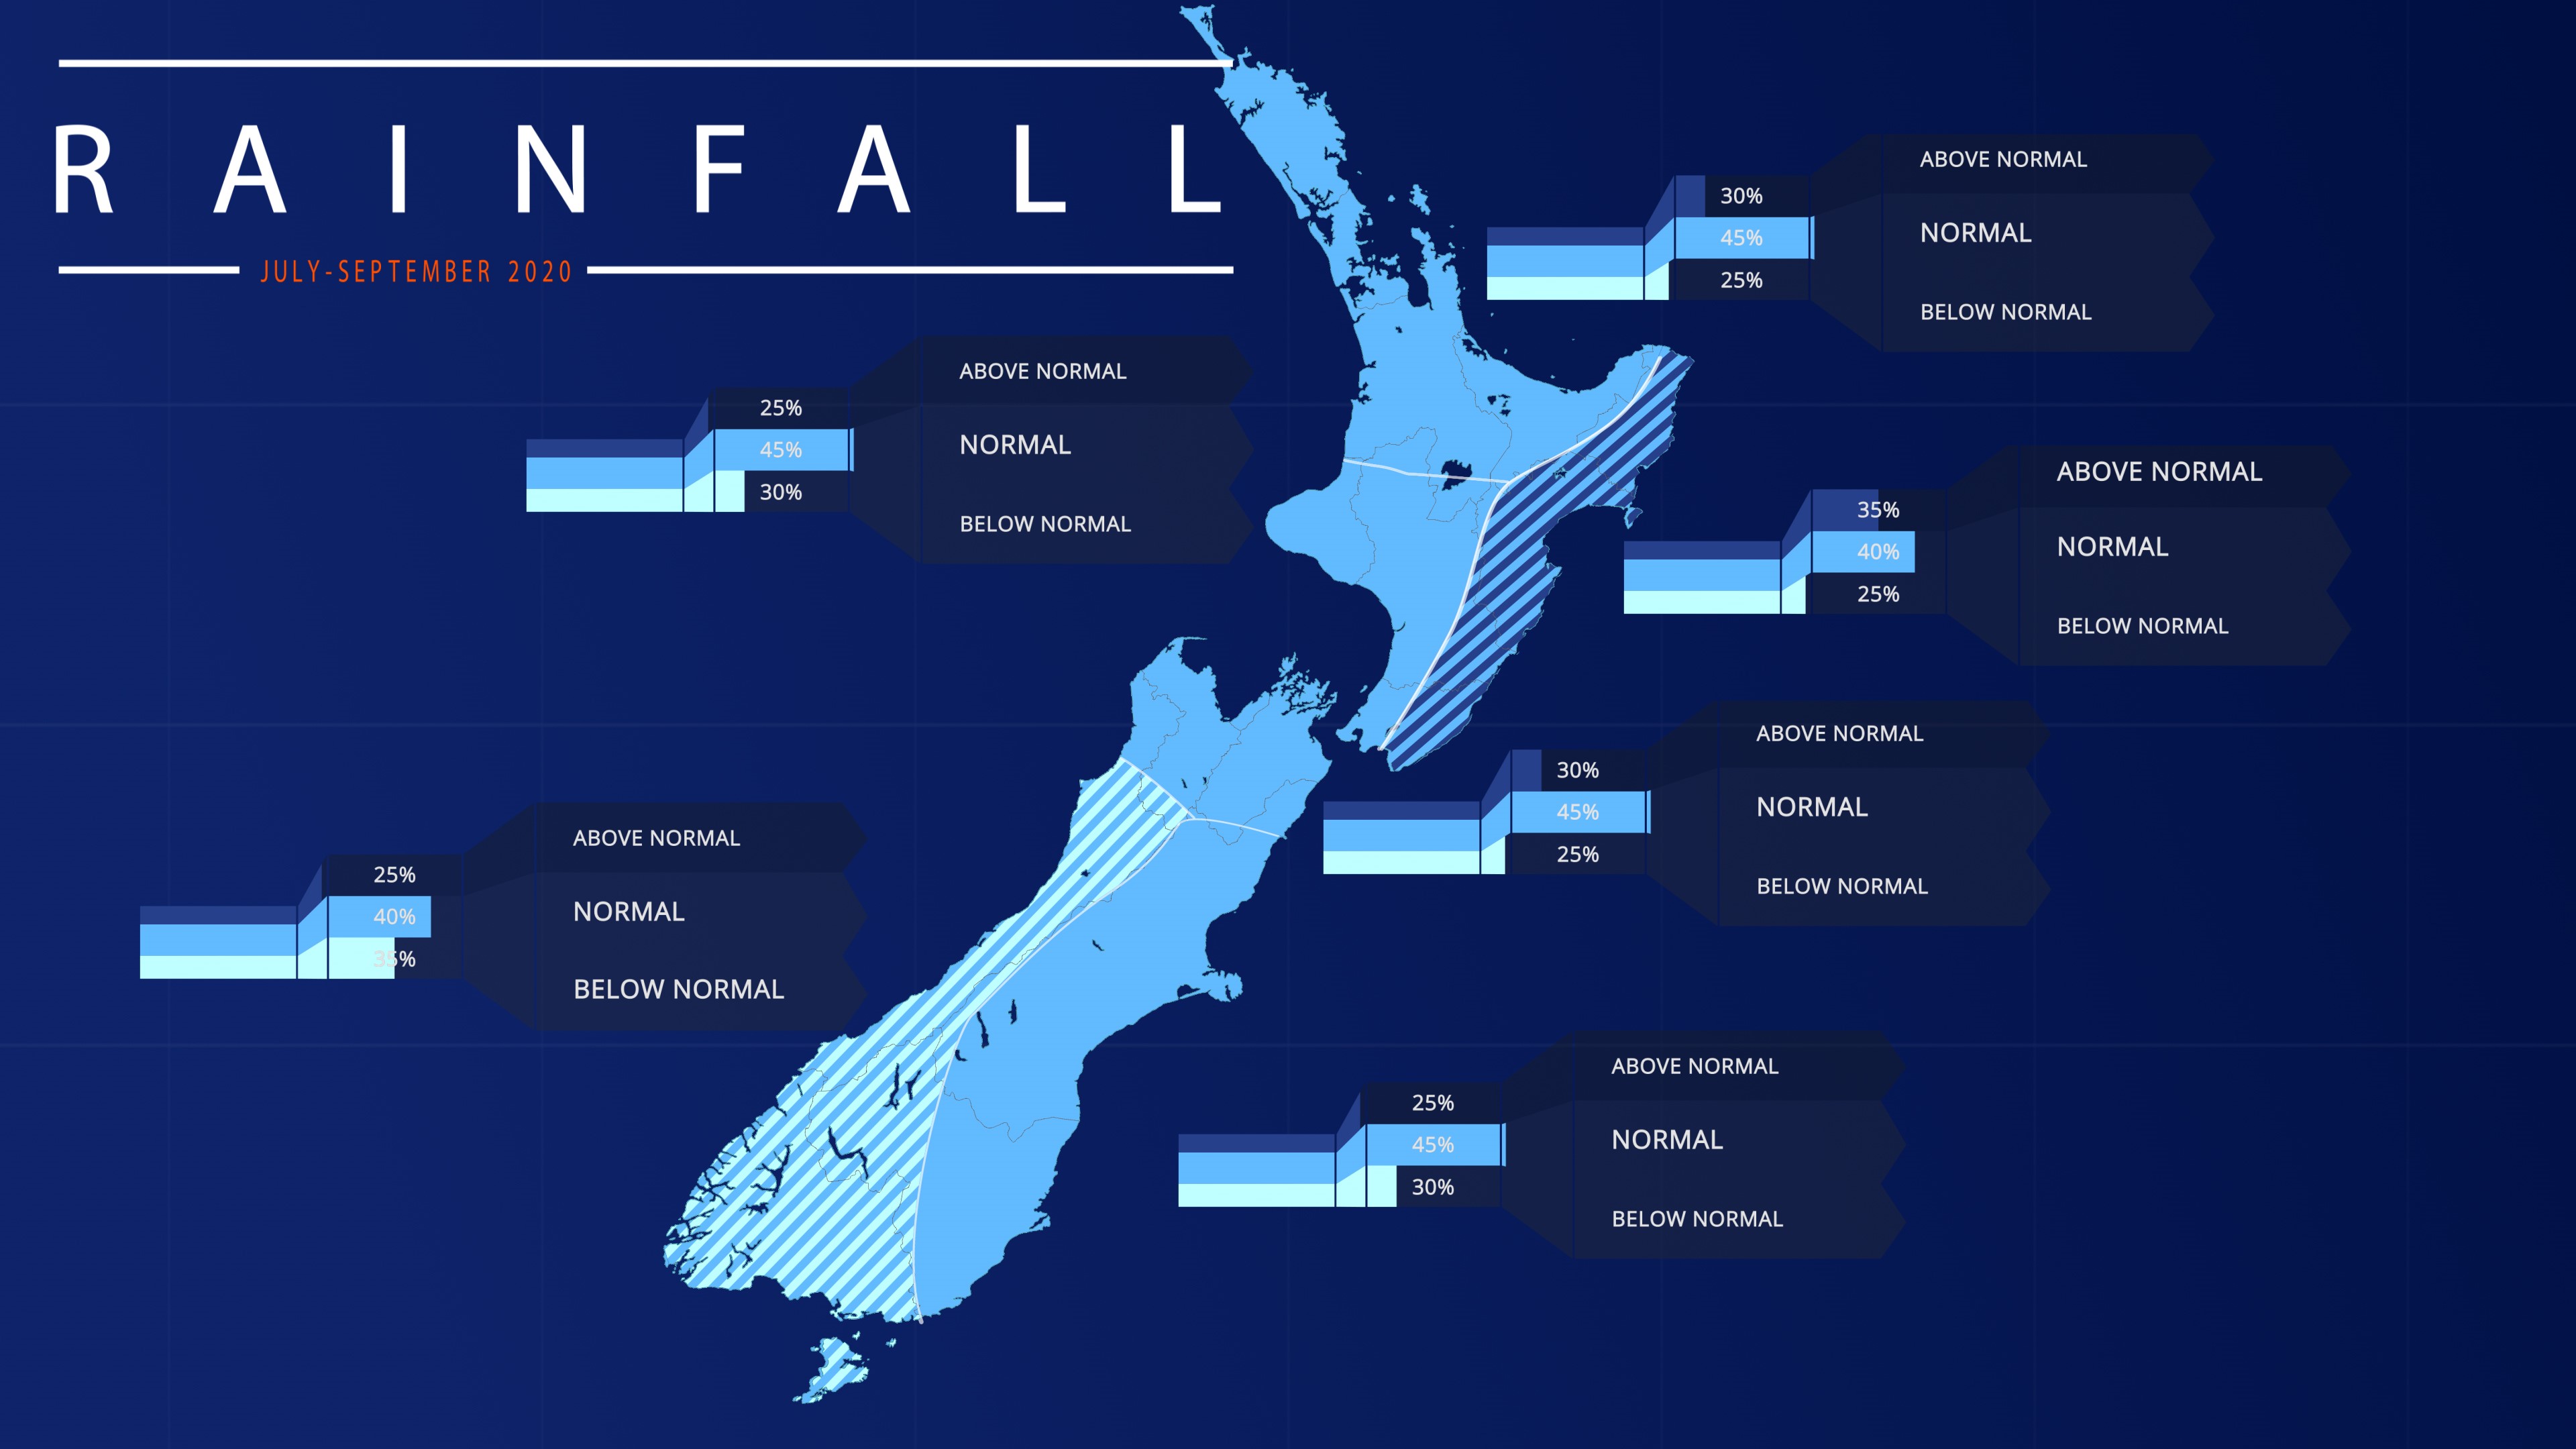
Rainfall
July – September 2020 rainfall is about equally likely to be near normal (40% chance) or below normal (35% chance) in the west of the South Island and about equally likely to be near normal (40% chance) or above normal (35% chance) in the east of the North Island. Near normal rainfall is most likely in all other regions (45% chance).
Soil Moisture
July – September 2020 soil moisture levels and river flows are about equally likely to be near normal (40% chance) or below normal (35-45% chance) in the east and west of the South Island. In the north of the South Island, soil moisture levels are equally likely to be near normal (40% chance) or below normal (40% chance) while river flows are most likely to be near normal (45% chance). All North Island regions are most likely to have near normal soil moisture levels and river flows (45% chance).
Regional predictions for July – September 2020
Northland, Auckland, Waikato, Bay of Plenty
The table below shows the probabilities (or percent chances) for each of three categories: above average, near average, and below average. In the absence of any forecast guidance there would be an equal likelihood (33% chance) of the outcome being in any one of the three categories. Forecast information from local and global guidance models is used to indicate the deviation from equal chance expected for the coming three-month period, with the following outcomes the most likely (but not certain) for this region:
- Temperatures are about equally likely to be near average (40% chance) or above average (45% chance).
- Rainfall totals are most likely to be near normal (45% chance).
- Soil moisture levels and river flows are most likely to be near normal (45% chance).
The full probability breakdown is:
|
Temperature |
Rainfall |
Soil moisture |
River flows |
|
|
Above average |
45 |
30 |
25 |
25 |
|
Near average |
40 |
45 |
45 |
45 |
|
Below average |
15 |
25 |
30 |
30 |
Central North Island, Taranaki, Whanganui, Manawatu, Wellington
Probabilities are assigned in three categories: above average, near average, and below average.
- Temperatures are about equally likely to be near average (40% chance) or above average (45% chance).
- Rainfall totals are most likely to be near normal (45% chance).
- Soil moisture levels and river flows are most likely to be near normal (45% chance).
The full probability breakdown is:
|
Temperature |
Rainfall |
Soil moisture |
River flows |
|
|
Above average |
45 |
25 |
20 |
20 |
|
Near average |
40 |
45 |
45 |
45 |
|
Below average |
15 |
30 |
35 |
35 |
Gisborne, Hawke’s Bay, Wairarapa
Probabilities are assigned in three categories: above average, near average, and below average.
- Temperatures are most likely to be above average (50% chance).
- Rainfall totals are about equally likely to be near normal (40% chance) or above normal (35% chance).
- Soil moisture levels and river flows are most likely to be near normal (45% chance).
The full probability breakdown is:
|
Temperature |
Rainfall |
Soil moisture |
River flows |
|
|
Above average |
50 |
35 |
20 |
20 |
|
Near average |
35 |
40 |
45 |
45 |
|
Below average |
15 |
25 |
35 |
35 |
Tasman, Nelson, Marlborough, Buller
Probabilities are assigned in three categories: above average, near average, and below average.
- Temperatures are equally likely to be near average (40% chance) or above average (45% chance).
- Rainfall totals are most likely to be near normal (45% chance).
- Soil moisture levels are about equally likely to be near normal (40% chance) or below normal (40% chance). River flows are most likely to be near normal (45% chance).
The full probability breakdown is:
|
Temperature |
Rainfall |
Soil moisture |
River flows |
|
|
Above average |
45 |
30 |
20 |
20 |
|
Near average |
40 |
45 |
40 |
45 |
|
Below average |
15 |
25 |
40 |
35 |
West Coast, Alps and foothills, inland Otago, Southland
Probabilities are assigned in three categories: above average, near average, and below average.
- Temperatures are equally likely to be near average (40% chance) or above average (40% chance).
- Rainfall totals are about equally likely to be near normal (40% chance) or below normal (35% chance).
- Soil moisture levels and river flows are about equally likely to be near normal (40% chance) or below normal (45% chance).
The full probability breakdown is:
|
Temperature |
Rainfall |
Soil moisture |
River flows |
|
|
Above average |
40 |
25 |
15 |
15 |
|
Near average |
40 |
40 |
40 |
40 |
|
Below average |
20 |
35 |
45 |
45 |
Coastal Canterbury, east Otago
Probabilities are assigned in three categories: above average, near average, and below average.
- Temperatures are equally likely to be near average (40% chance) or above average (45% chance).
- Rainfall totals are most likely to be near normal (45% chance).
- Soil moisture levels and river flows are about equally likely to be near normal (40% chance) or below normal (35-40% chance).
The full probability breakdown is:
|
Temperature |
Rainfall |
Soil moisture |
River flows |
|
|
Above average |
45 |
25 |
25 |
20 |
|
Near average |
40 |
45 |
40 |
40 |
|
Below average |
15 |
30 |
35 |
40 |
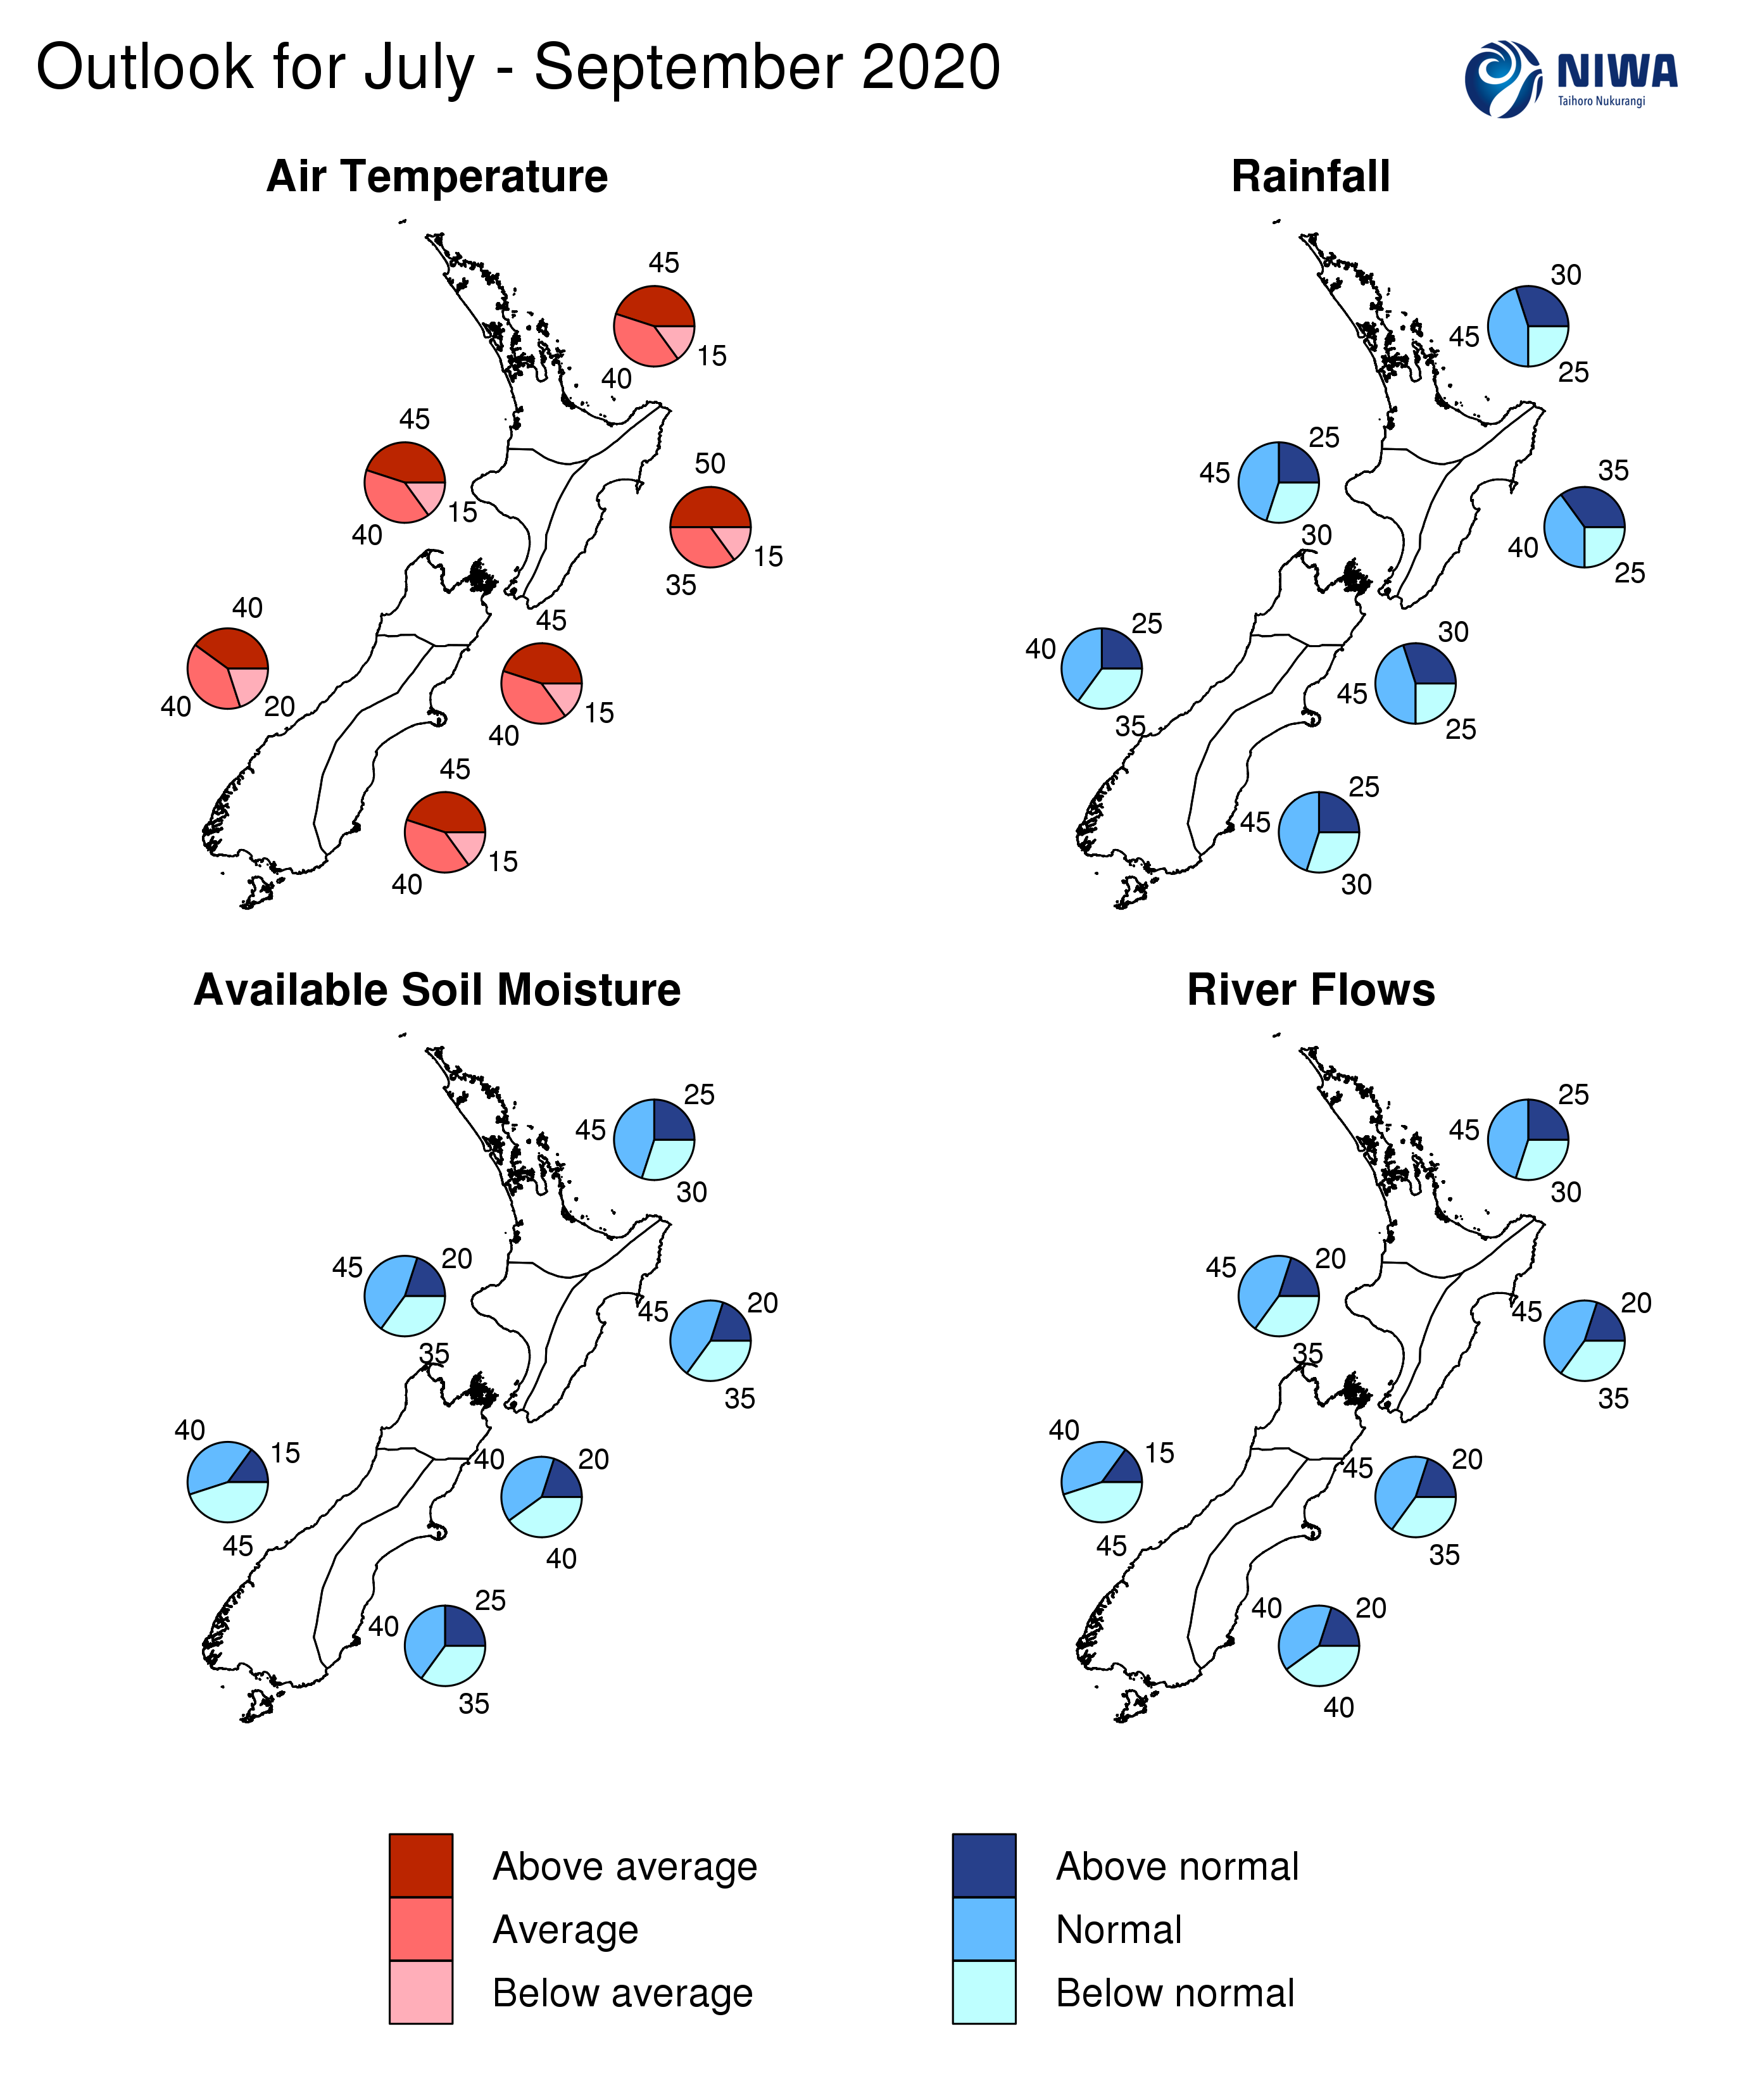
Graphical representation of the regional probabilities
Background
The NINO3.4 Index anomaly (in the central Pacific) for June 2020 (to the 28th) was -0.12˚C; the April to June trend was -0.66˚C. The NINO 1+2 Index decreased to -0.57˚C while the NINO4 region remained slightly warmer than average at +0.30˚C.
Upper-oceanic heat content again decreased notably across the east-central equatorial Pacific during June. In the subsurface ocean, cooler than average conditions pushed eastward with widespread anomalies of -0.5 to -2.0˚C. Meanwhile, warmth increased slightly at depth in the western Pacific. At this stage, the anomalies are consistent with developing canonical oceanic La Niña conditions.
Trade winds during June were stronger than normal in the east-central Pacific. This is expected to continue over the next three months and should lead to additional cooling in the ocean.
According to the consensus from international models, La Niña (47% chance) and ENSO-neutral (51% chance) are about equally likely for the July-September period. Compared to last month’s outlook, the odds for La Niña have increased notably.
On average, La Niña is associated with more northeasterly winds in New Zealand and wetter conditions in the north and east but drier conditions in the south and west.
During June, New Zealand’s coastal water temperature anomalies increased in all six climate regions. Above average ocean temperatures will likely modify colder air masses as they move toward New Zealand from the Southern Ocean.
New Zealand Coastal Sea Surface Temperatures during June 2020 (to the 29th):
|
North NI |
West NI |
East NI |
North SI |
West SI |
East SI |
|
+0.50˚C |
+0.50˚C |
+0.32˚C |
+0.48˚C |
+0.72˚C |
+0.66˚C |
The Southern Annular Mode (SAM) was strongly positive for the first three weeks of June before becoming negative. The SAM is forecast to remain negative in early July and will be associated with several rounds of unsettled weather.
The Madden-Julian Oscillation (MJO) was convectively active over the eastern hemisphere during June, with anomalous rising motion centred over Africa and the western Indian Ocean and sinking motion across the tropical Pacific.
During the next 1-2 months, the MJO will likely be most active over Africa and the western Indian Ocean and occasionally active over the Maritime Continent, north of Australia. The latter is consistent with an atmosphere system that is transitioning toward La Niña.
For New Zealand, during periods of the aforementioned activity over the Maritime Continent, chances for moist, subtropical northeasterly winds (similar to those experienced in late June) will increase. Otherwise, westerly quarter winds are expected to prevail, like what is forecast during the first half of July.
Over the next three months, global climate drivers are expected to continue to transition away from the pattern that caused widespread very dry conditions at the start of 2020.
Forecast Confidence
Temperature
|
Forecast confidence for temperature is medium to high. There is widespread model agreement that a colder than average end to winter and start to spring is unlikely. Near coastal sea surface temperatures increased during June and should modify colder air masses as they emerge from the south. |
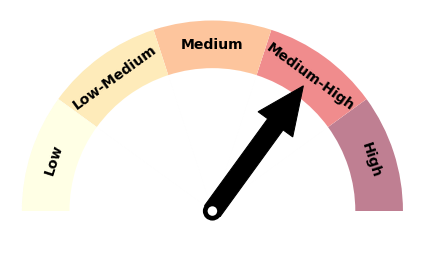
Rainfall
|
Forecast confidence for rainfall is low to medium. Spread in climate model guidance for rainfall during this three-month period is likely partially attributable to the potential emergence (or lack thereof) of La Niña conditions. La Niña, should it develop, would represent a transition away from the climate drivers that caused widespread very dry conditions at the start of 2020. |