Outlook Summary
- El Niño continued during October and will likely intensify over the next three months. It has around a 100% chance of persisting during this time. There’s an 80% chance of El Niño continuing through autumn, maintaining an important influence on Aotearoa New Zealand’s climate.
- Air pressure is forecast to be above normal near New Zealand, especially the North Island, and lower than normal to the south of the country.
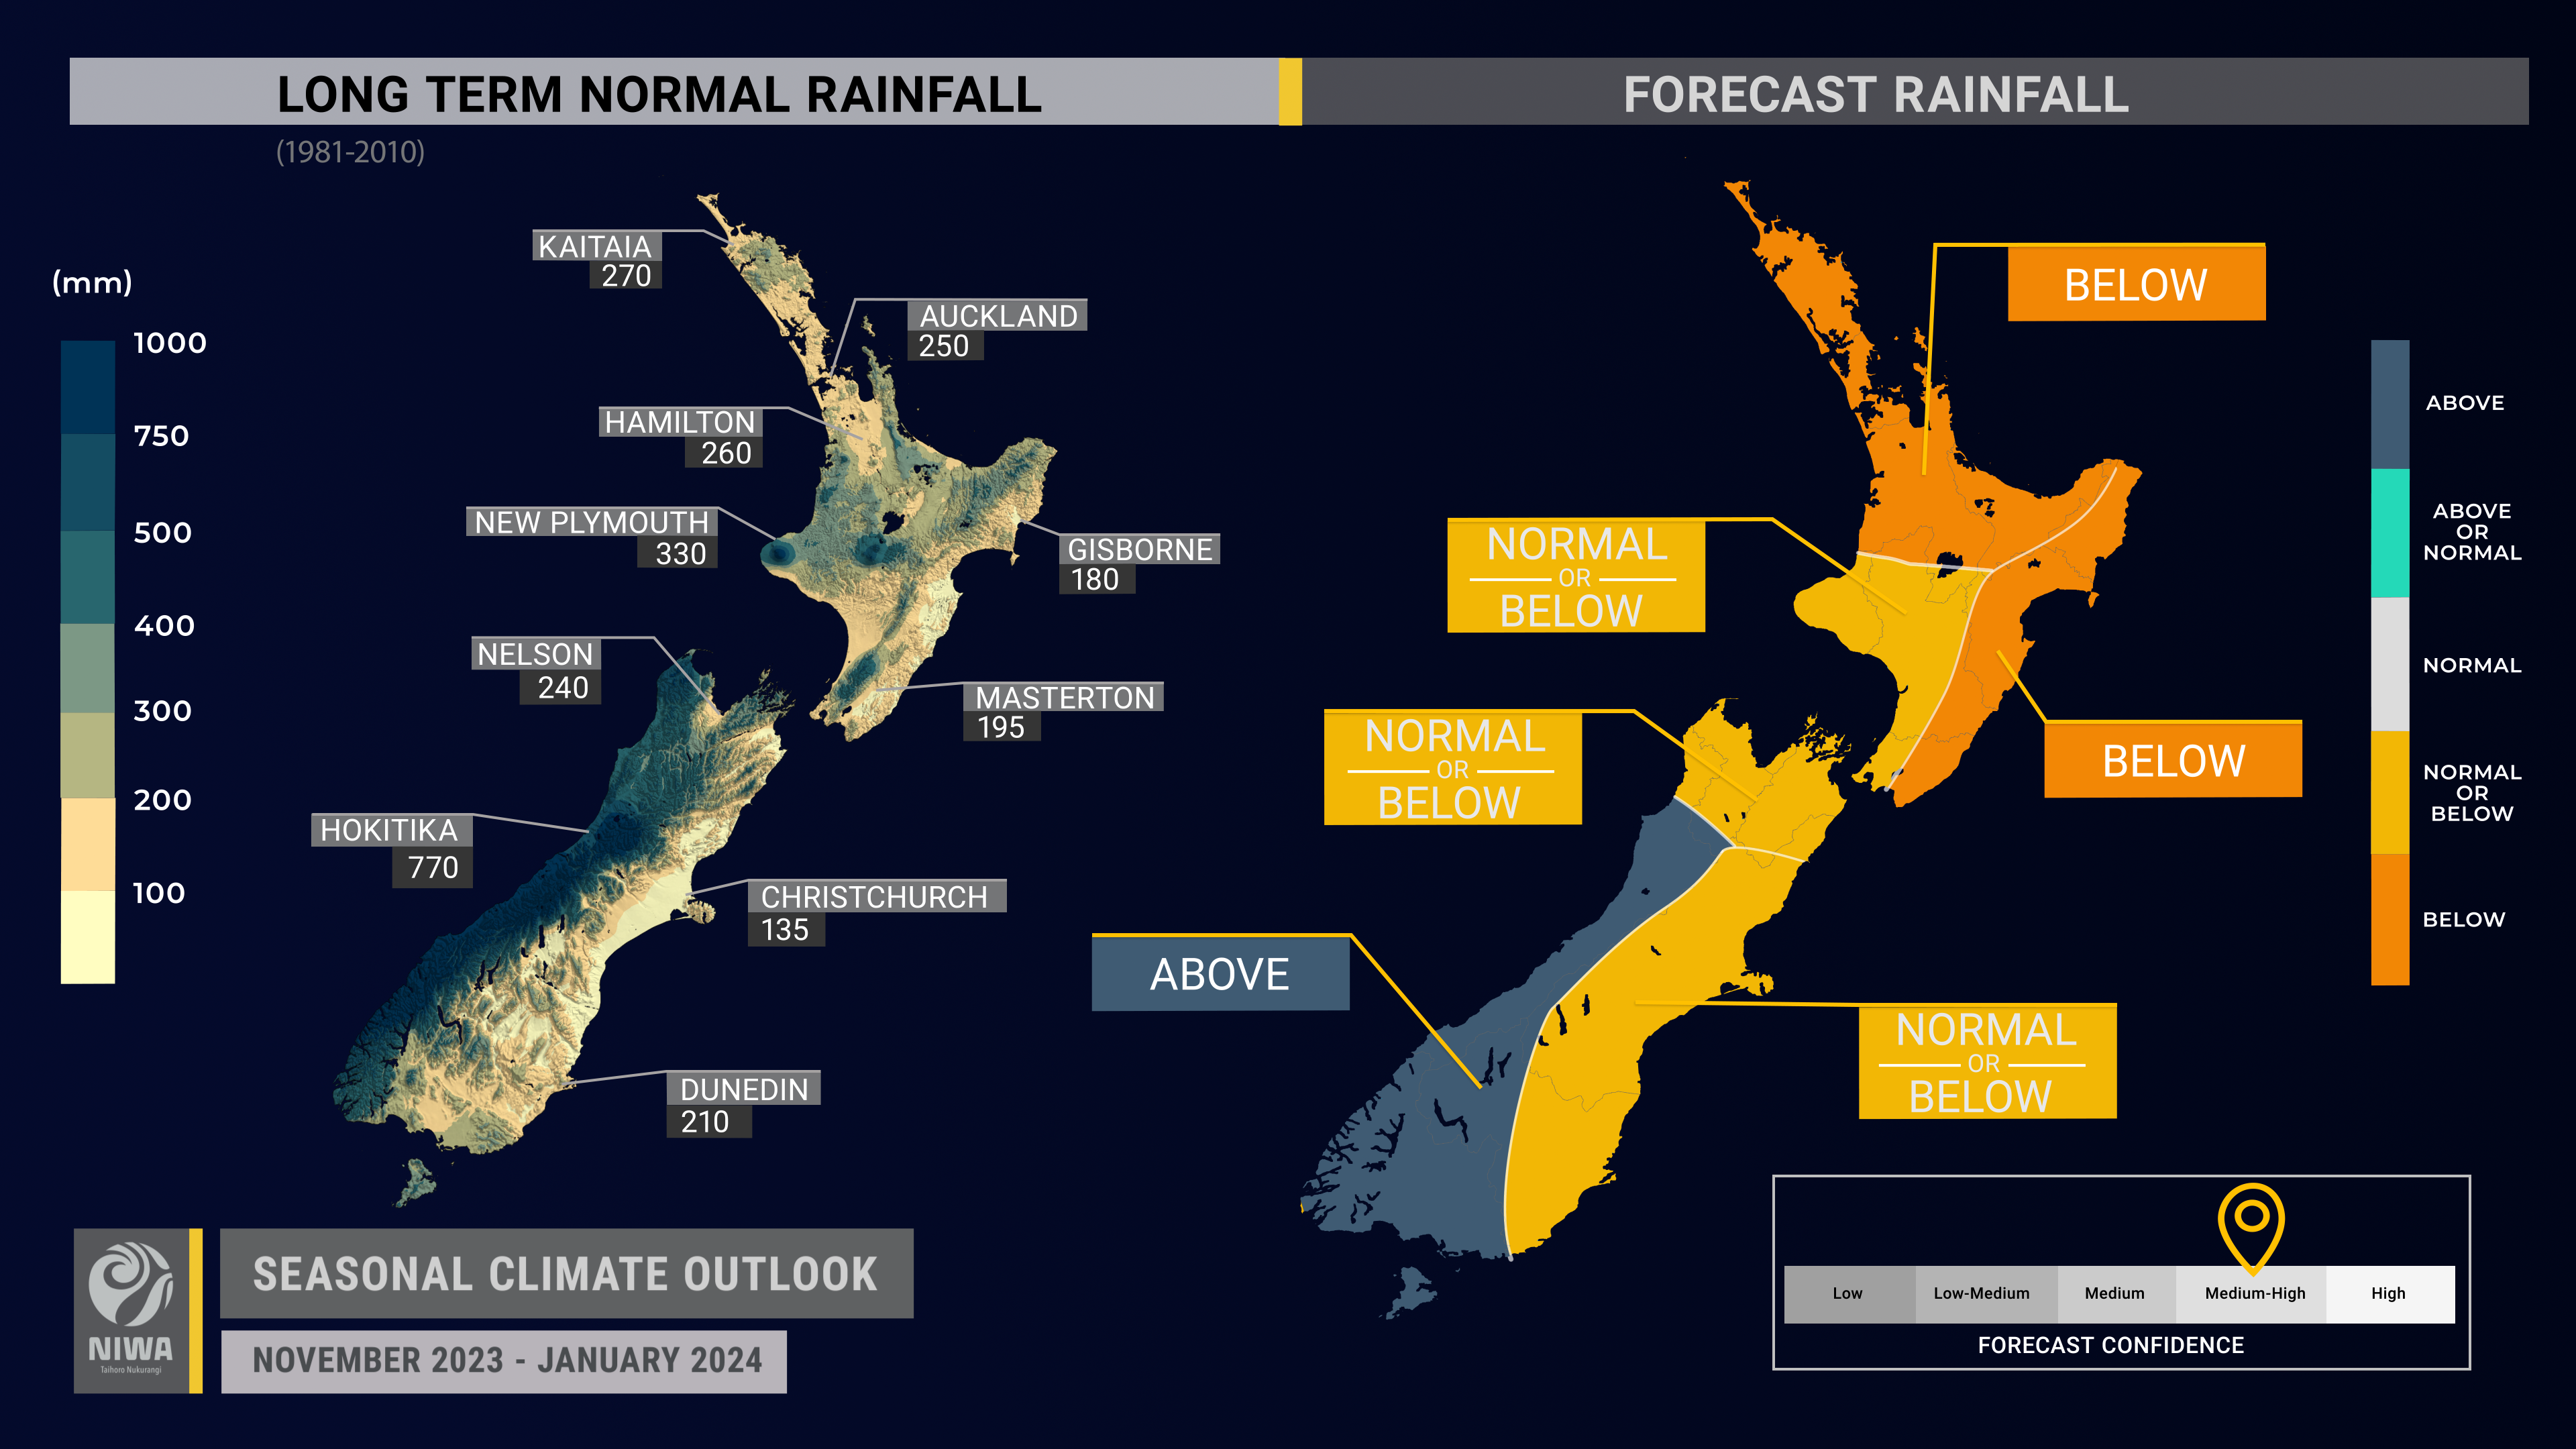
- Rainfall is most likely to be below normal in the north and east of the North Island and above normal in the west of the South Island. Rainfall is about equally likely to be near normal or below normal in all other regions. Prolonged dry spells are possible in several regions.
- Strong lows will occasionally impact the western and lower South Island, delivering heavy rainfall and a risk for flooding. The first half of November, however, looks drier than normal.
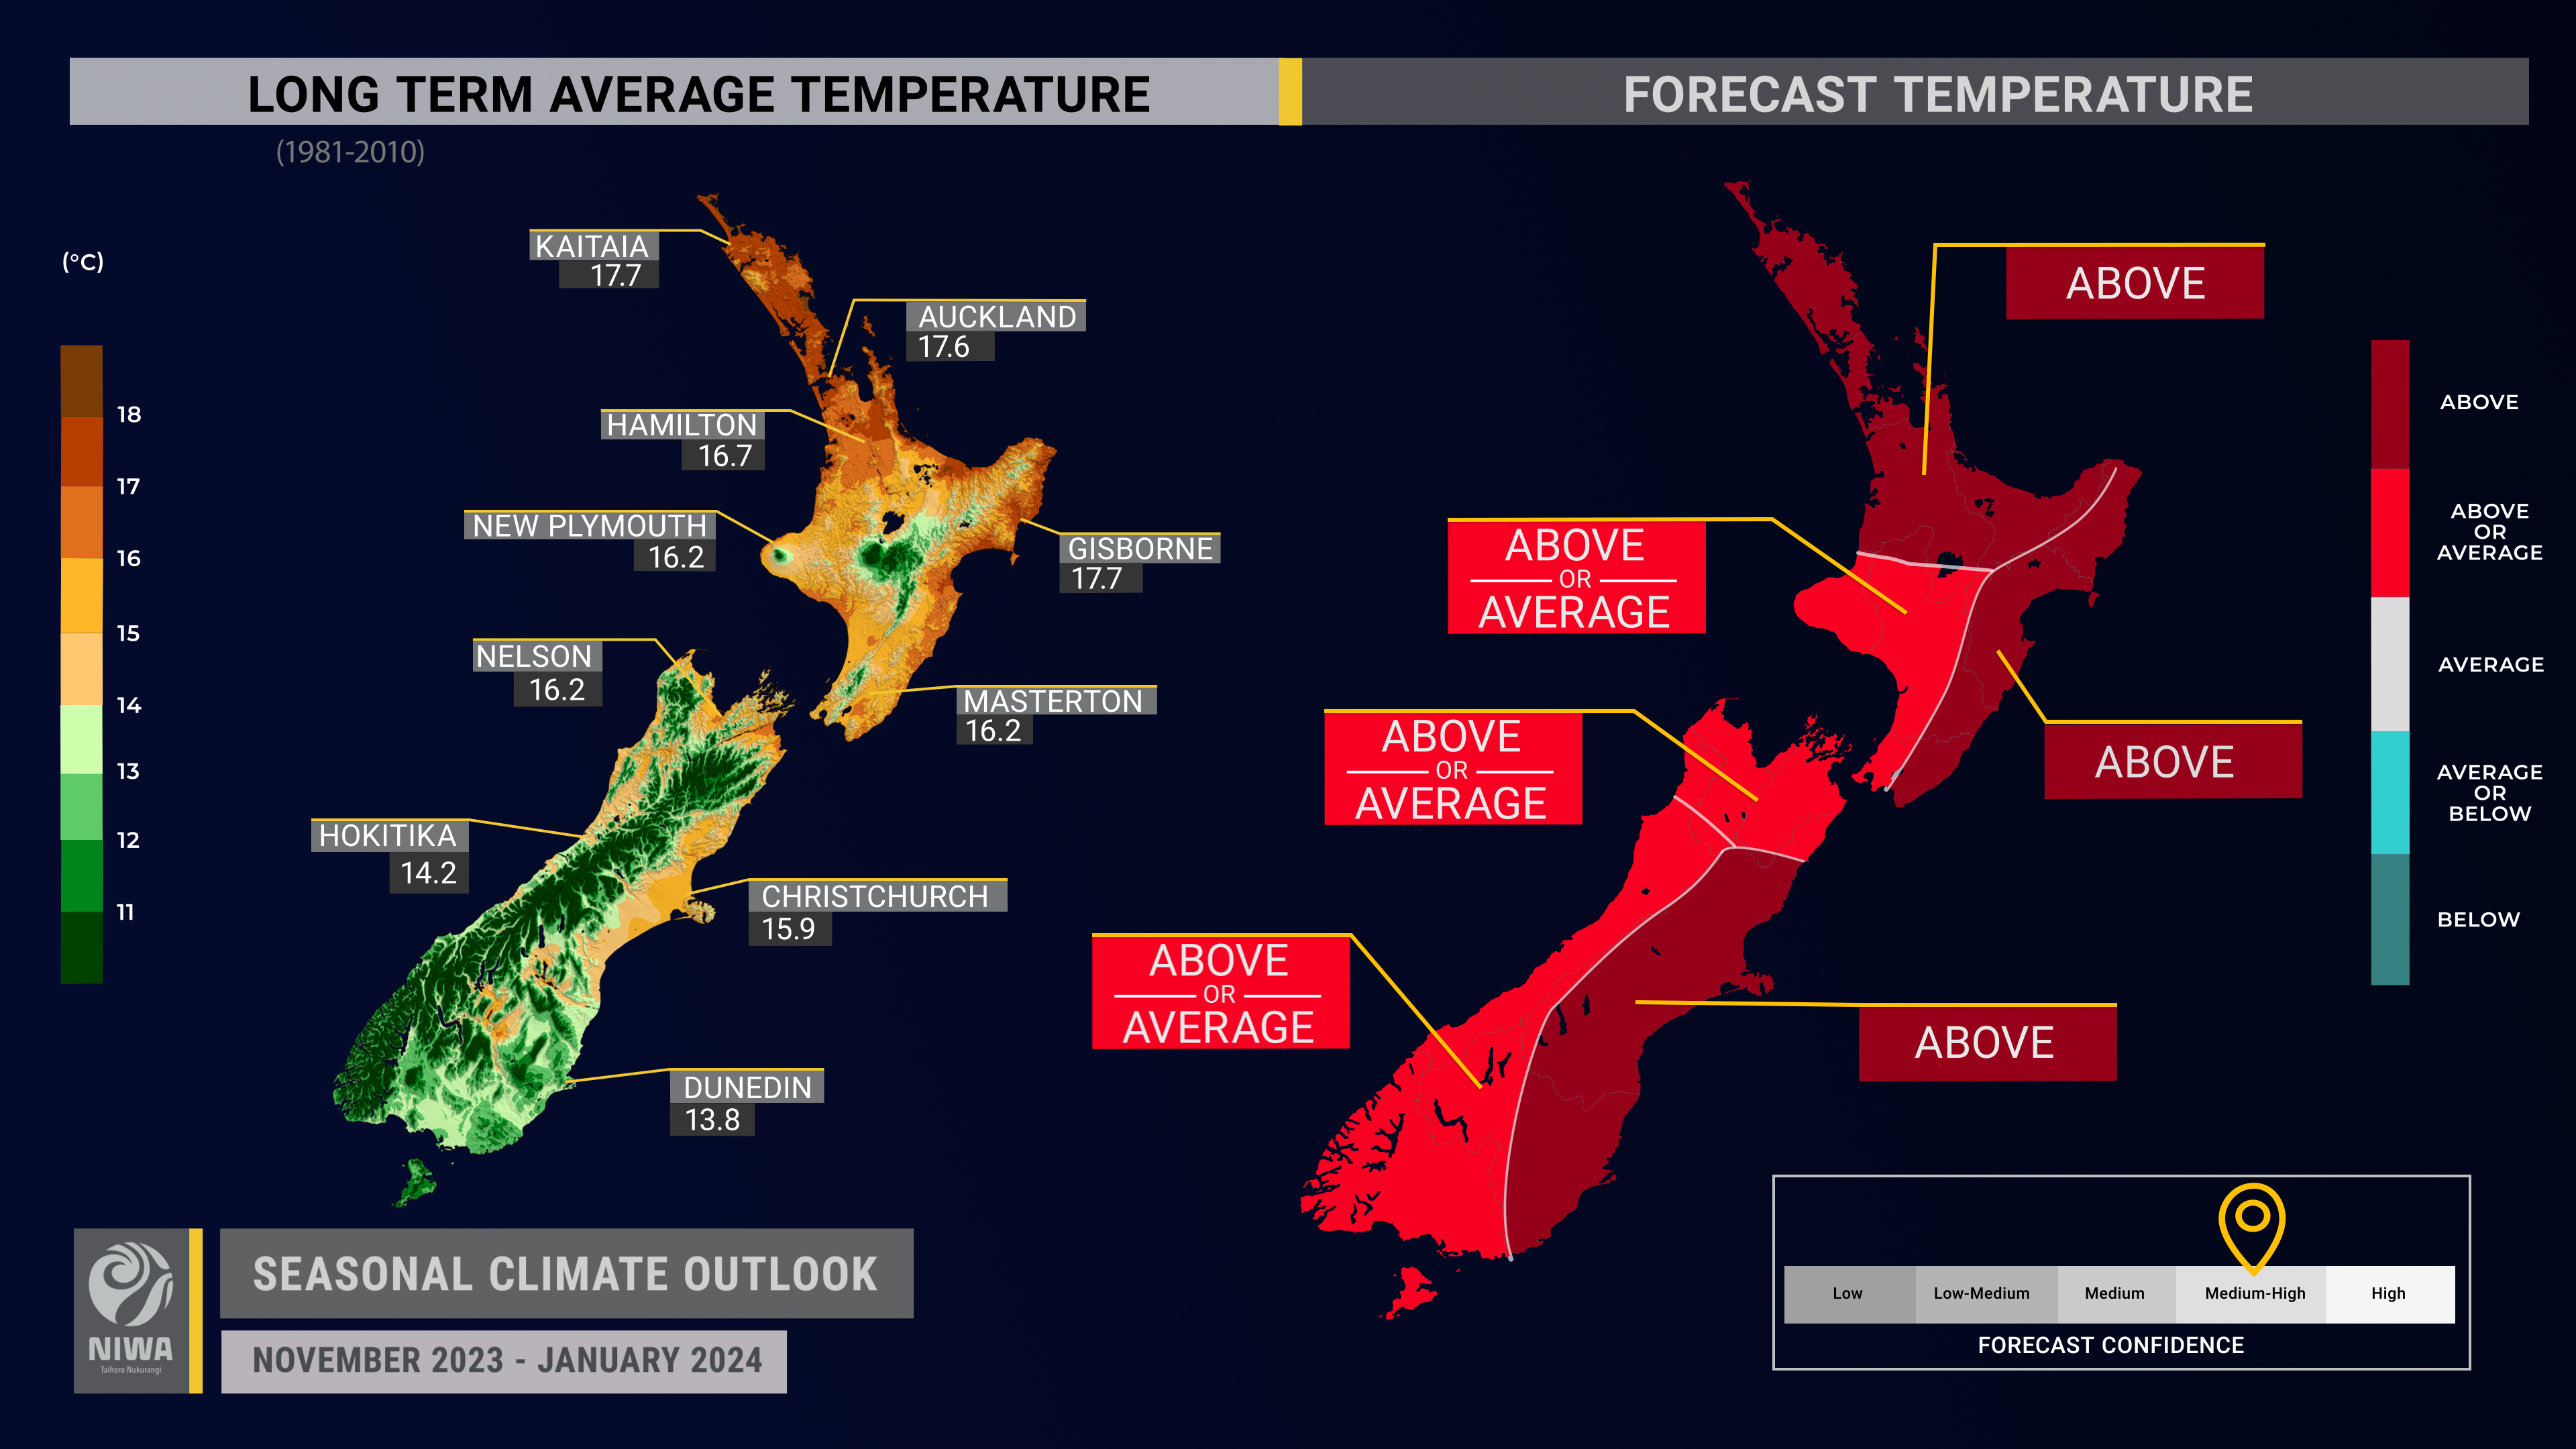
- Temperatures are most likely to be above average in the east of both islands and the north of the North Island. Temperatures are about equally likely to be near average or above average in all other regions. A hot spell looks likely during the second half of November.
- Seasonal wind strength is forecast to be above normal across most of the country because of a stronger than normal pressure gradient (difference in pressure over distance) near New Zealand. This will come with a higher than normal risk for periods of damaging winds.
- Coastal sea surface temperatures (SSTs) ranged from 0.35˚C to 0.64˚C above average during October. Localised marine heatwaves may form in northern and eastern coastal areas in the months ahead.
- Soil moisture and river flows are most likely to be near normal in the west of the South Island and about equally likely to be near normal or below normal in all other regions.
- As of late October, fire danger was low across the country. Despite this, normal or above normal wildfire activity is expected to eventuate, particularly in northern and eastern areas of both islands during periods of hot, windy weather. For more info: www.checkitsalright.nz.
Regional predictions for November 2023 – January 2024
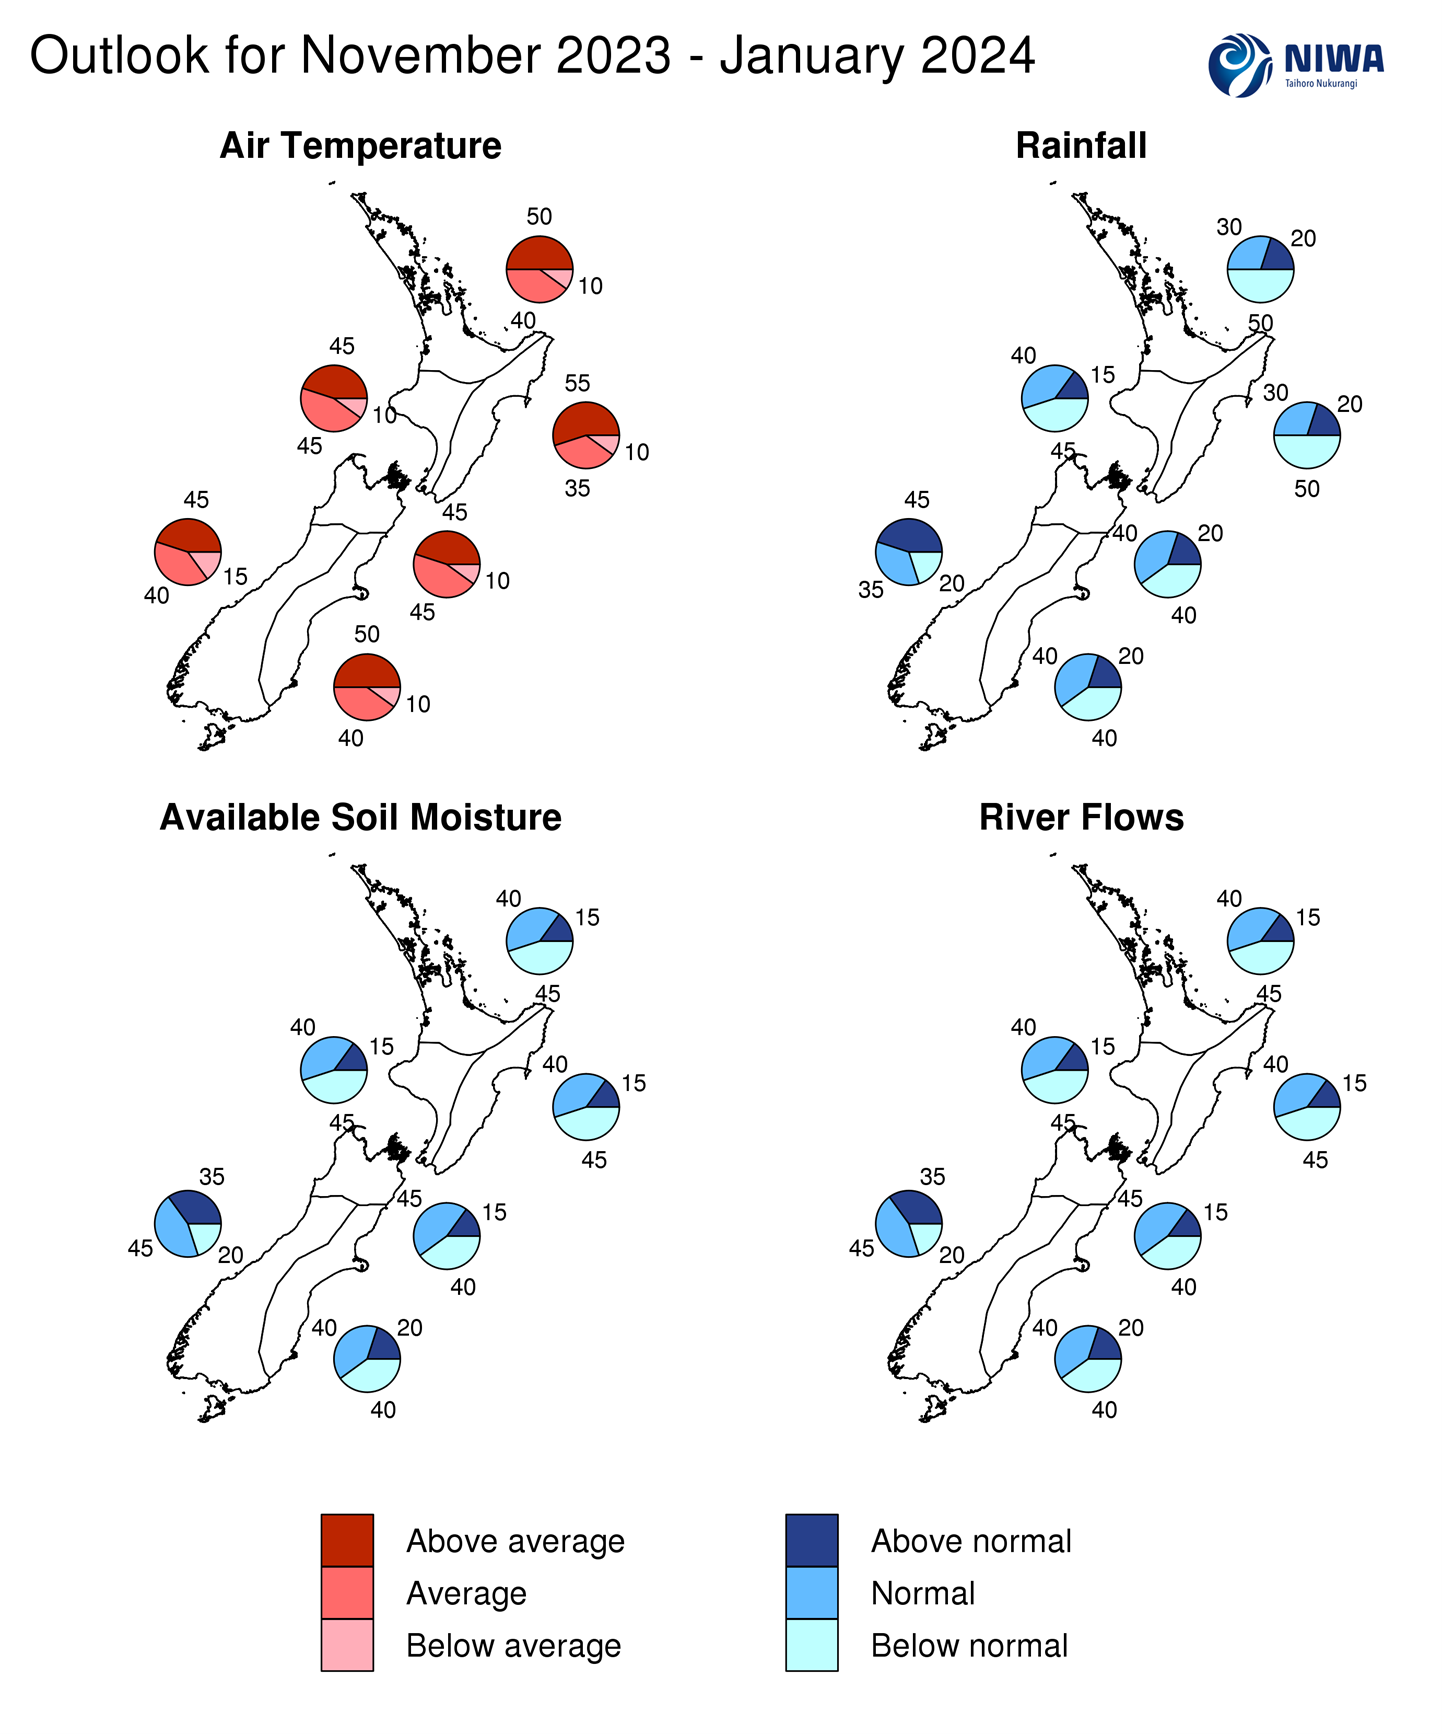
The tables below show the probabilities (or percent chances) for each of three categories: above average, near average, and below average. In the absence of any forecast guidance there would be an equal likelihood (33% chance) of the outcome for any of the three categories. Forecast information from local and global guidance models is used to indicate the deviation from equal chance that is expected for the coming three-month period. All outlooks are for the three months as a whole. There will inevitably be relatively wet and dry days, and hot and cold days, within a season. The exact range in temperature and rainfall within each of the three categories varies with location and season. However, as a guide, the “near average” or middle category for the temperature predictions includes deviations up to ±0.5°C for the long-term mean, whereas for rainfall the “near normal” category lies between 80 per cent and 120 per cent of the long-term mean.
Northland, Auckland, Waikato, Bay of Plenty
- Temperatures are most likely to be above average (50% chance). A spell of well above average temperatures is possible during the second half of November.
- Rainfall totals are most likely to be below normal (50% chance). An increased frequency of high pressure systems near the region will likely lead to longer dry spells.
- Seasonal wind speeds are expected to be stronger than normal.
- Soil moisture levels and river flows are about equally likely to be below normal (45% chance) or near normal (40% chance).
|
Temperature |
Rainfall |
Soil moisture |
River flows |
|
|
Above average |
50 |
20 |
15 |
15 |
|
Near average |
40 |
30 |
40 |
40 |
|
Below average |
10 |
50 |
45 |
45 |
Central North Island, Taranaki, Whanganui, Manawatu, Wellington
Probabilities are assigned in three categories: above average, near average, and below average.
- Temperatures are equally likely to be near average or above average (45% chance each). The second half of November will likely have spells of hotter-than-average conditions.
- Rainfall totals are about equally likely to be below normal (45% chance) or near normal (40% chance).
- Seasonal wind speeds are expected to be stronger than normal.
- Soil moisture levels and river flows are about equally likely to be below normal (45% chance) or near normal (40% chance).
|
Temperature |
Rainfall |
Soil moisture |
River flows |
|
|
Above average |
45 |
15 |
15 |
15 |
|
Near average |
45 |
40 |
40 |
40 |
|
Below average |
10 |
45 |
45 |
45 |
Gisborne, Hawke’s Bay, Wairarapa
Probabilities are assigned in three categories: above average, near average, and below average.
- Temperatures are most likely to be above average (55% chance). Frequent west-to-northwest winds will likely lead to a higher frequency of hot days (>25˚C), such as in the second half of November.
- Rainfall totals are most likely to be below normal (50% chance). An increased frequency of west-to-northwest winds will likely lead to longer dry spells.
- Seasonal wind speeds are expected to be stronger than normal.
- Soil moisture levels and river flows are about equally likely to be below normal (45% chance) or near normal (40% chance).
|
Temperature |
Rainfall |
Soil moisture |
River flows |
|
|
Above average |
55 |
20 |
15 |
15 |
|
Near average |
35 |
30 |
40 |
40 |
|
Below average |
10 |
50 |
45 |
45 |
Tasman, Nelson, Marlborough, Buller
Probabilities are assigned in three categories: above average, near average, and below average.
- Temperatures are equally likely to be above average or near average (45% chance each). The second half of November will likely have spells of hotter-than-average conditions.
- Rainfall totals are equally likely to be below normal (40% chance) or near normal (40% chance). An increased frequency of west-to-northwest winds will likely lead to longer dry spells about Nelson and Marlborough.
- Seasonal wind speeds are expected to be stronger than normal.
- Soil moisture levels and river flows are about equally likely to be near normal (45% chance) or below normal (40% chance).
|
Temperature |
Rainfall |
Soil moisture |
River flows |
|
|
Above average |
45 |
20 |
15 |
15 |
|
Near average |
45 |
40 |
45 |
45 |
|
Below average |
10 |
40 |
40 |
40 |
West Coast, Southern Alps and foothills, inland Otago, Southland
Probabilities are assigned in three categories: above average, near average, and below average.
- Temperatures are about equally likely to be above average (45% chance) or near average (40% chance).
- Rainfall totals are most likely to be above normal (45% chance). Strong fronts will occasionally impact the region, delivering heavy rainfall and a risk for flooding.
- Seasonal wind speeds are expected to be stronger than normal.
- Soil moisture levels and river flows are most likely to be near normal (45% chance).
|
Temperature |
Rainfall |
Soil moisture |
River flows |
|
|
Above average |
45 |
45 |
35 |
35 |
|
Near average |
40 |
35 |
45 |
45 |
|
Below average |
15 |
20 |
20 |
20 |
Coastal Canterbury and the nearby plains, east Otago
Probabilities are assigned in three categories: above average, near average, and below average.
- Temperatures are most likely to be above average (50% chance). Frequent west-to-northwest winds will likely lead to a higher frequency of hot days (>25˚C), such as in the second half of November.
- Rainfall totals are equally likely to be below normal (40% chance) or near normal (40% chance). An increased frequency of west-to-northwest winds will likely lead to longer dry spells, particularly in middle and northern Canterbury.
- For inland and southern Canterbury and east Otago, periodic wetter than normal conditions may occur when rain bands may “spill over” the main divide.
- Seasonal wind speeds are expected to be stronger than normal.
- Soil moisture levels and river flows are equally likely to be near normal (40% chance) or below normal (40% chance).
The full probability breakdown is:
|
Temperature |
Rainfall |
Soil moisture |
River flows |
|
|
Above average |
50 |
20 |
20 |
20 |
|
Near average |
40 |
40 |
40 |
40 |
|
Below average |
10 |
40 |
40 |
40 |
Graphical representation of the regional probabilities
Background
The NINO3.4 Index (which covers the west-central equatorial Pacific) over the last month (through 31 October) was +1.60˚C (climatology: 1991-2020), within the range of a strong El Niño (classified when the NINO3.4 Index is greater than +1.5˚C). The October 2023 NINO3.4 Index is exceeded by 2015, 1997, and 1982, with data back to 1981. The October NINO1.2 Index value (eastern equatorial Pacific) of +2.38˚C is exceeded only by 1997. From an oceanic perspective, this El Niño continues to rank with the most significant events in recent decades.
The Southern Oscillation Index (SOI) was near the El Niño threshold during August-October (-0.9), but neutral (-0.4) during October (climatology: 1991 – 2020).
Of the models monitored by NIWA, there’s around a 100% chance of El Niño continuing through January 2024 and an 80% chance that the event persists through autumn 2024.
In the subsurface equatorial Pacific, temperature anomalies of +3˚C to +6˚C were occurring in the upper 100 metres in the east as of late October. A new area of anomalies greater than +3˚C developed in the west-central equatorial Pacific during the month, in response to a downwelling oceanic Kelvin Wave. This will transfer ocean heat eastward on the time horizon of the next 1-2 months. This lends credence to the models that suggest a peak El Niño strength in December 2023 or January 2024.
Trade wind strength was below normal or well below normal in the Pacific during October, particularly just north of the equator. In parts of the region, this qualified as a Westerly Wind Burst (WWB). This WWB will likely be responsible for the eastward propagation of warm sea water along the equator through the end of the year. Another meaningful reduction or reversal in trade winds is forecast for mid-to-late November.
In the Indian Ocean, a strongly positive Indian Ocean Dipole (IOD) event is occurring. In its positive phase, the IOD corresponds to cooler than average seas in the eastern tropical Indian Ocean. The positive IOD event will likely be associated with a strong area of sinking motion over the wider Australasia region into early 2024, seeing high pressure systems commonly migrate from Australia toward northern New Zealand. This pattern is expected to have a strong influence on regional moisture availability and suppress the chance for atmospheric rivers and ex-tropical cyclones in New Zealand. This positive IOD event has strong similarities with the late 2019 event and may reach peak intensity during November.
During October, convective forcing was focused in the western and central Pacific Ocean. Significantly suppressed convection occurred in the eastern Indian Ocean and western Maritime Continent. The signal was dominated by low frequency forcing associated with the IOD and El Niño. A convective pulse in the western Pacific during mid-to-late October helped to spawn the first tropical cyclone of the season in the South Pacific, named Lola. Lola intensified into a category 5, the first cyclone of such strength during the month of October since reliable records began in 1969-70.
The low frequency forcing associated with El Niño and the IOD is expected to be a dominant driver of climatic variability in the season ahead. For New Zealand, this will likely lend itself to weather patterns that are aligned with El Niño expectations for extended periods of time, including frequent westerly wind flows and drier than normal conditions in the north and east, especially in the North Island.
For November, this looks to be associated with a large swathe of higher than normal air pressure around New Zealand, particularly the North Island.
A remnant area of warmer than average seas near the International Date Line in the equatorial Pacific will occasionally impose weather patterns that are different to what would normally occur during a typical El Niño, such as what happened with the remnants of Tropical Cyclone Lola in late October. Such periods of variability have low predictability on a seasonal scale and weather-related impacts are tied to the prevailing pressure pattern occurring near New Zealand and the Tasman Sea around the time of occurrence.
For New Zealand, these climate drivers will favour high pressure near and north of the North Island and low pressure to the south of the South Island. The associated pressure gradient (difference in air pressure) is expected to drive stronger than normal and frequent westerly quarter winds and occasionally intense lows and fronts into the western and lower South Island. More frequent high pressure to the north of the country will also reduce, but not eliminate, the chance for strong atmospheric rivers and ex-tropical cyclones.
Seasonal wind strength is predicted to be above normal across the country. This means there will be a higher than normal risk for damaging winds. These winds will also bring warm-to-hot and dry air from Australia at times, culminating in spells of well above average temperatures, particularly in eastern areas of both islands. Such a pattern looks likely in the second half of November.
The Southern Annular Mode (SAM) was variable during October. A forecast for higher than normal air pressure in the New Zealand region during November should lead to a predominantly positive SAM.
New Zealand’s coastal water temperatures were generally near average or slightly above average for the time of year during October. Localised marine heatwaves were occurring along the northern and eastern coastal fringes of both islands. In the months ahead, the expectation for stronger winds, in association with a fully developed El Niño, means that the risk for the development of widespread marine heatwave conditions in New Zealand’s coastal waters is low; however, during periods of unusually warm conditions, localised-to-regional marine heatwaves may continue or develop, particularly near the north and east of both islands. For more information, see the NIWA Sea Surface Temperature Update.
NZ 30-day coastal SST anomalies (to 31 October)
|
North NI |
+0.44˚C |
|
West NI |
+0.39˚C |
|
East NI |
+0.64˚C |
|
North SI |
+0.35˚C |
|
West SI |
+0.22˚C |
|
East SI |
+0.60˚C |
Forecast Confidence
Temperature
Forecast confidence for temperatures is medium-high. Compared to last month’s guidance, the seasonal modelling indicates a higher chance for northwesterly winds at times in the season ahead. This will see warm-to-hot air masses migrate from Australia to New Zealand. Compared to last month, the temperature tercile outlooks have been nudged slightly toward a warmer outcome.
Rainfall
Forecast confidence for rainfall is medium-high. A combination of strong climate drivers, El Niño and the Indian Ocean Dipole, during the period which their influence is near-peak, lends itself to above average confidence in rainfall patterns. However, a remnant patch of warmer than average ocean water near the International Date Line could produce variability that occasionally goes against the grain of El Niño (e.g., Cyclone Lola in late October).