Outlook Summary
- Ocean temperatures in the equatorial Pacific continue to run cooler than average in the east and central. Over the next three months, oceanic La Niña conditions and ENSO-neutral conditions are about equally likely (45-50% chance).
- NIWA, along with other international agencies, continue with a “La Niña watch”. A La Niña watch is issued when tropical trade winds are stronger than normal and ocean waters become unusually cool in the equatorial Pacific. There is an expectation for these conditions to continue for at least the next several months.
- August – October 2020 air pressure is forecast to be higher than normal around New Zealand. Lower than normal air pressure is forecast to the southeast of the country. Although westerly quarter air flow anomalies are expected for the season as a whole, the potential development of La Niña can influence periodic northeasterly quarter winds throughout the season.
- During periods of northeasterly winds, the threat for sub-tropical low pressure systems capable of producing heavy rainfall, similar to those experienced in late June and mid-July, is elevated, particularly in the north and east of the North Island.
- Cold snaps and frosts can be expected in typically colder locations through the three-month period, especially during the first half of the season.
Air temperature
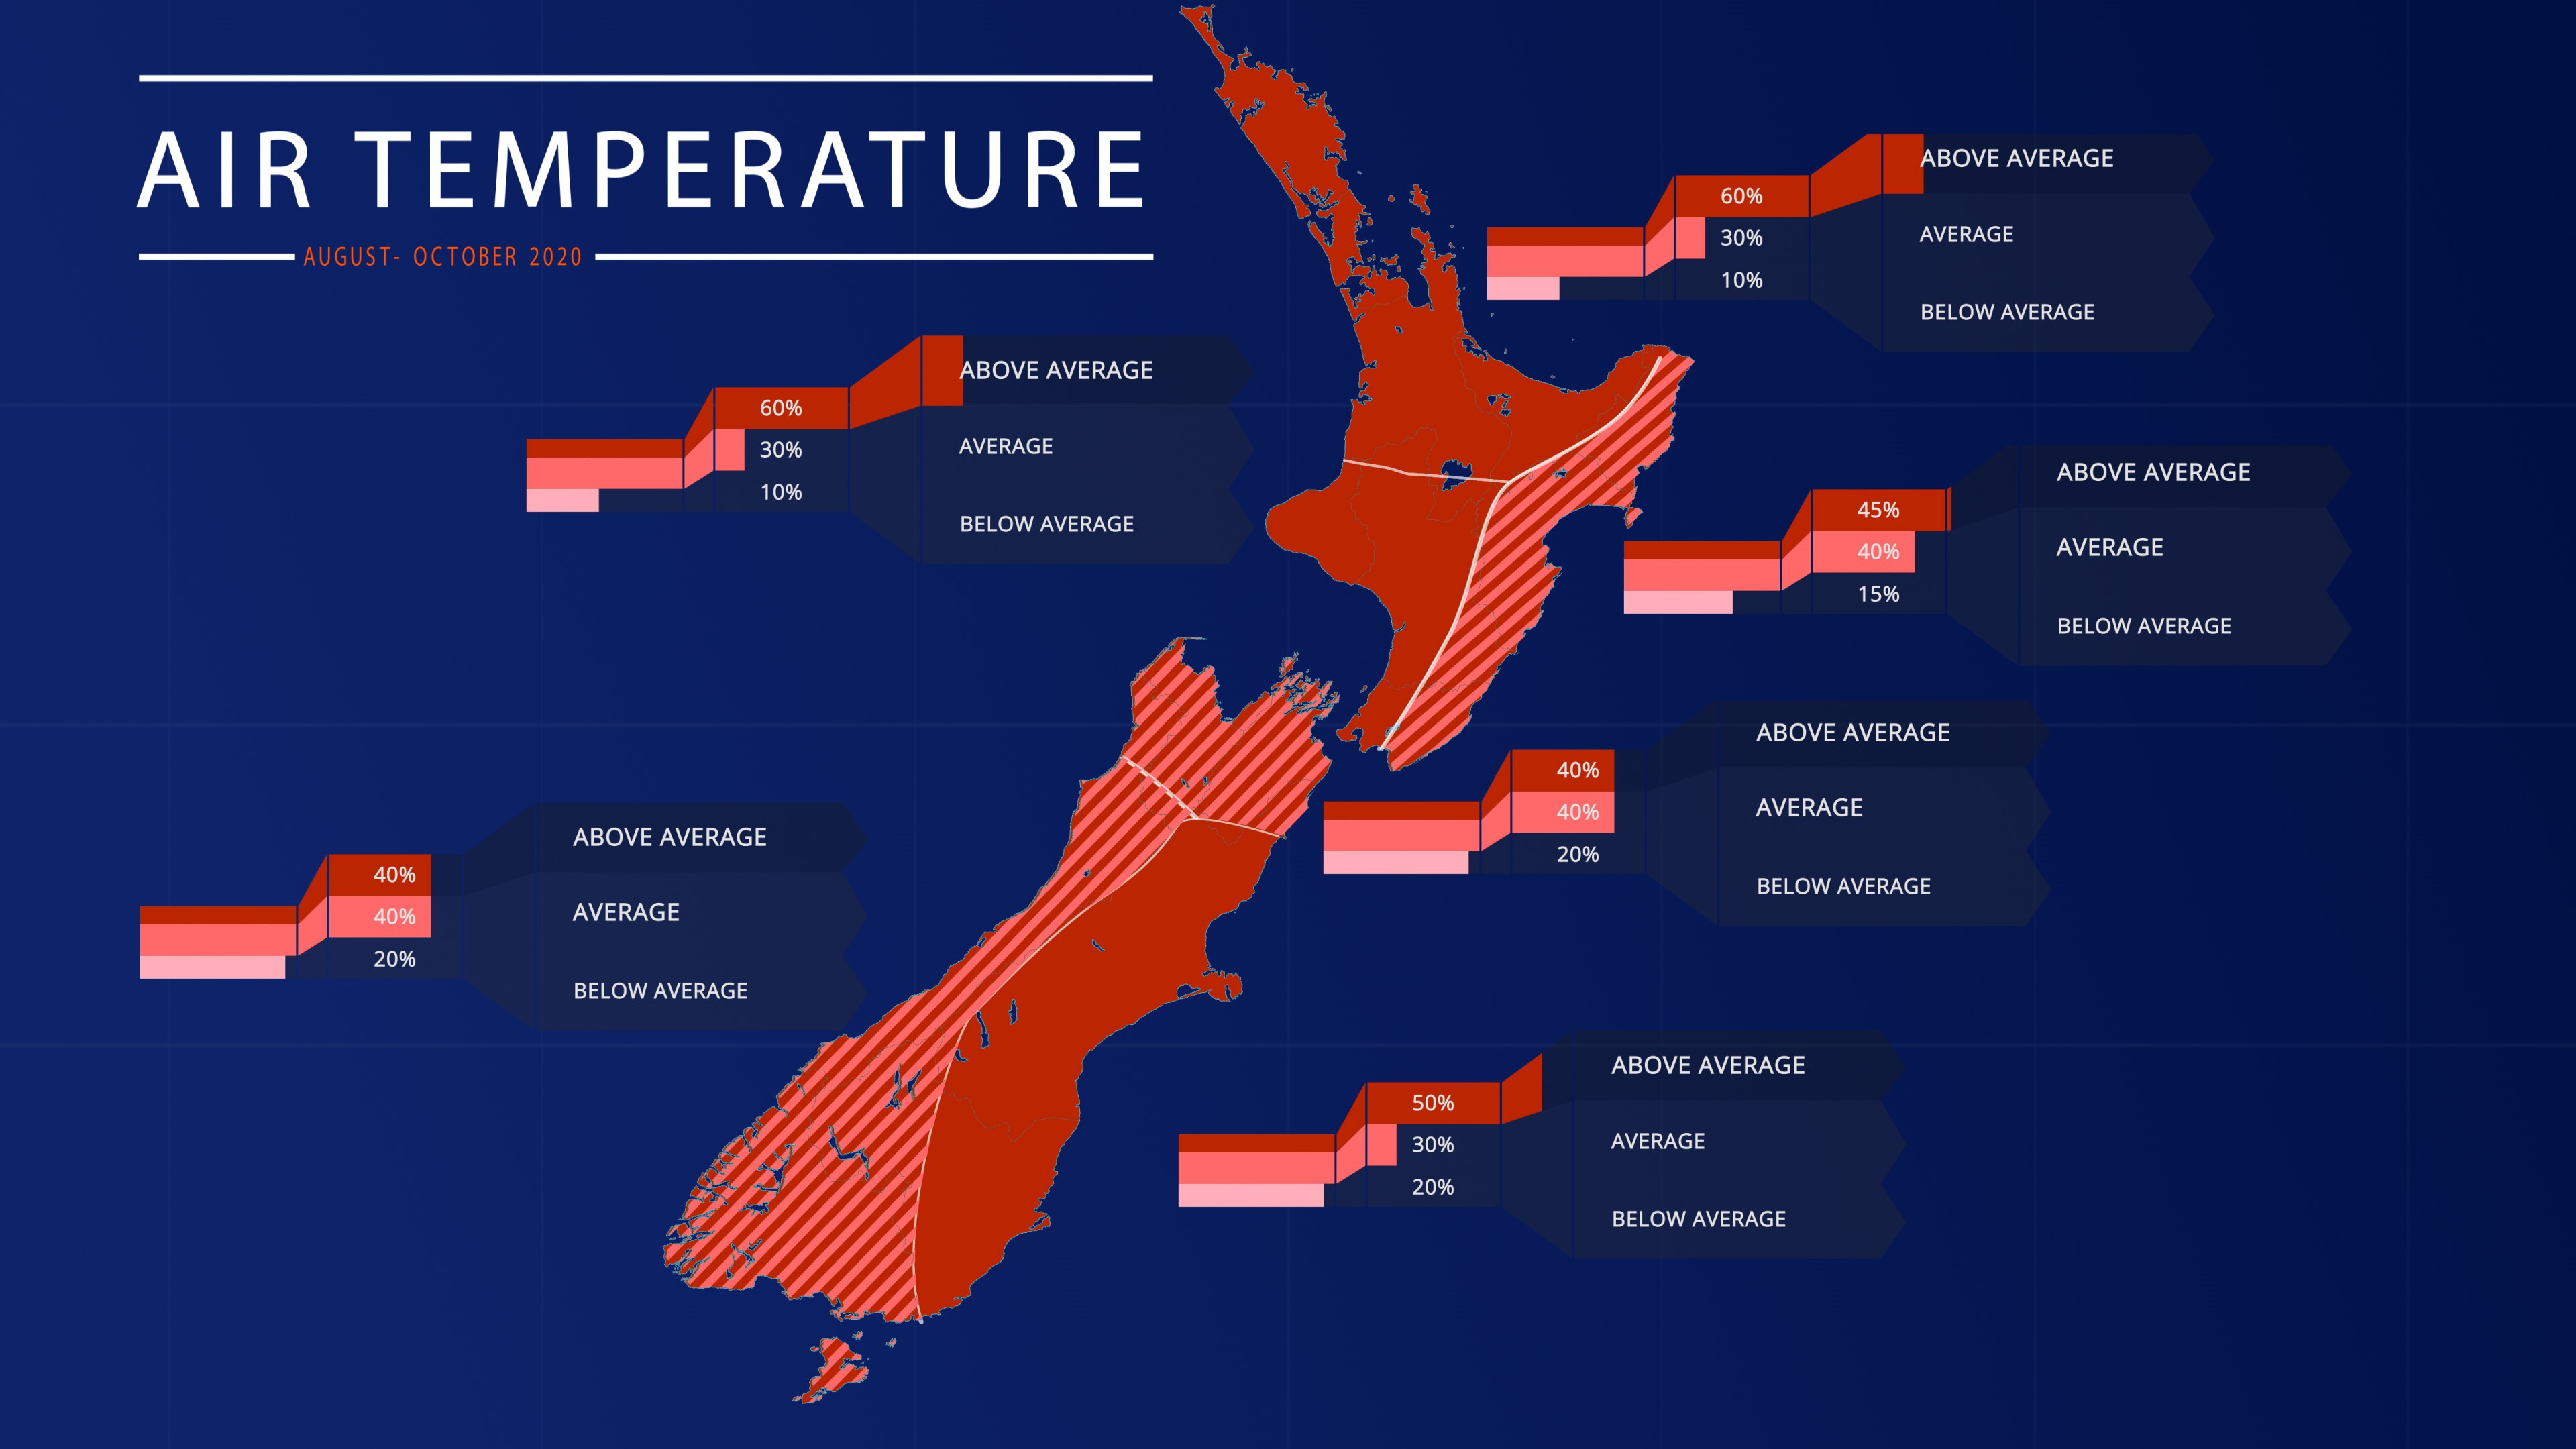
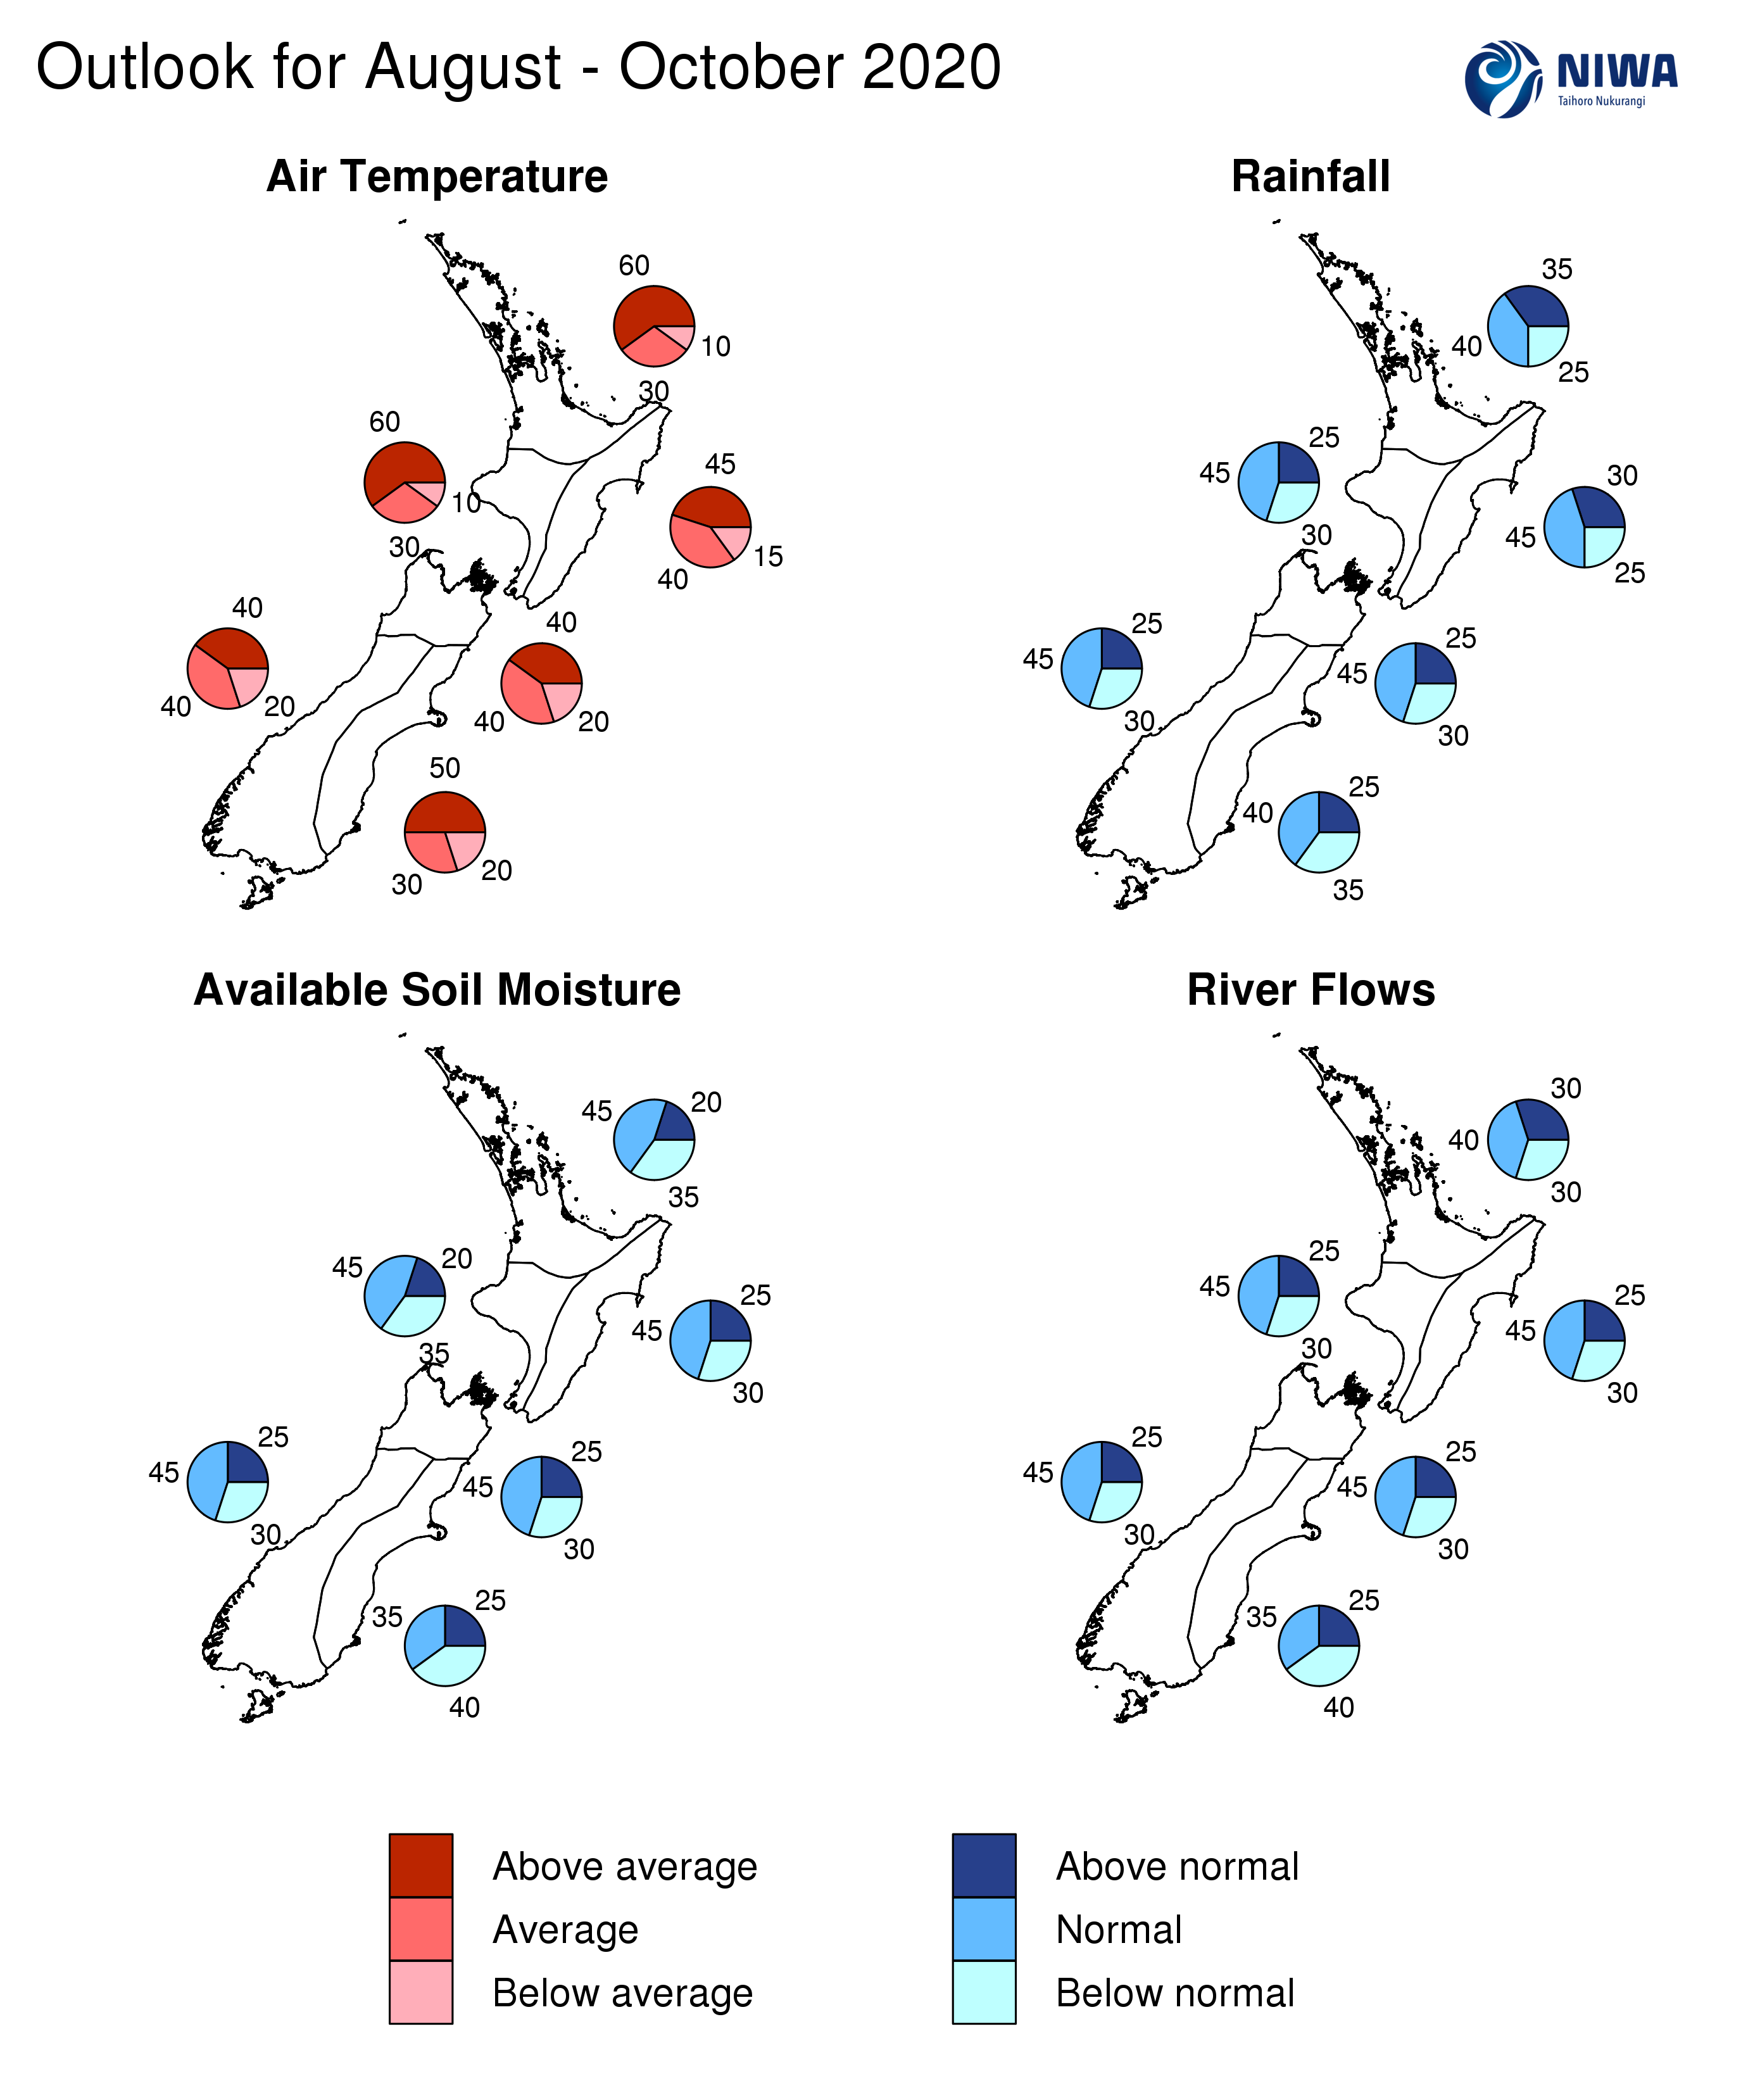
August – October 2020 air temperatures are about equally likely to be near average (40% chance) or above average (40-45% chance) in the east of the North Island as well as the north and west of the South Island. Above average temperatures (50% chance) are likely for the east of the South Island and are very likely (60% chance) for the north and west of the North Island.
Rainfall
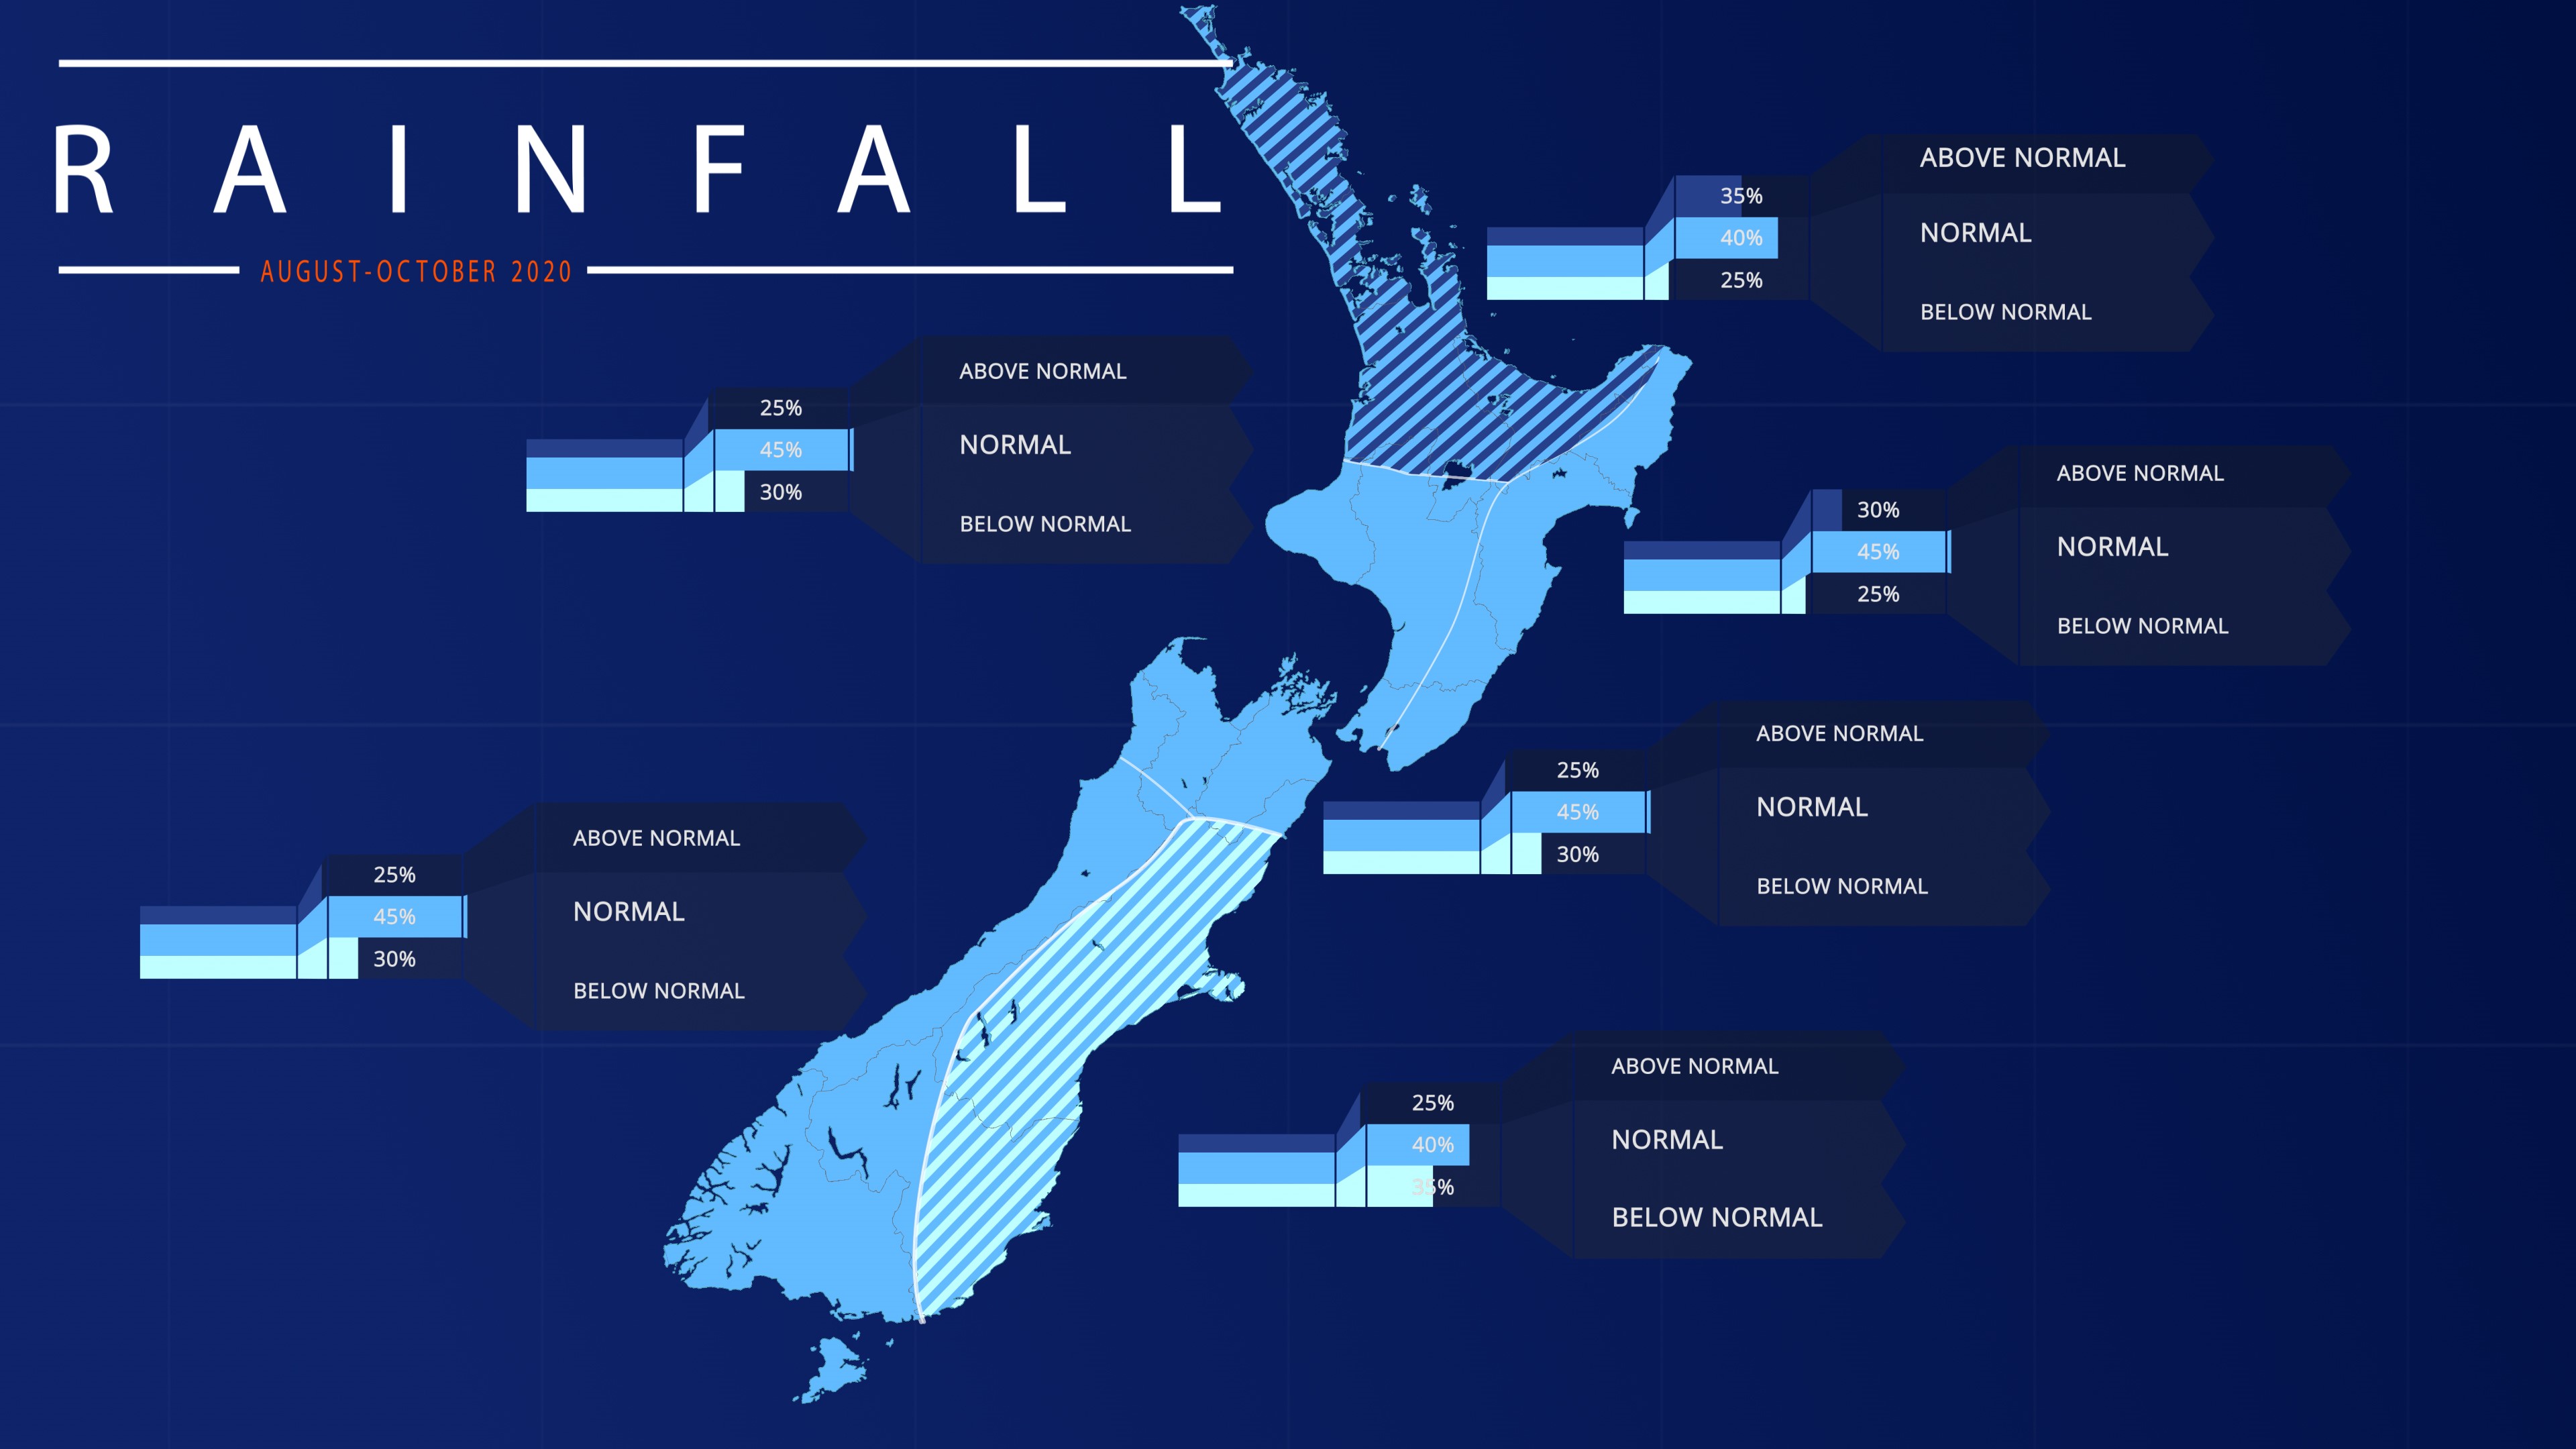
August – October 2020 rainfall is most likely to be near normal (45% chance) for the west and east of the North Island as well as the north and west of the South Island. Rainfall is about equally likely to be near normal (40% chance) or below normal (35% chance) in the east of the South Island. For the north of the North Island, rainfall is about equally likely to be near normal (40% chance) or above normal (35%) chance. Seasonal rainfall in the north of the North Island may be variable, with areas more exposed to northeasterly winds (e.g. Northland, Coromandel Peninsula) more likely to see above normal rainfall totals.
Soil moisture
August – October 2020 soil moisture levels and river flows are about equally likely to be near normal (35% chance) or below normal (40% chance) in the east South Island. The remainder of the country is expected to have near normal soil moisture levels and river flows (40-45% chance).
Regional predictions for August – October 2020
Northland, Auckland, Waikato, Bay of Plenty
The table below shows the probabilities (or percent chances) for each of three categories: above average, near average, and below average. In the absence of any forecast guidance there would be an equal likelihood (33% chance) of the outcome being in any one of the three categories. Forecast information from local and global guidance models is used to indicate the deviation from equal chance expected for the coming three-month period, with the following outcomes the most likely (but not certain) for this region:
- Temperatures are very likely to be above average (60% chance).
- Rainfall totals are about equally likely to be near normal (40% chance) or above normal (35% chance).
- Soil moisture levels and river flows are most likely to be near normal (40-45% chance).
The full probability breakdown is:
|
Temperature |
Rainfall |
Soil moisture |
River flows |
|
|
Above average |
60 |
35 |
20 |
30 |
|
Near average |
30 |
40 |
45 |
40 |
|
Below average |
10 |
25 |
35 |
30 |
Central North Island, Taranaki, Whanganui, Manawatu, Wellington
Probabilities are assigned in three categories: above average, near average, and below average.
- Temperatures are very likely to be above average (60% chance).
- Rainfall totals are most likely to be near normal (45% chance).
- Soil moisture levels and river flows are most likely to be near normal (45% chance).
The full probability breakdown is:
|
Temperature |
Rainfall |
Soil moisture |
River flows |
|
|
Above average |
60 |
25 |
20 |
25 |
|
Near average |
30 |
45 |
45 |
45 |
|
Below average |
10 |
30 |
35 |
30 |
Gisborne, Hawke’s Bay, Wairarapa
Probabilities are assigned in three categories: above average, near average, and below average.
- Temperatures are about equally likely to be near average (40% chance) or above average (45% chance).
- Rainfall totals are most likely to be near normal (45% chance).
- Soil moisture levels and river flows are most likely to be near normal (45% chance).
The full probability breakdown is:
|
Temperature |
Rainfall |
Soil moisture |
River flows |
|
|
Above average |
45 |
30 |
25 |
25 |
|
Near average |
40 |
45 |
45 |
45 |
|
Below average |
15 |
25 |
30 |
30 |
Tasman, Nelson, Marlborough, Buller
Probabilities are assigned in three categories: above average, near average, and below average.
- Temperatures are equally likely to be near average (40% chance) or above average (40% chance).
- Rainfall totals are most likely to be near normal (45% chance).
- Soil moisture levels and river flows are most likely to be near normal (45% chance).
The full probability breakdown is:
|
Temperature |
Rainfall |
Soil moisture |
River flows |
|
|
Above average |
40 |
25 |
25 |
25 |
|
Near average |
40 |
45 |
45 |
45 |
|
Below average |
20 |
30 |
30 |
30 |
West Coast, Alps and foothills, inland Otago, Southland
Probabilities are assigned in three categories: above average, near average, and below average.
- Temperatures are equally likely to be near average (40% chance) or above average (40% chance).
- Rainfall totals are most likely to be near normal (45% chance).
- Soil moisture levels and river flows are most likely to be near normal (45% chance).
The full probability breakdown is:
|
Temperature |
Rainfall |
Soil moisture |
River flows |
|
|
Above average |
40 |
25 |
25 |
25 |
|
Near average |
40 |
45 |
45 |
45 |
|
Below average |
20 |
30 |
30 |
30 |
Coastal Canterbury, east Otago
Probabilities are assigned in three categories: above average, near average, and below average.
- Temperatures are most likely to be above average (50% chance).
- Rainfall totals are about equally likely to be near normal (40% chance) or below normal (35% chance).
- Soil moisture levels and river flows are about equally likely to be near normal (35% chance) or below normal (40% chance).
The full probability breakdown is:
|
Temperature |
Rainfall |
Soil moisture |
River flows |
|
|
Above average |
50 |
25 |
25 |
25 |
|
Near average |
30 |
40 |
35 |
35 |
|
Below average |
20 |
35 |
40 |
40 |
Graphical representation of the regional probabilities
Background
The NINO3.4 Index anomaly (in the central Pacific) for the month of July (through the 26th) was +0.04˚C. The NINO 1+2 Index posted a value of -0.72˚C, decreasing from -0.57˚C last month. The NINO4 region anomaly remained positive at +0.22˚C.
Upper-oceanic heat content remained lower than normal over the far eastern Pacific with marginally above normal upper-oceanic heat content persisting west of the Date Line. In between, the heat content signature was mixed, with both negative and positive trends. Overall, the pattern remains reflective of a developing La Niña. This will continue to generate an atmospheric response, with suppressed rainfall and convection about the equatorial Pacific.
Trade winds during July were stronger than normal in the central Pacific and slightly reduced over the eastern Pacific. Over the next several weeks, trade winds are forecast to behave in a similar fashion, supportive of a continuation of the current SST distribution; warmer than average west and cooler than average east.
According to the consensus from international models, the probability for La Niña conditions is 52% for the August – October period. For the November 2020-January 2021 and February-April 2021 periods, the probability for La Niña is 49% and 27%, respectively. The probability for neutral conditions increases to 63% during February-April 2021. On average, La Niña is associated with more northeasterly winds in New Zealand, causing wetter conditions in the north and east and drier conditions in the south and west.
During July, New Zealand’s coastal water temperature anomalies remained near or above average for all six climate regions. Above average ocean temperatures will continue to modify colder air masses as they move toward New Zealand from the Southern Ocean.
New Zealand Coastal Sea Surface Temperatures during July 2020 (to the 28th):
|
North NI |
West NI |
East NI |
North SI |
West SI |
East SI |
|
+0.51˚C |
+0.58˚C |
+0.08˚C |
+0.39˚C |
+0.72˚C |
+0.54˚C |
Southern Annular Mode (SAM)
The Southern Annular Mode (SAM) was negative for the month of July but is forecast to end the month in positive territory. Dynamical models indicate a positive SAM is the most likely outcome to start August. A positive SAM favours settled weather in New Zealand, however, other sub-seasonal climate drivers can foster an environment that favours significant rainfall events, even during a positive SAM phase.
The Madden-Julian Oscillation (MJO) continued to be convectively active over the Eastern Hemisphere during July, with anomalous rising air centred over Africa and the western Indian Ocean and sinking air across much of the tropical Pacific.
This forcing pattern is expected to continue over the next three months as the atmosphere leans toward La Niña. Meanwhile, like previous months, intra-seasonal rainfall and thunderstorm activity is expected in the eastern Indian Ocean and Indonesia in response to this part of the world having the warmest SSTs.
For New Zealand, during periods of the aforementioned intra-seasonal activity, the door will likely be open for moist, sub-tropical northeasterly winds, like those experienced in late June and mid-July. Otherwise, a broad westerly quarter airflow is expected to prevail.
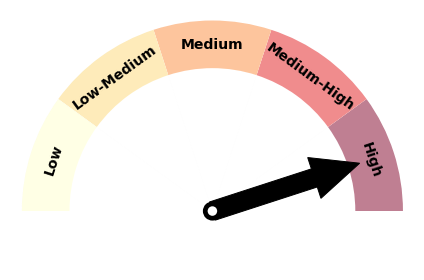
Forecast Confidence
Temperature
|
Forecast confidence for temperatures is high. This is due to the combination of extensive model agreement for warmer than average air temperatures along with the current warmer than average coastal and regional sea surface temperatures. |
Rainfall
|
Forecast confidence for rainfall is medium. While there is a spread in climate model guidance for rainfall expectations during this three-month period, there is a lean away from widespread dryness. Additionally, as has happened previously in June and July, La Niña-like patterns (northeasterly winds) may occur periodically throughout the season. These spells of northeasterly winds provide some insight as to how proficient rainfall events can be. |