PDF of this article (304 KB)


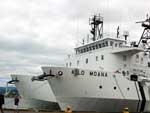
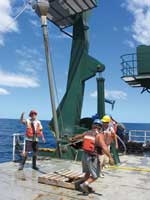
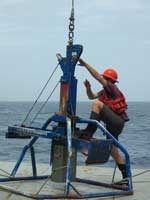

The muddy Poverty Bay and the coastal waters around East Cape are a world-class site to examine sediment sources and sinks, tracking how mud eroded from the land makes its way to the deep ocean. Alan Orpin and his colleagues in the international Poverty Slope Group are using a suite of techniques to unravel this story.
At the coastal zone, vast quantities of sediment, carbon, and nutrients are transferred from land to the sea. Weathering and erosion, biological activity, and the shape of the land and seascape drive the nature of this transfer. Climate and ocean currents influence the frequency and magnitude of dispersal on time scales ranging from daily tides to glacial cycles spanning thousands of years. It’s easier to conceptualise these different environments as separate components, but materials are transported from source to sink as a seamless cascade; as upland areas of the margin catchment erode, sediment accumulates offshore. Hence, marine mud deposits can preserve a continuous record oflandscape, climate, and oceanographic change.
When muddy rivers go bad
Around the North Island’s East Cape, a vigorous maritime climate, punctuated by storms and droughts, operates against a background of mountain-building tectonics and instability, driven by subduction of the Pacific plate beneath the Australian plate. There is widespread erosion of the mudstone- and sandstone-dominated hinterland, and the removal of native forests for cultivation and pasture by human settlers has led to an unprecedented acceleration in erosion. By the early 20th century, nearly all the forest cover was gone and landslides proliferated in steep headwaters.
The Waipaoa River today reflects these natural and human-induced influences, and is now New Zealand’s second largest river in terms of suspended sediment discharge, delivering 15 million tonnes of mud per year to coastal Poverty Bay. That’s the equivalent of about 4100 truckloads per day. The Waipaoa and the other major East Cape rivers – the Waiapu and the Hikuwai – collectively deliver 0.3% of the global mud budget to the ocean.
Global focus on the Waipaoa
The massive mud discharge and some compelling science developed from earlier studies won the Waipaoa River and the Poverty Bay margin – the continental shelf and slope – a coveted place as an international study site for sediment dispersal at mud-dominated coasts. Research offshore of Poverty Bay has received a significant boost since 2005, when the MARGINS: Source-to-Sink project was funded by the USA, so that today it’s the most cored section of New Zealand’s coast. New findings about sedimentation on the Poverty Bay margin span time scales of weeks to millennia, but an ability to date the sediment, and thereby estimate the rate that mud is accumulating, is critical to unravelling the source-to-sink story.
Measuring the dynamics of mud dispersal
Among our key tools for assessing how fast and where sediments are accumulating offshore are radioactive chemical tracers. These include naturally occurring radioactive isotopeswhich show mud accumulation rates over different time scales. Isotopes of lead are useful for sedimentation rates over the last century, while beryllium’s activity is short-lived and can show mud accumulation rates over recent months. Other radioisotope tracers were produced during thermonuclear bomb testing in the Pacific in the sixties and can provide a useful time marker that is incorporated in the accumulated seafloor sediments. Ongoing study suggests that these tracers have even pinpointed the occurrence of mud pulses from major floods, like Cyclone Bola. The challenge is now to assess if Bola-like events occurred regularly over millennial timescales and how they are preserved.
A seamless cascade of mud
New results show that mud is accumulating up to a few centimetres per year, even tens of kilometres from the mouth of the Waipaoa River, and is highest in the head of a submarine canyon. This result is supported by 3-m-long cores of soft homogeneous mud deposited over the last thousand years, and seismic profiles that show a mud drape tens of metres thick. Mud transport is controlled by the seascape and is focused into the steep gullies that feed into the Poverty Canyon system downslope. Beryllium tracer analysis shows seasonal differences: sediment was more widely dispersed and present in higher quantities in the winter of 2006 than after the summer months of 2005. This result could reflect an increase in rainfall and subsequent riverine mud delivery and increased ocean storm activity during winter months.
Carbon dating and identification of discrete ashes erupted from the Taupo volcanic region have provided a remarkably accurate calendar for much of the core material. We’ve found changes in sedimentation over the last one thousand years since settlement: on the continental shelf, close to the coast, the sediments have increased by 2 to 3 times, but farther out on the slope we see a smaller increase of 1 to 2 times. If we look over the last few thousand years, we see slower but steady sedimentation.
Pollen shows Māori and European settlement
Pollen records from shelf and slope cores can fingerprint settlement of the land, first by Māori explorers around 700 years ago, followed by European settlers in the mid 1800s. A shift in landscape flora is recorded even in the deep-water sediments of the continental slope. Evidence from the cores shows a slow decline in native tall trees, such as rimu, matai, beech, and kaihikatea, matched by a proliferation of bracken scrub. We can see effects of the clearance of forests and the establishment of pastures in the dramatic and rapid shift in the material that eroded from the landscape.
Mud deposits, ancient and modern
Our analysis of the sediment cores shows that mud dispersal from the Waipaoa drainage system spreads tens of kilometres from the coast, is affected by the seasons, and has persistedfor several thousand years. There is also clear evidence of dramatic increases in terrestrial erosion in the last millennium, since humans arrived and began clearing the forests and cultivating the land.
Sediments from source to sink
- Geology, climate, and human influences contribute to high sediment discharge from the Waipaoa and other East Cape rivers into the sea.
- A major international research project is using extensive coring to study Poverty Bay sediments.
- Various ways of analysing the sediment cores are showing how much of the sediment discharge is due to man-made changes to the landscape.
The Poverty Slope Group comprises scientists from nine institutions. In New Zealand: Dr Alan Orpin (NIWA); Dr Alan Palmer (Massey University); Dr Gavin Dunbar, Dr Lionel Carter, Matthew Wood (Victoria University of Wellington); Dr Gary Wilson (University of Otago). In the USA: Dr Clark Alexander, Claudia Venherm (Skidaway Institute of Oceanography); Dr J.P. Walsh, Ben Sumner (East Carolina University); Dr Steven Kuehl (Virginia Institute of Marine Science); Tommy Gerber (Duke University); Dr Kathleen Marsaglia (California State University-Northridge).
Teachers’ resource for NCEA Achievement Standards or Unit Standards: Geography Level 2 AS90331, US5089, Level 3 AS90701, US5095 Science Level 3 AS9073
