NIWA is working on an MSI (formerly FRST)-funded project to produce a model, validated by 40 years of historic data, to project future wave and storm surges off the coast for two climate change scenarios.
This will be at a nationally consistent scale around New Zealand and will help decision makers plan for future hazards. We intend to make the results available in an online tool, and are looking for feedback about what people want from this.
About
Regional projections of waves and storm-surge will help local government and engineering or planning consultants to make decisions about how best to adapt to climate change in coastal areas. These projects will be based on models validated by matching them to data from 1960–2000 (hindcasting).
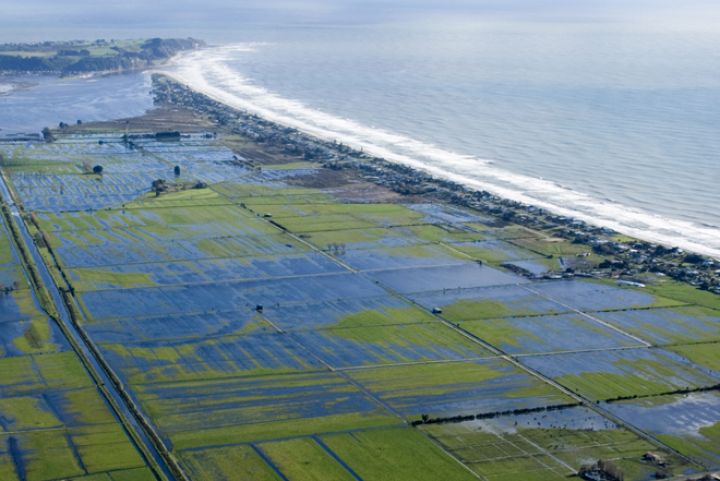
The information will provide a wider basis for sustainable resource-management planning decisions for the coastal margin that adequately accounts for not only sea-level rise impacts (which currently tends to be the main focus), but also potential changes to waves and storm-surge and their impact on coastal hazards.
The ability to extract regional information from this nationally-consistent web-based tool will help create a more standardised approach by local government, infrastructure operators and coastal communities in their efforts to adapt to climate change impacts. It will also build on and support the recently-released guidance manual for local government on Coastal Hazards and Climate Change published by the Ministry for the Environment in 2008, and the 2009 summary Preparing for Coastal Change.
What will be available?
Data will be output at the 20 m and 50 m depth contour at regular intervals around the New Zealand coastline. This provides “offshore” conditions that can be used in situ, or as boundary conditions to drive more detailed coastal models. For each of (1) 40-year (1960–2000) hindcast and (2) 30-year futurecast (2070–2100, B1 and A2 climate change scenarios) there will be:
- hourly/monthly timeseries of sea level, storm surge, significant wave height, wave period and wave direction.
- summary statistics for the modelled variables, including distribution plots such as histograms, probability and cumulative distribution functions.
- extreme-value analyses and output for sea level, storm surge and wave height, and joint-probability statistics for extreme sea level and waves, e.g., Average Recurrence Interval or Annual Exceedance Probability (AEP).
It is intended that inside the WASP delivery system a user can zoom from a map of New Zealand to a specific area of interest, and mouse-click on a point to access the data or statistics over the web.