Phytoplankton: tiny cells with a big job
By Adriana Lopes
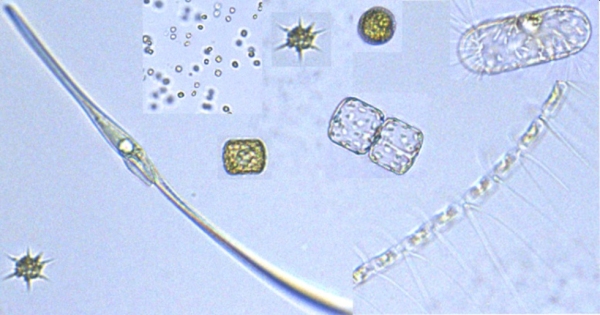
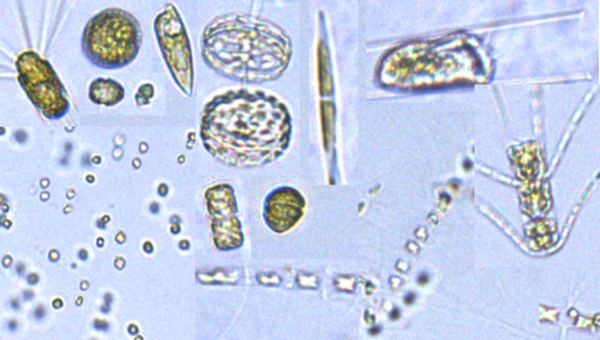
We talked a little about phytoplankton on our Voyage Update #4, and how they constitute the base of the food chain. We actually had a whole crew on the SalpPOOP voyage focusing on these small plant-like plankton! There is a lot that we still don’t know about how these tiny eukaryotic cells thrive throughout the euphotic zone of the oceans.
In the ocean, the rate at which CO2 carbon from the atmosphere gets converted to sugars and other molecules through photosynthesis (primary production), is often measured by the rate at which phytoplankton become radiolabeled when supplied with 14C – a tracer we add into our experiments to be able to measure photosynthesis. Combined with size fractionating approaches, measurements of 14C incorporation have been long used to access the contribution of different phytoplankton sizes, such as pico- (< 2 µm), nano- (2 - 20 µm), and microplankton (20-200 µm). However, these simple size categories hide an enormous diversity of taxa and life strategies, as they lump together hundreds of different species.
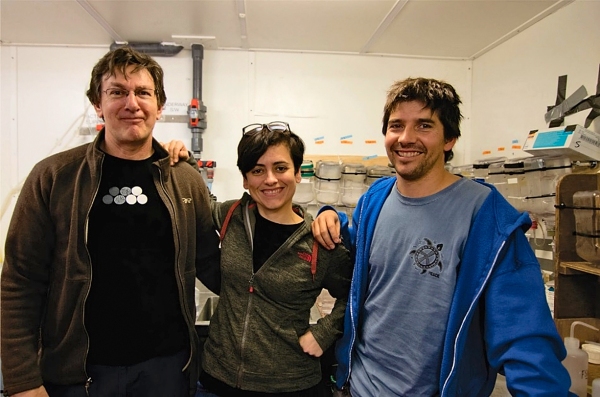
During the voyage, Karl Safi, Andres Gutierrez and I collected water at 2am from two different depths to look at different phytoplankton populations. We collected the array after 24h, and the radio-labelled carbon (NaH14C03) has been incorporated into organic compounds produced by photosynthesis over the past day.
Samples were then either filtered through 0.2 µm filters to collect the tiny phytoplankton cells or directly flash frozen in liquid nitrogen to preserve the integrity of the cells and radiotracer signal. Back in the lab after the cruise, the phytoplanktonic cells will be separated by flow cytometric sorting (see Voyage Update #4 if you want to know about Flow Cytometry) and the radiotracer incorporation will be measured directly in the sorted populations. Based on scatter signals and natural pigments fluorescence, phytoplanktonic populations can be discriminated into 4 major groups: two types of cyanobacteria (Prochloroccoccus and Synechococcus), pico and nano-eukaryotes. The DNA from the sorted populations will also be sequenced in order to know exactly which taxonomic groups were performing the primary production in our tiny vials.
By linking the information from our experiments with the environmental data acquired during the cruise (nutrients, temperature, light intensity, cells growth rate and grazing), we expect to increase our knowledge of how environmental factors shape the phytoplankton community and primary production.


