Our latest water quality data from around the country, showing results from January to March 2011.
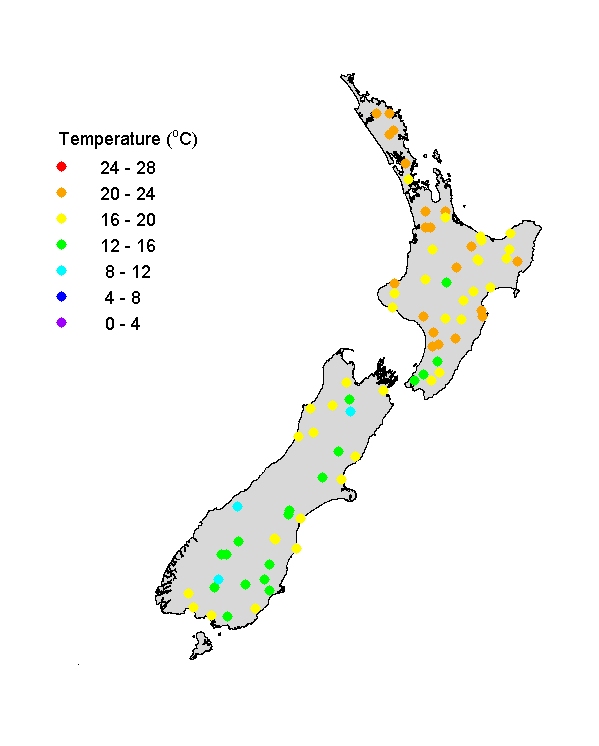
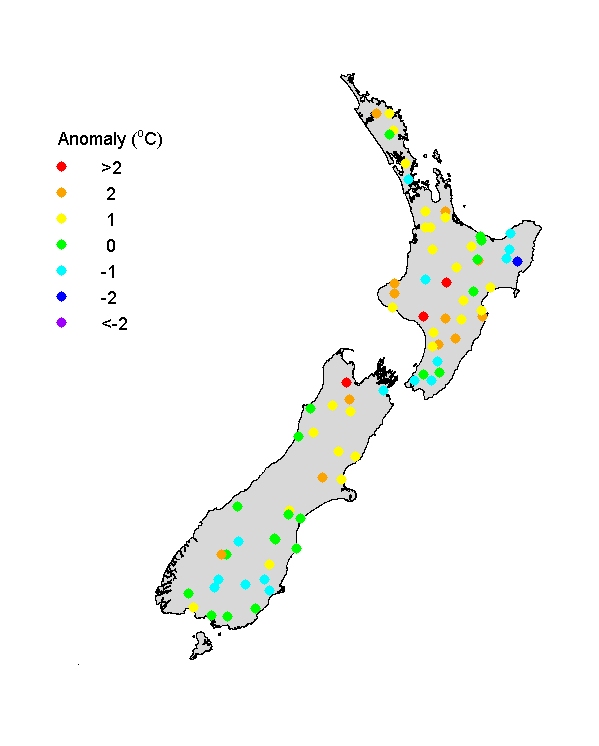
Water temperatures showed the typical latitudinal gradient (increasing south to north) and altitudinal gradient (cooler at higher altitude) across the country. Temperatures were fairly usual for summer except for being higher than typical in some rivers in southern North Island and northern South Island.
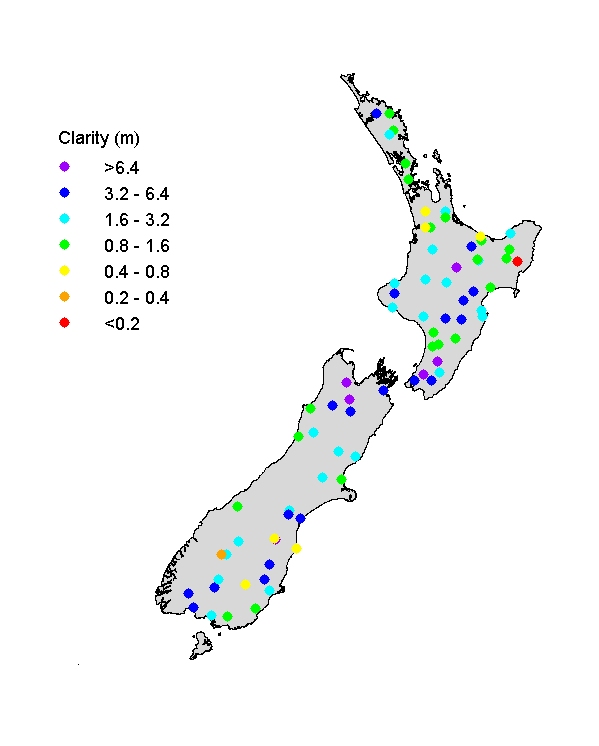
Visual clarity of rivers reflects geology, soil, and land use patterns. Mudstone areas (e.g., East Cape) and clay soils (e.g., Northland) tend to produce low visual clarity particularly in rivers with pasture catchments. Visual clarity also depends on state of flow, and rivers tend to be relatively turbid (i.e., have low clarity) in high flows. Visual clarity was unusually low in the East Cape region with high river flows, and unusually high in several rivers distributed over the country where summer flows were low. For example, the Motueka River, northern South Island, was extremely clear (18-metre visibility) at the Gorge site under low flow conditions when sampled on 15 March 2011.
Note that the data are preliminary, and subject to amendment after quality assurance procedures. We thank NIWA field teams, regional and district councils, and hydro-power companies for providing this information.