Looking to the past for a complete record of earthquakes in Poverty Bay
Scientists have been working on ways to find out about earthquakes that occurred before oral and written records
began in New Zealand.
"We want to know if, and how often, an earthquake of the magnitude of the one in Japan last year has occurred along
the Hikurangi Margin, east of the North Island, in the past," says NIWA Principal Scientist Dr Geoffroy Lamarche.
"We have identified a large number of small submarine mudslides along the continental slope between Poverty
Bay and East Cape, which have been triggered simultaneously by earthquakes of magnitude 7.5 and over. We are still assessing
the relationship between these submarine mudslides and earthquake magnitude.
"To better understand the likelihood of large earthquakes occurring in this active region we need to understand the frequency and magnitude of past events," says Dr Lamarche.
There is little information available about large earthquakes that occurred in the past, and how frequently they occurred. This
is especially so for very large ones occurring on time scales of thousands of years. This makes it difficult to develop models that can help forecast earthquakes.
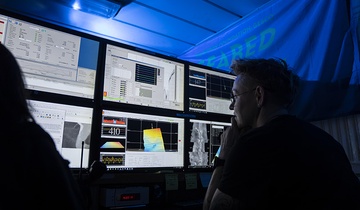
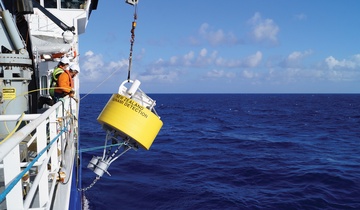
In 2006, onboard the French research vessel Marion Dufresne, scientists took two 20-metre long cores of sediments from the seafloor, 60 kilometres offshore in Poverty Bay. The cores were collected using the Calypso corer, the only one of its kind in the world.
Using a 60 metre-long steel tube which is pushed into the sediment, the Calypso corer retrieved two core samples from the seafloor. Samples were collected along the length of the cores, analysed and carbon dated.
"What we found was that overall, 67 layers were identified as being triggered by earthquakes of magnitude 7.5 or above in the Poverty Bay region over the last 18,000 years. These earthquakes occur every 230 years on average.
"We were able to demonstrate that some mudslides occurred simultaneously along the entire length between Poverty Bay and East Cape, in which case we believe this was the result of great earthquakes (>8)."
"Up to 20 such events have been revealed by the sediment cores, suggesting that as many great earthquakes occurred in the northern Hikurangi Margin over the last 18,000 years, that is every 820 years," says Dr Lamarche.
There are other types of layers in the sediment that are caused by natural undersea sedimentation, flooding or volcanic activity. Scientists are able to tell these layers apart because they are composed of different sorts of material and fine-scale organisation of the sediment differ.
From the two cores, we can recognise turbidites, which are fine submarine mudflows or landslides usually triggered by earthquakes, from those sediments delivered and deposited from rivers," says Dr Lamarche.
"We can characterise the turbidites from the shells, and the minerals, present in these sediments. The type, size and organisation of minerals as well as their chemistry provide clues on the origin, timing and mechanisms of positioning of the landslides. There are differences between sediments that are gently deposited on the seafloor, as part of the natural sedimentation in the deep ocean, from that delivered from rivers into the sea.
"This is important to understand the origin of the sediments before we can date them," says Dr Lamarche.
The information the scientists have found will be very useful for earthquake hazard assessment in the future. Similar work is also being undertaken in Fiordland.
The dating and characterisation work was conducted in collaboration with Hugo Pouderoux a PhD student from Rennes University and co-directed by Jean-Noel Proust from Geosciences-Rennes in France.
Funding was provided by the Ministry of Science and Innovation.