Hotspot Watch 5 February 2021
A weekly update describing soil moisture patterns across the country to show where dry to extremely dry conditions are occurring or imminent. Regions experiencing significant soil moisture deficits are deemed “hotspots”. Persistent hotspot regions have the potential to develop into drought.
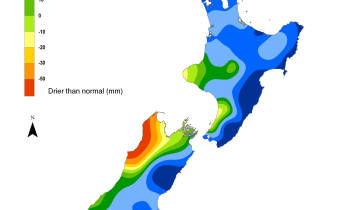
Facts: Soil Moisture
Meagre rainfall was again observed across nearly all of the North Island during the past week, with most locations receiving 5 mm or less. In fact, much of the central North Island received no rainfall at all during the past week. The one exception was northern Hawke’s Bay and coastal Gisborne, where a small area received 15-30 mm. This led to substantial soil moisture decreases throughout the North Island. The driest soils across the North Island, when compared to normal for this time of the year, are found in the Far North and a portion of Ōpōtiki. Meanwhile, the wettest soils for this time of year for the North Island are located in western Taranaki.
Hotspot conditions are now widespread across the North Island, including nearly all of Northland, Auckland, northern Waikato, and the east coast. Hotspots also cover much of Bay of Plenty, the Central Plateau, central Manawatū-Whanganui, and near Wellington City. The New Zealand Drought Index (NZDI) map below shows that meteorological drought and severe meteorological drought are in place in the northern half of the Far North District as well as a small portion of East Cape. Widespread dry-to-extremely dry soils are in place in the remainder of Northland, Auckland, northern Waikato, western Bay of Plenty, East Cape, and much of the eastern North Island.
In the South Island, it was a very dry week with most locations seeing 5 mm or less, and some areas receiving no rainfall at all. This led to moderate soil moisture decreases across nearly the entire South Island. The driest soils in the South Island compared to normal for this time of year are located in Nelson, northern Tasman, and eastern Southland, while the wettest soils for this time of the year for the South Island are found from northern Otago to central Southland.
Hotspots are currently in place in Nelson, nearby parts of Tasman, coastal Hurunui District, and coastal Selwyn District. The New Zealand Drought Index (NZDI) map below shows that dry to very dry soils are found in the northeastern South Island.
Outlook and Soil Moisture
Other than a few showers along the east coast through Saturday (6 February), high pressure will continue to bring dry weather to the North Island over the next several days. By the middle of next week (around 10 February), a front is likely to move across the North Island with a period of rain and perhaps thunderstorms. This could produce up to 15 mm for much of the North Island before high pressure returns late next week.
With weekly rainfall totals up to 15 mm across the North Island during the next week, at least minor soil moisture decreases will again be possible for most locations. This will likely result in most current hotspots strengthening and expanding at least slightly.
High pressure will continue to bring dry weather to the South Island through this weekend. However, rain is likely to reach the West Coast by late Monday or Tuesday (8-9 February), and this rain may be heavy at times. By about Wednesday, low pressure forming nearby could spread moderate to heavy rainfall across much of the South Island. By late next week, high pressure returns with mostly dry weather. Weekly rainfall totals will depend on the exact location of low pressure next week, but substantial amounts are possible for some areas. Much of the West Coast could receive 150 mm or more, with perhaps 50 mm or more in the lower South Island. Amounts may be smaller in northern Canterbury and Marlborough, with 25 mm or less possible.
Due to the expected rainfall in the next week, soil moisture increases will be likely in the West Coast and lower South Island. However, it’s possible that only small changes will occur in northern Canterbury and Marlborough. The current hotspots in the upper South Island may improve somewhat during the next week, while those in Canterbury may not change significantly.
Background:
Hotspot Watch: a weekly advisory service for New Zealand media. It provides soil moisture and precipitation measurements around the country to help assess whether extremely dry conditions are imminent.
Soil moisture deficit: the amount of water needed to bring the soil moisture content back to field capacity, which is the maximum amount of water the soil can hold.
Soil moisture anomaly: the difference between the historical normal soil moisture deficit (or surplus) for a given time of year and actual soil moisture deficits.
Definitions: “Extremely” and “severely” dry soils are based on a combination of the current soil moisture status and the difference from normal soil moisture (see soil moisture maps at https://www.niwa.co.nz/climate/nz-drought-monitor/droughtindicatormaps)
Hotspot: A hotspot is declared if soils are "severely drier than normal" which occurs when Soil Moisture Deficit (SMD) is less than -110 mm AND the Soil Moisture Anomaly is less than -20 mm.


Pictured above: Soil Moisture Anomaly Maps, relative to this time of year. The maps show soil moisture anomaly for the past two weeks.
New Zealand Drought Index
As of 2 February, the New Zealand Drought Index (NZDI) map below shows that meteorological drought and severe meteorological drought are in place in the northern half of the Far North District as well as a small portion of East Cape. Widespread dry-to-extremely dry soils are in place in the remainder of Northland, Auckland, northern Waikato, western Bay of Plenty, East Cape, much of the eastern North Island, and northeastern South Island. Please note: some hotspots in the text above may not correspond with the NZDI map. This difference exists because the NZDI uses additional dryness indices, including one which integrates the rainfall deficit over the past 60 days. Changes are therefore slower to appear in the NZDI compared to soil moisture anomaly maps that are instantaneously updated.