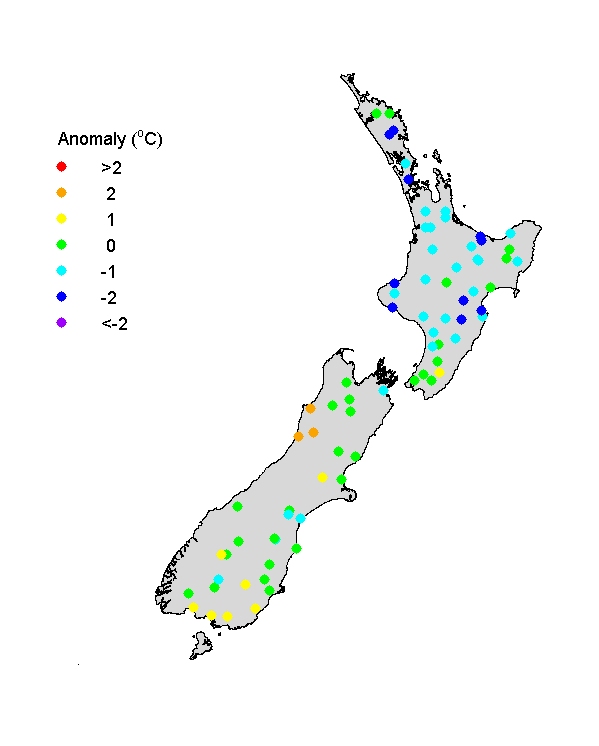
River water temperatures (JFM)
Summer temperatures were mostly in the range 12-24oC, with the typical weak trends of decreasing temperature moving north to south, and decreasing temperature with increasing altitude (moving into mountainous areas). River temperatures were fairly normal for summer although somewhat cooler than typical in the North Island and warmer than normal in the far south of the South Island – weakening the typical latitudinal trend. Water temperatures in the Grey and Buller Rivers on the West Coast of the South Island were warm, about 2oC above average.
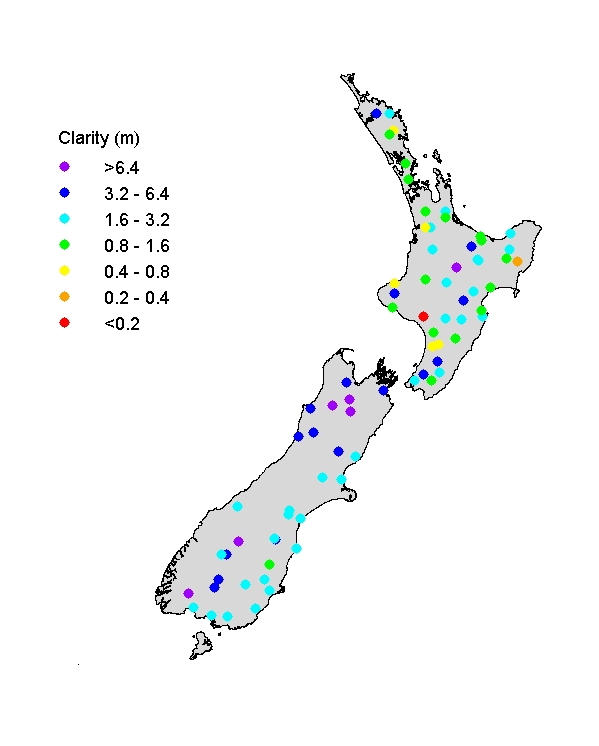
Visual clarity of rivers (JFM)
Visual clarity of rivers ranged widely (from <0.4m to >6 m), reflecting New Zealand's diversity of soil and rock types. Rivers in pastoral catchments tend to be less clear than rivers draining forest, and rivers tend to be clearer in the South Island than in the North Island. Rivers over much of the South Island were unusually clear, with numerous record high visual clarity readings (e.g., in the lower Buller and Grey Rivers on the West Coast, South Island. This pattern of high visual clarities apparently reflects low flow conditions in the drought through much of summer. Rivers over most of the North Island had typical (summer) visual clarity, although some Central North Island rivers (e.g., the Whanganui and Manawatu Rivers) were less clear than normal.