River flows - January to March 2013
29 April 2013
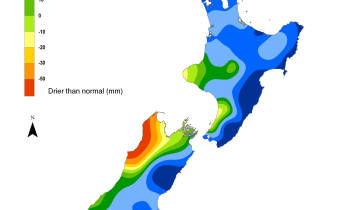
The January to March map shows the duration and intensity of the North Island drought, with every region having substantial areas in the ‘far below normal’ category over the three months.
The South Island values for this period still show the effect of the north-west floods of early January, except in eastern Southland and southern Otago where conditions were below normal.
The March map shows that the majority of monitored and reported catchments were ‘far below normal’ over the whole country.

River flows - January to March 2013