Biological traits analysis is a valuable tool for measuring ecosystem function.
Based on the characteristics of individual organisms, it is also a powerful way to measure ecosystem health and vulnerability to human activities.
The issue
Globally, soft seafloor habitats are seriously affected by human activities like pollution, mining, dredging and trawling.
These activities often happen in the same locations and stress organisms living there in a variety of ways, meaning we need to understand cumulative effects.
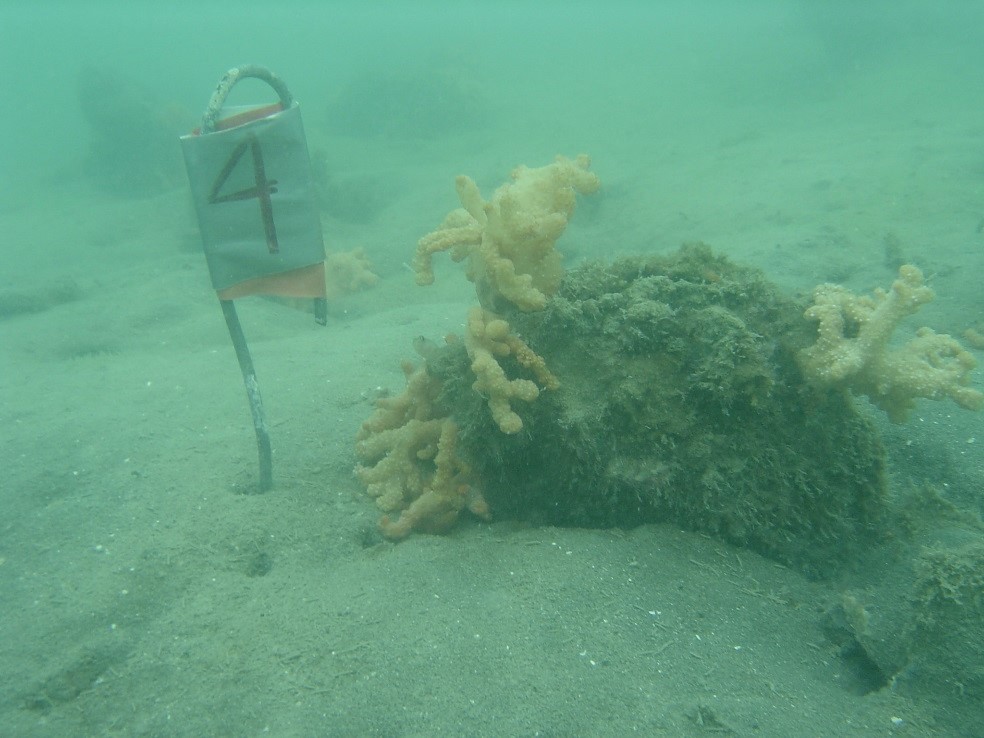
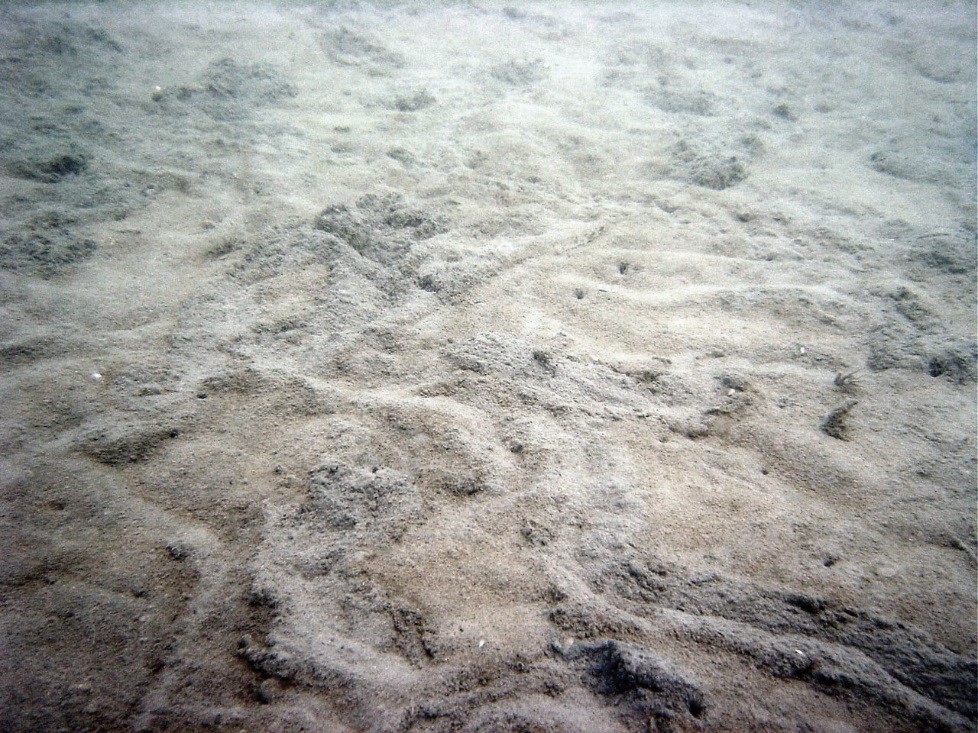
Many people may not see this as an issue, thinking that these habitats are uniform plains of sand or mud. However, these places are complex, species-rich ecosystems that also contribute substantially to how the greater ecosystem functions. This means they are important to the goods and services that marine ecosystems provide humans.
For example, organisms living in these areas can:
- create places for other organisms to live and hide
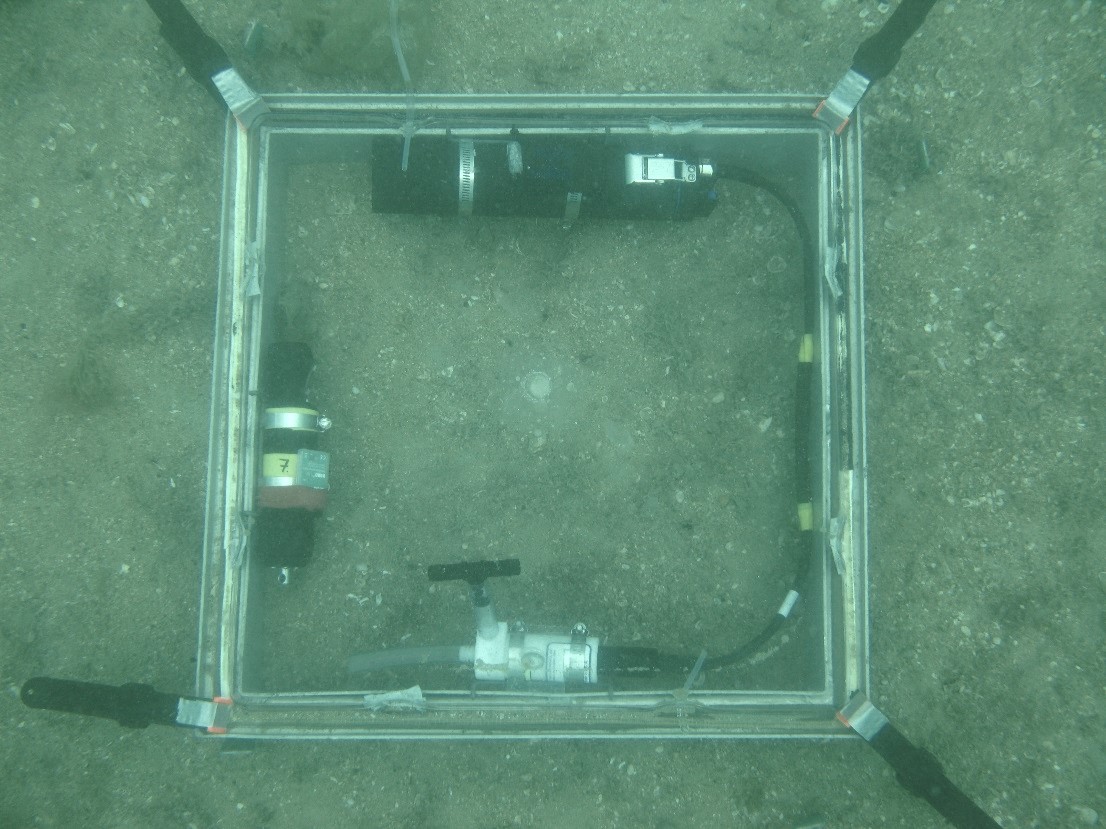
- burrow and mix sediments [PDF 139 KB]
- modify the chemistry of the surface sediment [PDF 1.2 MB].
The biological traits of organisms – e.g. having a large, fragile body and limited mobility, or feeding on algae in the water - can also make them sensitive to specific human activities.
The approach
Until recently, decreases in biodiversity were simply seen as loss of species. Now, there is a shift towards the concept of functional diversity - the number, type and distribution of functions performed by an ecosystem’s organisms - as a complement to species diversity.
If an ecosystem has two or more species performing the same function, the loss of one might not have an effect. However, if all the species performing that function are lost, the function itself is lost. This is often followed by a loss of ecosystem services.
For example, the switch from coral- to algal-dominated reefs in Jamaica in the 1980s was likely caused by a drop in the number of herbivorous fish (fishing) followed by the mass deaths of herbivorous sea urchins.
Biological traits also can predispose an organism to be susceptible to a particular stressor, for example organisms that feed by filtering out algae from the water will be susceptible to increases in suspended sediment in the water resulting from dredging, land run off, and bottom trawling.
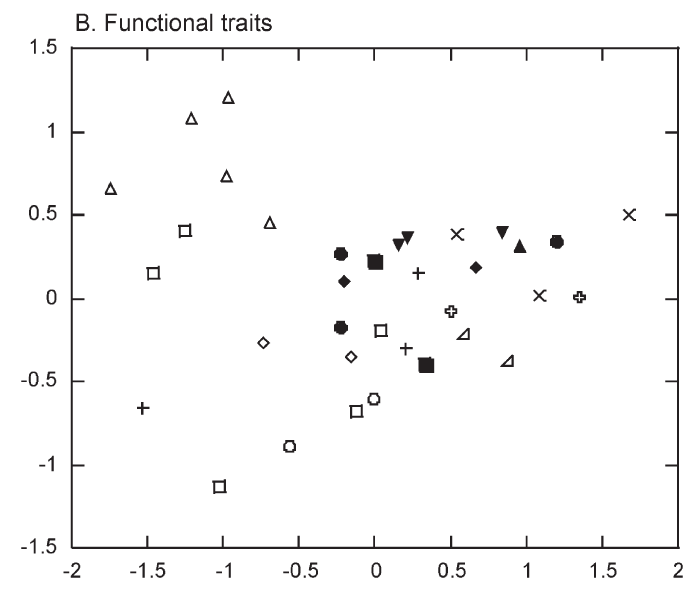
Biological traits analysis allows us to compare the composition of, and biodiversity between, widely separate locations, independent of regional species pools.
For example, a study compared two locations in New Zealand likely to have different species pools: Northern Hauraki Gulf and Tonga Island Marine Reserve. It found that both locations had similar biological traits, even though the two sites only had 112 of the 374 observed taxa in common.
The study also highlighted the importance of maintaining habitat variety to support ecosystem functioning. It found differences in the specific traits important for ecosystem function across the habitats studied.
Read the study "Predicting the effect of habitat homogenization on marine biodiversity"
Generally-used traits
Table 1: Biological trait categories can be related to ecosystem function, sensitivity to stressors and recovery.
|
Categories |
Functioning |
Sensitivity |
Recovery |
|
Adult size (e.g., <2mm) |
y |
y |
y |
|
Adult-juvenile interactions (e.g., positive) |
y |
y |
|
|
Adult longevity (e.g., 25 – 50 yrs) |
y |
y |
|
|
Reproductive frequency (e.g., semi-continuous) |
y |
||
|
Developmental type (e.g., planktonic) |
y |
||
|
Environmental position (e.g., >5cm below sediment surface, surface etc) |
y |
y |
|
|
Living habit (e.g., encrusting, foliose, open burrows, etc) |
y |
y |
|
|
Feeding habit (e.g., suspension feeder) |
y |
y |
|
|
Juvenile post-settlement movement/method (e.g., swimmer) |
y |
y |
y |
|
Adult movement/method (e.g., crawler) |
y |
y |
y |
|
Sediment transport (e.g., diffusive mixing) |
y |
||
|
Sediment stabilisation (e.g., armours bed) |
y |
||
|
Structural Fragility (e.g.,flexible) |
y |
Present research
Increasing our understanding of the relationships between:
- species and functional diversity (contact Carolyn Lundquist)
- functional diversity and ecosystem functioning (contact Drew Lohrer)
Using trait-stressor relationships to identify the sensitivity of locations to particular activities in order to predict:
- sudden responses of ecosystems to cumulative effects(contact Judi Hewitt)
- which species and levels of diversity are needed to maintain function in different marine ecosystems (contact Judi Hewitt)
References
- Bremner, J., Rogers, S.I., Frid, C.L.J., 2003. Assessing functional diversity in marine benthic ecosystems: a comparison of approaches. Marine Ecology Progress Series 254, 11-25.
- Hewitt, J.E., Thrush, S.F., Dayton, P.D., 2008. Habitat variation, species diversity and ecological functioning in a marine system. Journal of Experimental Marine Biology and Ecology 366, 116-122.
- Hewitt, J.E., Julian, K., Bone, E.K., 2011. Chatham-Challenger Ocean Survey 20/20 Post-Voyage Analyses: Objective 10 – Biotic habitats and their sensitivity to physical disturbances. New Zealand Aquatic Environment and Biodiversity Report No. 81.
- Micheli, F., Halpern, B.S., 2005. Low functional redundancy in coastal marine assemblages. Ecology Letters 8, 391-400.
- Thrush, S.F., Gray, J.S., Hewitt, J.E., Ugland, K.I., 2006. Predicting the effects of habitat homogenization on marine biodiversity. Ecological Applications 16 (5), 1636-1642.
- Petchey, O.L., Gaston, K.J., 2006. Functional diversity: back to basics and looking forward. Ecology Letters 9, 741-758.