Background
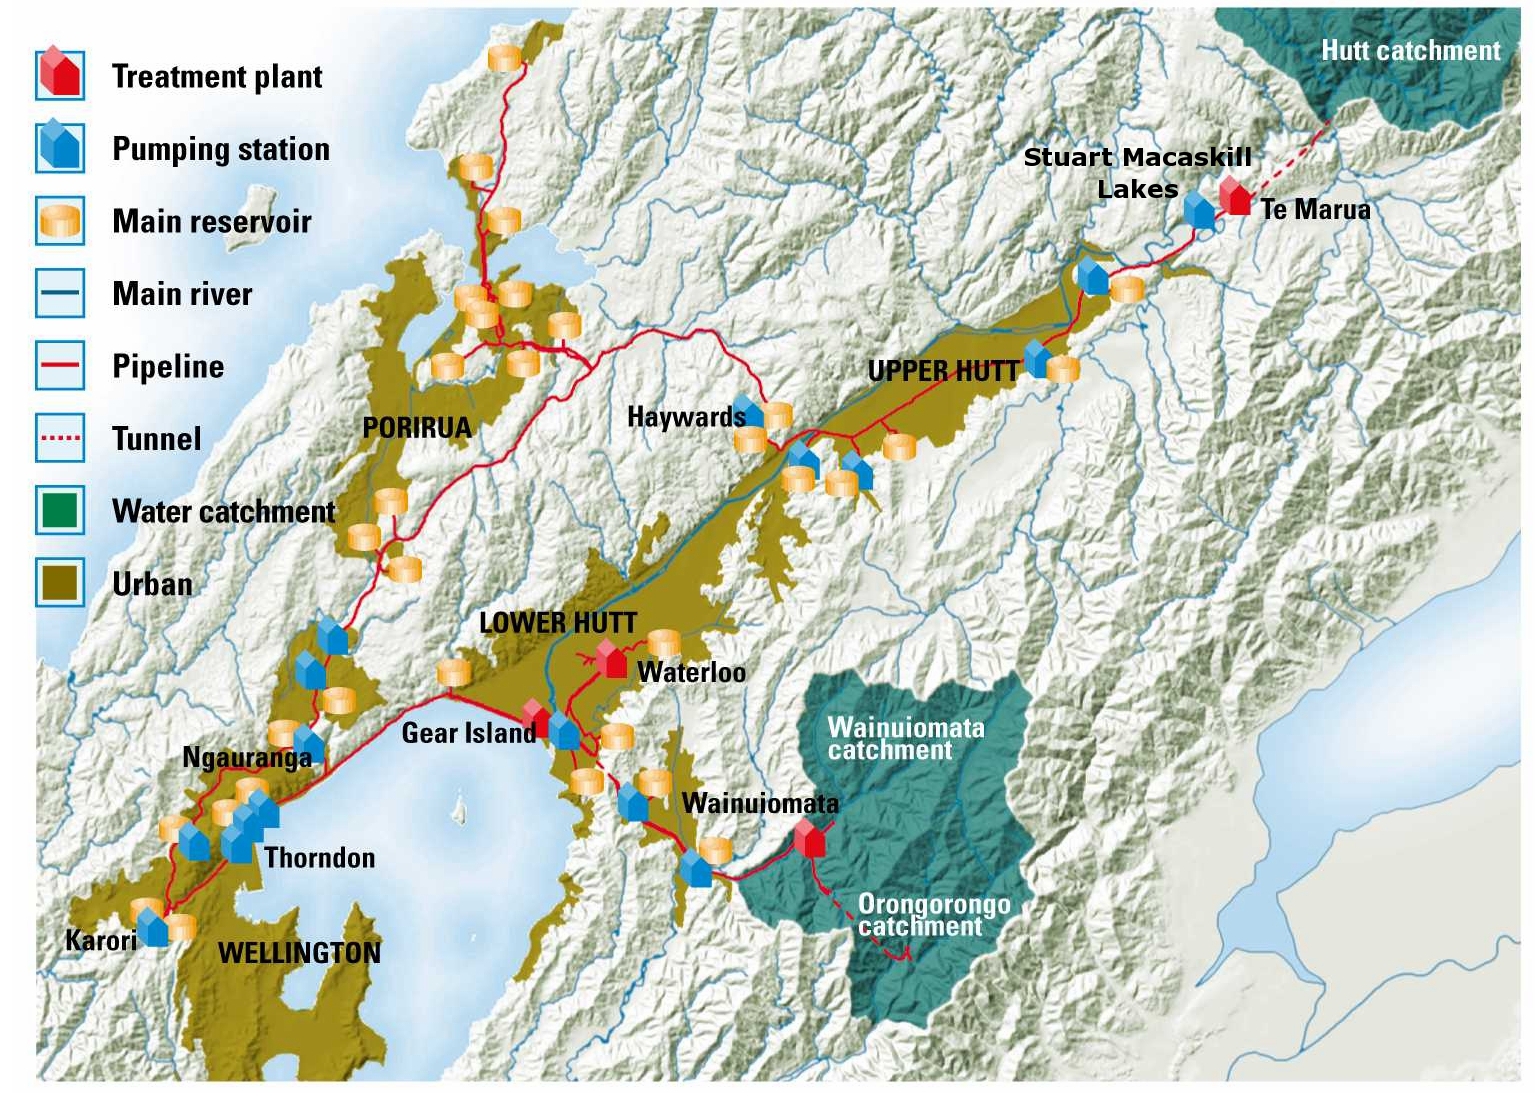
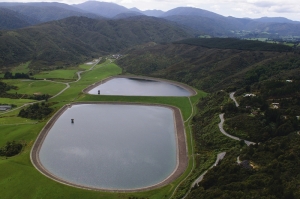
Greater Wellington Water (GWW) treat and distribute 'bulk' water to Upper and Lower Hutt, Porirua and Wellington cities (see map on right). Water is sourced from the Waiwhetu Aquifer and the Hutt, Orongorongo and Wainuiomata Rivers. On average 40% of Wellington's water comes from the aquifer and 60% from rivers (MWH 2011). The 3000 ML Stuart Macaskill water storage lakes[1] at Te Marua (see photo on right) provide a few weeks of summer storage (MWH 2011) and the Waiwhetu Aquifer[2] also acts as a buffer during dry periods (Williams 2011, pers comm). In the year to June 2010, GWW supplied an average of 145 million litres (ML) of bulk water daily to 390,000 people (GW 2010).
[Note 1] The storage capacity of the Stuart Macaskill Lakes will be 3390 ML once current upgrades are complete (Shaw and McCarthy 2009). [Note 2] Abstraction occurs at Waterloo and Gear Island, ranging from 20 – 120 ML/day, and averaging 60 ML/day (GW 2008).The case study
A case study was undertaken into water supply management for the four cities of Wellington, Porirua, Lower Hutt and Upper Hutt, serviced by the one reticulated network. The aim of this research was to gain a detailed understanding of the factors and determinants influencing water use and management in Wellington, and how specific response options could affect future community and institutional adaptive capacity, and increase or decrease resilience to water shortages.
One of the objectives of this case study looked at interactions between water supply and demand factors, and climate change trends. This objective was addressed through the use of scenarios and projections based on water use in Wellington, using Greater Wellington Regional Council's hydrological computer model, the Sustainable Yield Model (SYM). The SYM was an essential tool for this objective, and this tool presents the methodology used.
Tools associated with the Wellington water supply and demand case study
| Tool Name | Tool Reference | Key Figure / Table |
|---|---|---|
| Sensitivity Matrix Tool for Assessing Vulnerability of Urban Environments to Climate Change | [Tool 1.6] | Appendix: Wellington sensitivity matrix. Potable water supply was identified as a significant vulnerability. |
| General information on water supply and demand approaches and issues | [Tool 2.5.1] |
Figure 2.1: Response pathway diagram. Shows the relative influence of key responses on system variables to reduce community exposure and sensitivity to water shortages due to increasing climate change and population |
| SYM Approach to Present-day and Future Potable Water Supply and Demand | [Tool 2.5.3] |
Section 3: Results from the Wellington case study. By 2040 climate change could decrease potentially available water (PAW) by 5% or 12 ML per day on average for January and February (Figure 3.2), with a corresponding 4.5 litre or 1% increase in average per capita demand (PCD) (Figure 3.3). |
References
GW 2008. Technical Information: Waterloo Water Treatment Plant. Greater Wellington Regional Council.
GW 2010. Water Supply Annual Report 2010. Greater Wellington Regional Council.
MWH 2011. Wellington Metropolitan Bulk Water Supply Review of Security of Supply Standard. Prepared for Greater Wellington Regional Council.
Shaw, T. and A. McCarthy. 2009. Stuart Macaskill Lakes seismic security upgrade. Greater Wellington Regional Council. Wellington.
Related links
- Other Urban Impacts Toolbox case studies
- Climate variability and change
- NZ temperature record
- Climate change scenarios for New Zealand