
Seasonal climate outlook - January - March 2019
Outlook summary
- The atmospheric circulation around New Zealand is forecast to be characterised by pressures slightly higher than normal over and to the north of the country. For New Zealand, this pressure pattern will be accompanied by weak south-westerly quarter flow anomalies.
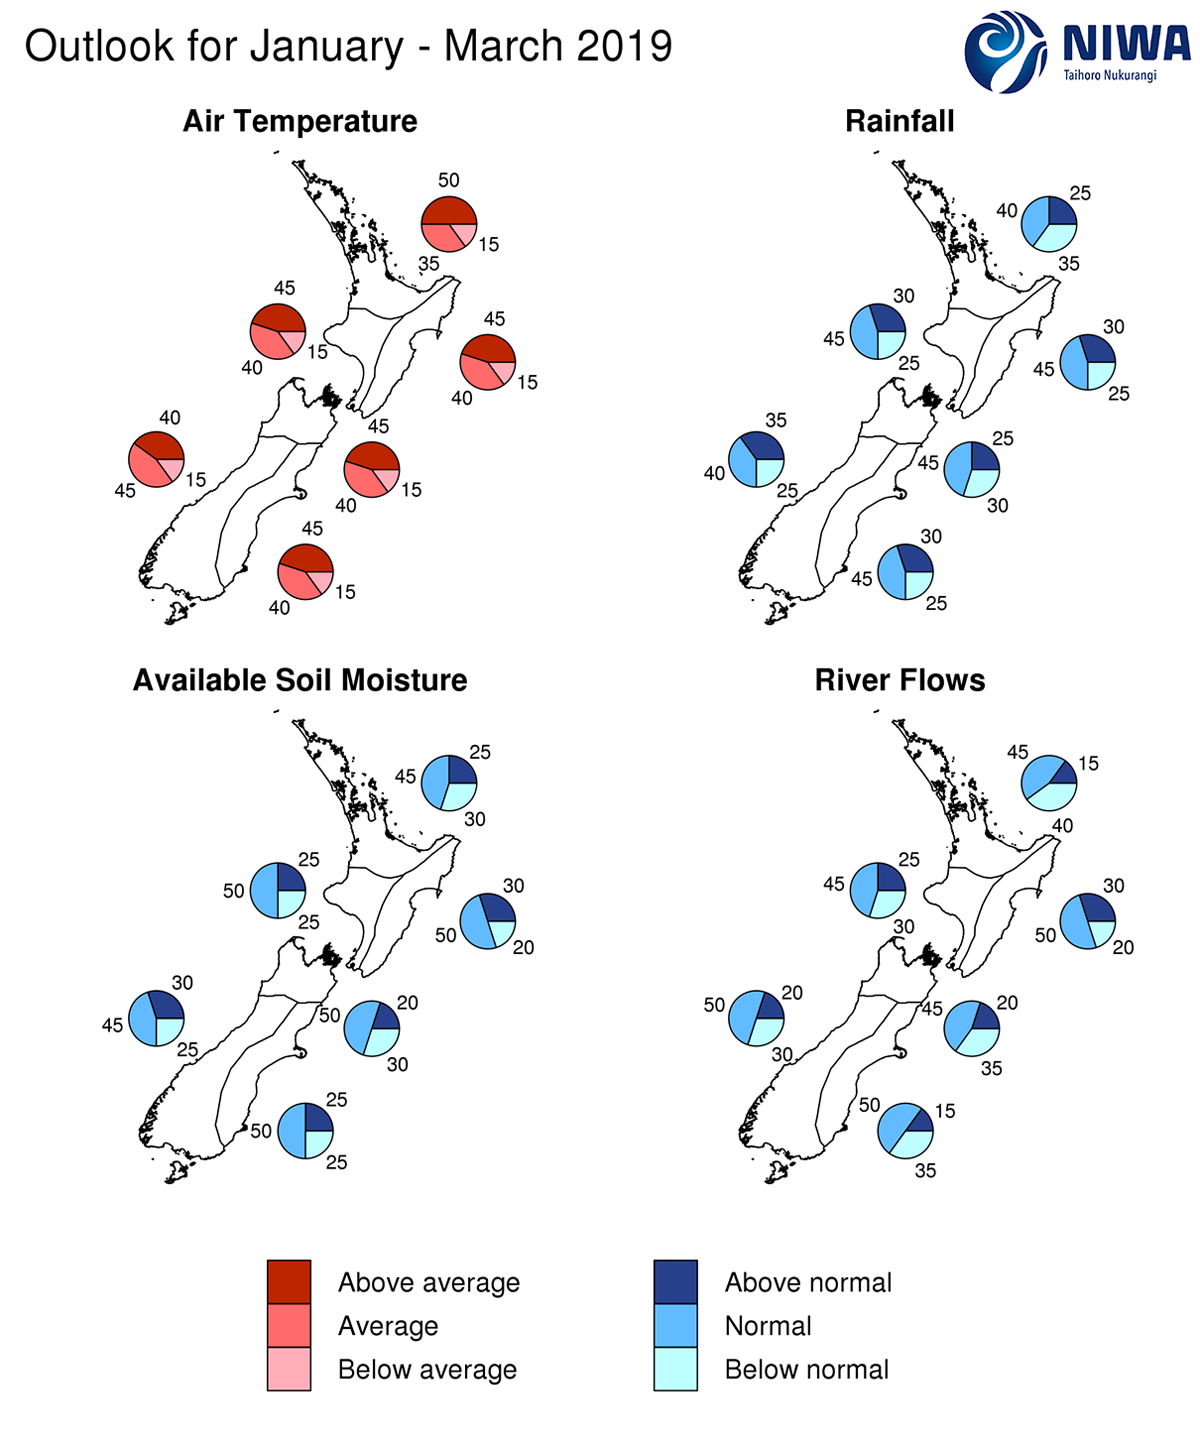
- January through March 2019 mean air temperatures are most likely to be above average for the north of the North Island and about equally likely to be near or above average for the remaining regions of New Zealand.
- During the January to March 2019 period, near normal rainfall is likely for most regions; however, the north of the North Island has about equal chances for below normal or near normal rainfall and the west of the South Island has about equal chances for above normal or near normal rainfall.
- While oceanic patterns in the tropical Pacific currently reflect weak El Niño conditions, the atmosphere still hasn’t coupled with the ocean.
- If this coupling does not eventuate, ocean anomalies in the Equatorial Pacific will have little relevance to New Zealand’s climate.
- Sea surface temperatures are currently much warmer than average around New Zealand and warmer conditions are forecast to persist. This is likely to be a dominant driver of New Zealand’s climate.
- For the current tropical cyclone season (November 2018 to April 2019), NIWA’s Southwest Pacific Tropical Cyclone Outlook indicates that the risk for New Zealand is near normal. On average, at least one ex-tropical cyclone passes within 550 km of New Zealand each year. Significant rainfall, damaging winds, and coastal damage can occur during these events.
January – March 2019 temperatures are forecast to be above average (50% chance) for the north of the North Island and above average or average (40 – 45 % chance) for all other regions of New Zealand.
January – March 2019 rainfall totals are forecast to be near normal (40% chance) or below normal (35% chance) for the north of the North Island and near normal (40% chance) or above normal (35% chance) for the west of the South Island. Near normal rainfall is most likely (45% chance) for all remaining regions of New Zealand.
January – March 2019 soil moisture levels and river flows are forecast to be in the near normal range (45 – 50% chance) in the South Island and for the west and east of the North Island. In the north of the North Island, near normal soil moisture levels are forecast (45% chance) and near normal or below normal flows are about equally likely (40 – 45% chance).
Regional predictions for the January – March 2019 season
Northland, Auckland, Waikato, Bay of Plenty
The table below shows the probabilities (or percent chances) for each of three categories: above average, near average, and below average. In the absence of any forecast guidance there would be an equal likelihood (33% chance) of the outcome being in any one of the three categories. Forecast information from local and global guidance models is used to indicate the deviation from equal chance expected for the coming three-month period, with the following outcomes the most likely (but not certain) for this region:
- Temperatures are most likely to be above average (50% chance).
- Rainfall totals are about equally likely to be near normal (40% chance) or below normal (35% chance).
- Soil moisture levels are most likely to be near normal (45% chance).
- River flows are about equally likely to be near normal (45% chance) or below normal (40% chance).
The full probability breakdown is:
|
|
Temperature |
Rainfall |
Soil moisture |
River flows |
|
Above average |
50 |
25 |
25 |
15 |
|
Near average |
35 |
40 |
45 |
45 |
|
Below average |
15 |
35 |
30 |
40 |
Central North Island, Taranaki, Whanganui, Manawatu, Wellington
Probabilities are assigned in three categories: above average, near average, and below average.
- Temperatures are about equally likely to be above average (45% chance) or near average (40% chance).
- Rainfall totals, soil moisture levels and river flows are mostly likely to be in the near normal range (45 – 50% chance).
The full probability breakdown is:
|
|
Temperature |
Rainfall |
Soil moisture |
River flows |
|
Above average |
45 |
30 |
25 |
25 |
|
Near average |
40 |
45 |
50 |
45 |
|
Below average |
15 |
25 |
25 |
30 |
Gisborne, Hawke’s Bay, Wairarapa
Probabilities are assigned in three categories: above average, near average, and below average.
- Temperatures are about equally likely to be above average (45% chance) or near average (40% chance).
- Rainfall totals, soil moisture levels and river flows are mostly likely to be in the near normal range (45 – 50% chance).
The full probability breakdown is:
|
|
Temperature |
Rainfall |
Soil moisture |
River flows |
|
Above average |
45 |
30 |
30 |
30 |
|
Near average |
40 |
45 |
50 |
50 |
|
Below average |
15 |
25 |
20 |
20 |
Tasman, Nelson, Marlborough, Buller
Probabilities are assigned in three categories: above average, near average, and below average.
- Temperatures are about equally likely to be above average (45% chance) or near average (40% chance).
- Rainfall totals, soil moisture levels and river flows are all mostly likely to be in the near normal range (45 – 50% chance).
The full probability breakdown is:
|
|
Temperature |
Rainfall |
Soil moisture |
River flows |
|
Above average |
45 |
25 |
20 |
20 |
|
Near average |
40 |
45 |
50 |
45 |
|
Below average |
15 |
30 |
30 |
35 |
West Coast, Alps and foothills, inland Otago, Southland
Probabilities are assigned in three categories: above average, near average, and below average.
- Temperatures are about equally likely to be near average (45% chance) or above average (40% chance).
- Rainfall totals are about equally likely to be near normal (40% chance) or above normal (35% chance).
- Soil moisture levels and river flows are most likely to be in the near normal range (45 – 50% chance).
The full probability breakdown is:
|
|
Temperature |
Rainfall |
Soil moisture |
River flows |
|
Above average |
40 |
35 |
30 |
20 |
|
Near average |
45 |
40 |
45 |
50 |
|
Below average |
15 |
25 |
25 |
30 |
Coastal Canterbury, east Otago
Probabilities are assigned in three categories: above average, near average, and below average.
- Temperatures are about equally likely to be above average (45% chance) or near average (40% chance).
- Rainfall totals, soil moisture levels and river flows are all mostly likely to be in the near normal range (45 – 50% chance).
The full probability breakdown is:
|
|
Temperature |
Rainfall |
Soil moisture |
River flows |
|
Above average |
45 |
30 |
25 |
15 |
|
Near average |
40 |
45 |
50 |
50 |
|
Below average |
15 |
25 |
25 |
35 |
Graphical representation of the regional probabilities
Background
Over the past month, sea surface temperatures (SSTs) in the central Pacific (NINO3.4 Index, 5oN-5oS, 170oW-120oW) have remained above normal with anomalies currently exceeding +0.8oC. This marks the fourth consecutive month SST anomalies in the central Pacific have exceeded 0.7oC, which meets NIWA’S technical oceanic definition for El Niño. However, the coupling between the ocean and the atmosphere, necessary for the development of the ENSO (El Niño – Southern Oscillation) phenomenon, has not eventuated. SSTs are also unusually warm in the western Pacific (west of the International Dateline), with the NINO4 index (5oN-5oS, 160oE-150oW) anomaly being greater than the NINO3.4 index with a value of +0.9oC. Consequently, the west-to-east SST anomaly gradient is weaker than what is usually recorded during an El Niño event, and is likely contributing to the atmosphere’s inability to couple with the ocean.
Warmer than average subsurface ocean waters persisted in the month of December 2018, and the latest available (ending 16 December 2018) 5-day averages from the tropical Pacific mooring array indicate anomalies exceeding +4oC between 150oW and 130oW. However, the integrated heat content anomalies (over the top 300m of the ocean) in the equatorial Pacific are weaker than they were at the beginning of November 2018, with anomalies exceeding 1.5oC now restricted to the eastern Pacific between 130oW and 115oW.
While the oceanic anomalies are mostly consistent with patterns observed during weak to moderate El Niño events, the atmosphere has not yet responded and almost all indicators are well under the conventional El Niño thresholds. The latest Southern Oscillation Index (SOI) is currently (December 2018) positive with a value of +0.8 (i.e., close to La Niña conventional thresholds). The trade winds have been slightly weaker than normal (westerly anomalies) but not persistently so, and the convection and rainfall anomaly patterns are inconsistent with a traditional El Niño, with enhanced convective activity and rainfall in the western Pacific.
The consensus from international models is for weak to moderate oceanic El Niño conditions to persist over next three-month period (96% chance over January – March 2019), but it is unclear whether the atmosphere will eventually catch up with the ocean and lead to a fully coupled El Niño – Southern Oscillation (ENSO) phenomenon. If this coupling does not eventuate, then SST anomalies in the equatorial Pacific will have little relevance to the regional climate anomalies over and around New Zealand.
New Zealand’s coastal waters are currently much warmer than average for the time of year, with coastal SST anomalies exceeding +1oC for all regions of New Zealand. Argo temperature profiles indicate that above normal subsurface temperatures around New Zealand have intensified during December 2018. Much warmer than normal ocean temperatures are also affecting large areas of the Tasman Sea. The dynamical models are consistent in predicting above to well above normal regional ocean temperatures during January – March 2019. In the absence of a coupled ENSO event, these regional SSTs are likely to be a dominant driver of New Zealand’s climate over the next three months period.
Download
Seasonal climate outlook - January - February 2019 [3.5MB PDF]
Contacts
Chris Brandolino, Principal Scientist – Forecasting, NIWA National Climate Centre
Tel (09) 375 6335, Mobile (027) 886 0014
Dr Brett Mullan, Principal Scientist, NIWA National Climate Centre
Tel (04) 386 0508