El Niño conditions in the tropical Pacific weakened further during April 2016, with sea surface temperatures now typically only about +1oC warmer than normal.
Moreover, cooler than normal sub-surface waters have spread eastward from the western Pacific, and temperatures are more than 3oC below normal between 50 and 100m depth east of 160oW. These changes in sub-surface temperatures mean the tropical Pacific is poised to make a rapid transition into La Niña conditions.
International guidance indicates that neutral ENSO conditions are very likely (76% chance) over the next three month period (May – July 2016), as a whole. The likelihood of La Niña development increases into early spring, with a 52% chance over August – October 2016, and a further increase to 60% over November 2016 – January 2017. Forecast models indicate it is very unlikely (less than 10% chance) for a return of El Niño conditions during the rest of 2016. Because of the good chance of La Niña forming later in 2016, NIWA is on a La Niña “Watch”.
For May – July 2016, above normal pressure is forecast to the north and northeast of New Zealand. This circulation pattern is likely to be accompanied by anomalous north-westerly wind flow.
Outlook Summary
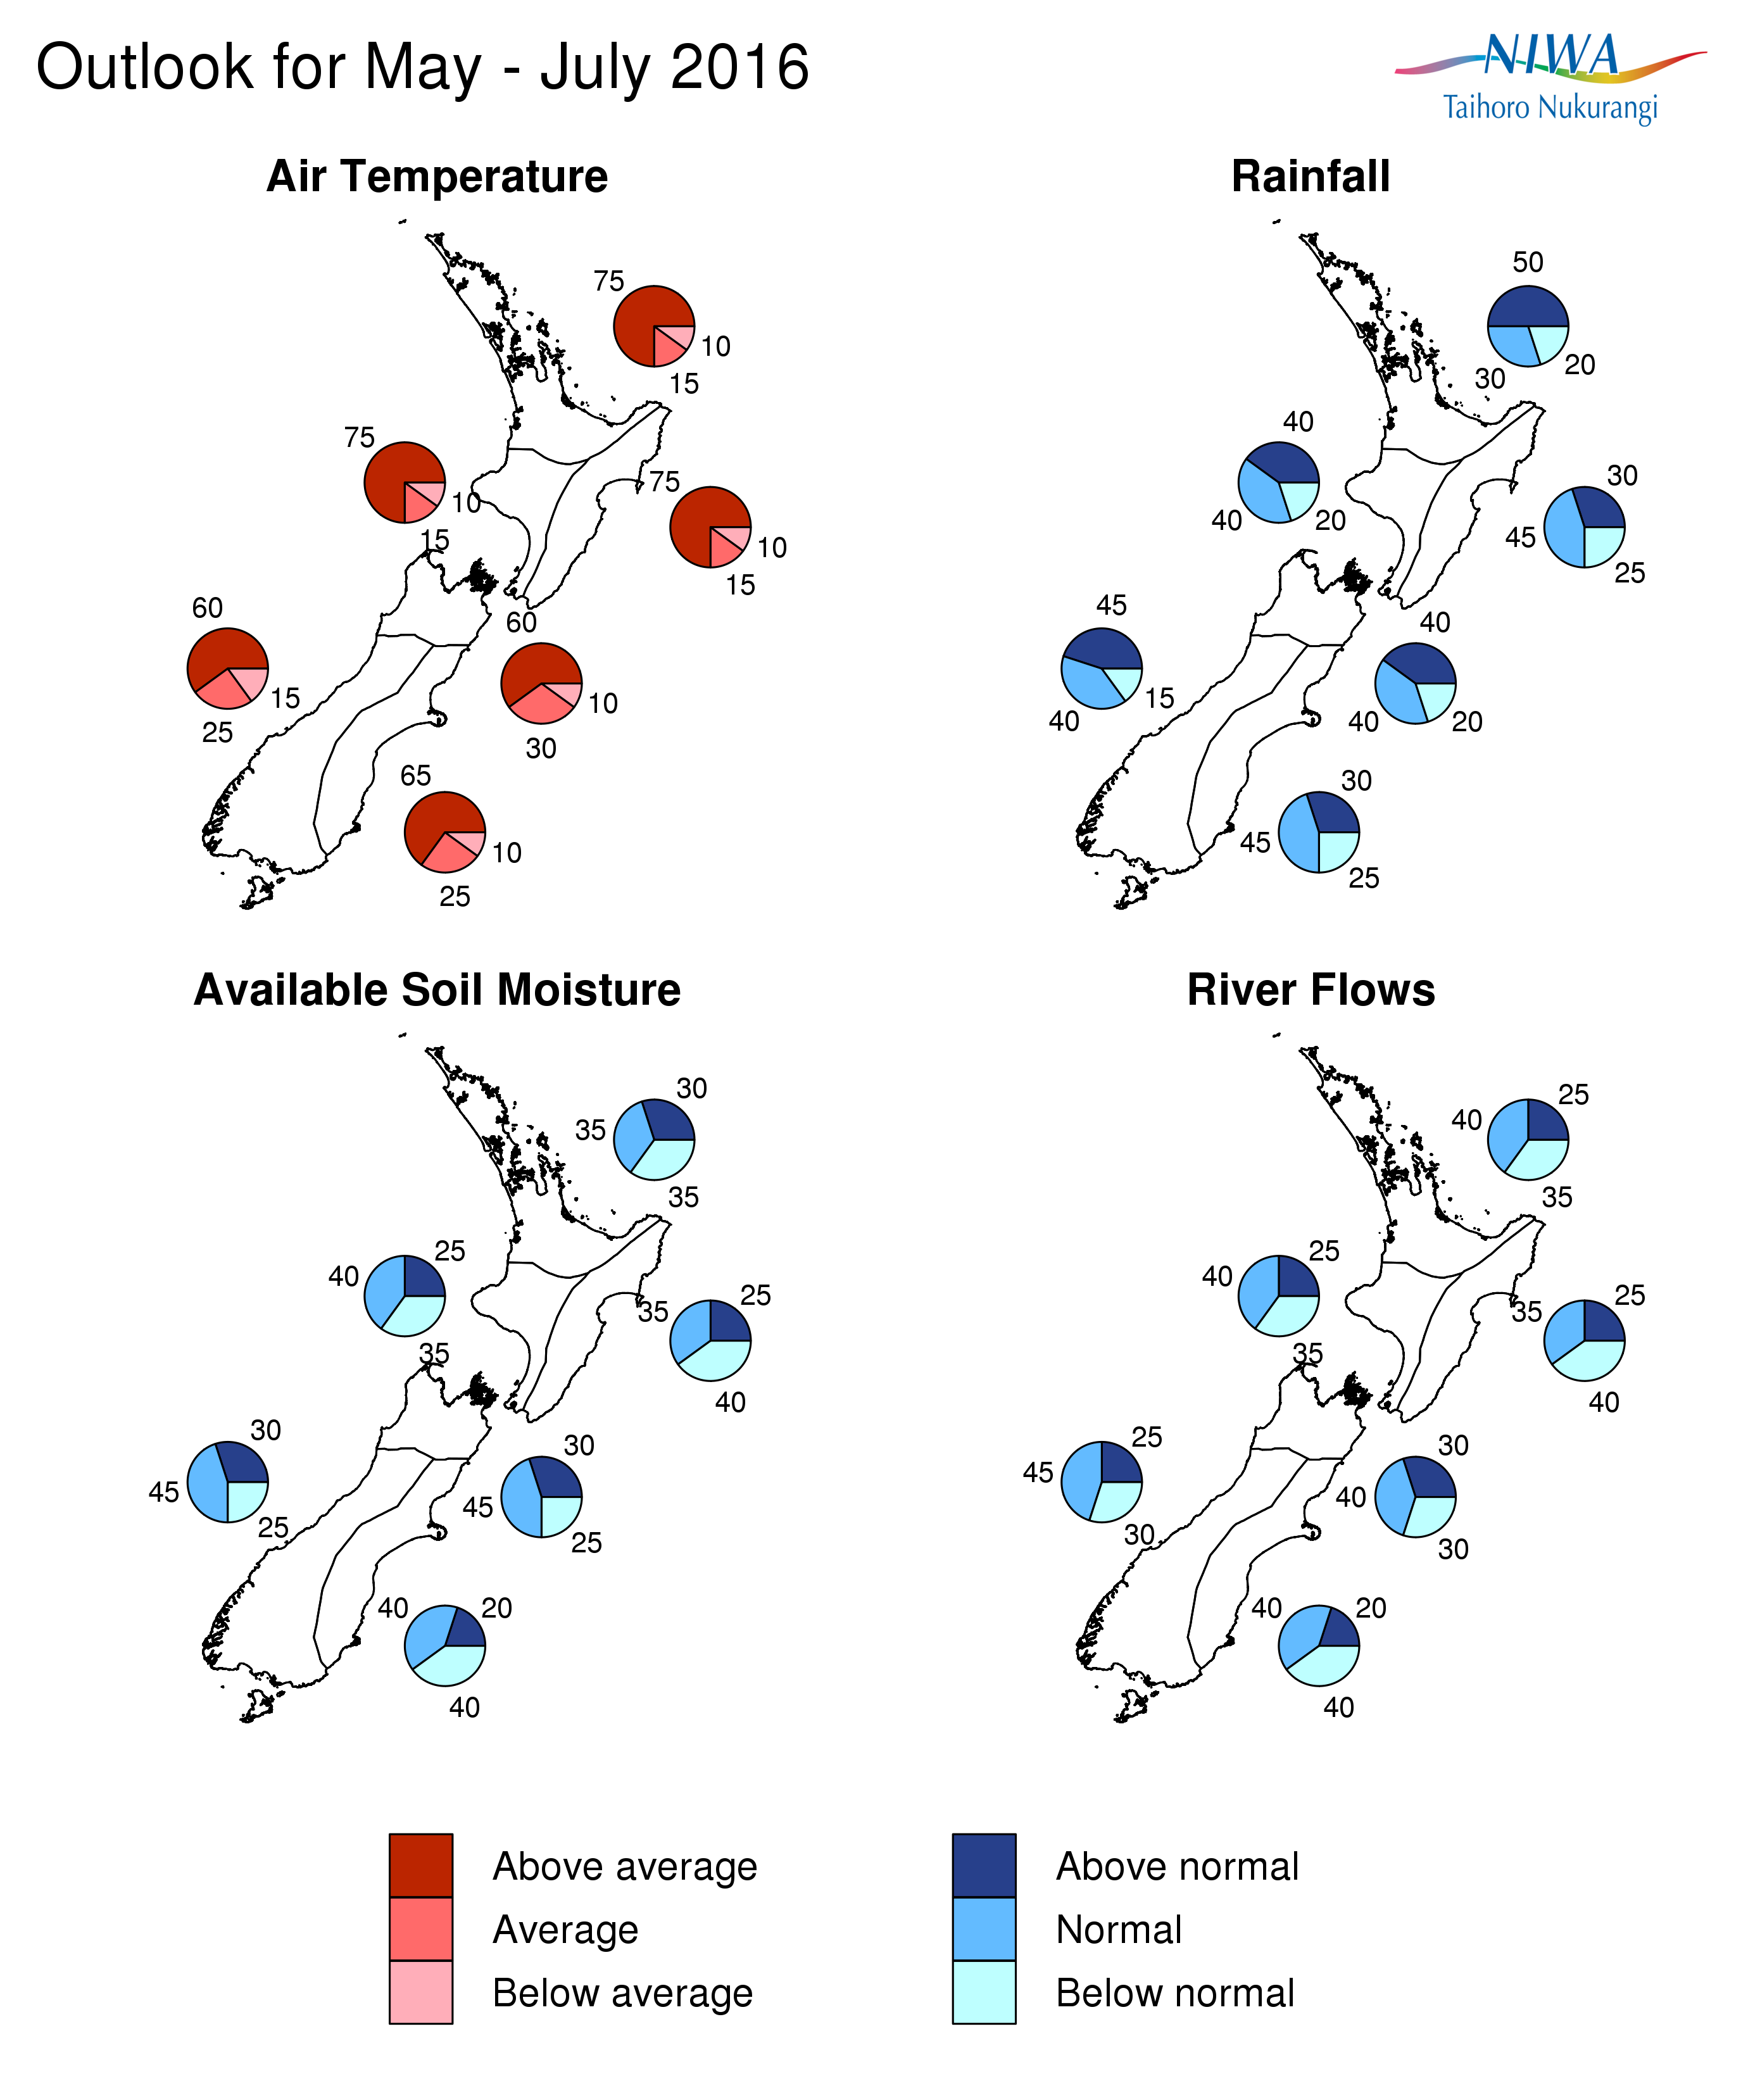
May – July 2016 temperatures are very likely to be above average (60-75% chance) in all regions of the country. Nevertheless, June and July are winter months, and frosts will occur from time to time in cooler locations. Sea surface temperatures are forecast to be above normal over the next three months, especially to the west of New Zealand.
May – July 2016 rainfall is likely to be above normal (50% chance) in the north of the North Island, likely to be near normal or above normal (40-45% chance) in the west of both islands and in Nelson-Marlborough, and likely to be in the near normal range (45% chance) in the east of both islands.
May – July 2016 soil moisture levels and river flows are likely to be near normal or below normal (35-40% chance) in all North Island regions and in the east of the South Island. In the remainder of the South Island, soil moisture levels and river flows are likely to be in the near normal range (40-45% chance).
Regional predictions for the May – July 2016 season
Northland, Auckland, Waikato, Bay of Plenty
The table below shows the probabilities (or percent chances) for each of three categories: above average, near average, and below average. In the absence of any forecast guidance there would be an equal likelihood (33% chance) of the outcome being in any one of the three categories. Forecast information from local and global guidance models is used to indicate the deviation from equal chance expected for the coming three month period, with the following outcomes the most likely (but not certain) for this region:
- Temperatures are very likely to be above average (75% chance).
- Rainfall totals are most likely to be above normal (50% chance).
- Soil moisture levels and river flows are about equally likely (35-40% chance) to be near or below normal.
The full probability breakdown is:
|
Temperature |
Rainfall |
Soil moisture |
River flows |
|
|
Above average |
75 |
50 |
30 |
25 |
|
Near average |
15 |
30 |
35 |
40 |
|
Below average |
10 |
20 |
35 |
35 |
Central North Island, Taranaki, Wanganui, Manawatu, Wellington
Probabilities are assigned in three categories: above average, near average, and below average.
- Temperatures are very likely to be above average (75% chance).
- Rainfall totals are equally likely to be near normal (40% chance) or above normal (40% chance).
- Soil moisture levels and river flows are about equally likely to be near normal (40% chance) or below normal (35% chance).
The full probability breakdown is:
|
Temperature |
Rainfall |
Soil moisture |
River flows |
|
|
Above average |
75 |
40 |
25 |
25 |
|
Near average |
15 |
40 |
40 |
40 |
|
Below average |
10 |
20 |
35 |
35 |
Gisborne, Hawke’s Bay, Wairarapa
Probabilities are assigned in three categories: above average, near average, and below average.
- Temperatures are very likely to be above average (75% chance).
- Rainfall totals are most likely to be in the near normal range (45% chance).
- Soil moisture levels and river flows are about equally likely to be below normal (40% chance) or near normal (35% chance).
The full probability breakdown is:
|
Temperature |
Rainfall |
Soil moisture |
River flows |
|
|
Above average |
75 |
30 |
25 |
25 |
|
Near average |
15 |
45 |
35 |
35 |
|
Below average |
10 |
25 |
40 |
40 |
Nelson, Marlborough, Buller
Probabilities are assigned in three categories: above average, near average, and below average.
- Temperatures are very likely to be above average (60% chance).
- Rainfall totals are equally likely to be normal (40% chance) or above normal (40% chance).
- Soil moisture levels and river flows are about equally likely to be in the near normal range (40 to 45% chance).
The full probability breakdown is:
|
Temperature |
Rainfall |
Soil moisture |
River flows |
|
|
Above average |
60 |
40 |
30 |
30 |
|
Near average |
30 |
40 |
45 |
40 |
|
Below average |
10 |
20 |
25 |
30 |
West Coast, Alps and foothills, inland Otago, Southland
Probabilities are assigned in three categories: above average, near average, and below average.
- Temperatures are very likely to be above average (60% chance).
- Rainfall totals are about equally likely to be above normal (45% chance) or near normal (40% chance).
- Soil moisture levels and river flows are most likely to be in the near normal range (45% chance).
The full probability breakdown is:
|
Temperature |
Rainfall |
Soil moisture |
River flows |
|
|
Above average |
60 |
45 |
30 |
25 |
|
Near average |
25 |
40 |
45 |
45 |
|
Below average |
15 |
15 |
25 |
30 |
Coastal Canterbury, east Otago
Probabilities are assigned in three categories: above average, near average, and below average.
- Temperatures are very likely to be above average (65% chance).
- Rainfall totals are most likely to be near normal (45% chance).
- Soil moisture levels and river flows are equally likely to be normal (40% chance) or below normal (40% chance).
The full probability breakdown is:
|
Temperature |
Rainfall |
Soil moisture |
River flows |
|
|
Above average |
65 |
30 |
20 |
20 |
|
Near average |
25 |
45 |
40 |
40 |
|
Below average |
10 |
25 |
40 |
40 |
Graphical representation of the regional probabilities
El Niño conditions in the tropical Pacific weakened further during April 2016, with sea surface temperatures now typically only about +1oC warmer than normal. Warm sub-surface ocean temperature anomalies across the equatorial Pacific have continued to weaken and shoal, and now barely exceed +1oC in the first 50m of the ocean around 150oW. Moreover, cooler than normal sub-surface waters have spread eastward from the western Pacific, and temperatures are more than 3oC below normal between 50 and 100m depth east of 160oW. Heat content anomalies (integrated over the first 300 meters of the ocean) are now negative across the entire equatorial Pacific. These changes in sub-surface temperatures mean the tropical Pacific is poised to make a rapid transition into La Niña conditions.
Enhanced convective activity and rainfall near and east of the Dateline (usually associated with El Niño events) weakened in April, and the strong westerly wind anomalies (weaker easterly trade-winds) that dominated the western and central Pacific earlier in the year have now almost dissipated. Conversely, the Southern Oscillation Index (SOI) actually intensified (more negative) during April and is now at about -1.8, compared to -0.4 for March as a whole.
International guidance indicates that neutral ENSO (El Nino–Southern Oscillation) conditions are very likely (76% chance) over the next three month period (May – July 2016), as a whole. The likelihood of La Niña development increases into early spring, with a 52% chance over August – October 2016, and a further increase to 60% over November 2016 – January 2017. Forecast models indicate it is very unlikely (less than 10% chance) for a return of El Niño conditions during the rest of 2016. Thus, NIWA is on a La Niña “Watch”; future Outlooks will update the situation.
Waters surrounding New Zealand are exceptionally warm for this time of year, and ocean models suggest they will remain warmer than normal through May – July 2016. Given the higher moisture source from the warmer surface waters, together with more troughs and low pressure systems that typically enter the Tasman Sea in the winter season, it is possible that New Zealand will experience more severe storms than usual this winter.
To find out more about normal conditions for this outlook period, refer to this section of our website, where daily updates on climate maps are available.
Contact
For comment, please contact:
Chris Brandolino Principal Scientist – Forecasting NIWA National Climate Centre Tel (09) 375 6335 Mobile (027) 886 0014
Dr Brett Mullan Principal Scientist NIWA National Climate Centre Tel (04) 386 0508 Mobile (027) 294 1169.
Notes to reporters and editors
- NIWA’s outlooks indicate the likelihood of climate conditions being at, above, or below average for the season as a whole. They are not ‘weather forecasts’. It is not possible to forecast precise weather conditions three months ahead of time.
- The outlooks are the result of the expert judgment of NIWA’s climate scientists. They take into account observations of atmospheric and ocean conditions and output from global and local climate models. The presence of El Niño or La Niña conditions and the sea surface temperatures around New Zealand can be a useful indicator of likely overall climate conditions for a season.
- The outlooks state the probability for above average conditions, near average conditions, and below average conditions for rainfall, temperature, soil moisture, and river flows. For example, for winter (June–July–August) 2007, for all the North Island, we assigned the following probabilities for temperature: · Above average: 60 per cent · Near average: 30 per cent · Below average: 10 per cent We therefore concluded that above average temperatures were very likely.
- This three-way probability means that a random choice would be correct only 33 per cent (or one-third) of the time. It would be like randomly throwing a dart at a board divided into three equal parts, or throwing a dice with three numbers on it. An analogy with coin tossing (a two-way probability) is not correct.
- A 50 per cent ‘hit rate’ is substantially better than guesswork, and comparable with the skill level of the best overseas climate outlooks. See, for example, analysis of global outlooks issued by the International Research Institute for Climate and Society based in the US published in the Bulletin of the American Meteorological Society (Goddard, L., A. G. Barnston, and S. J. Mason, 2003: Evaluation of the IRI’s “net assessment” seasonal climate forecasts 1997–2001. Bull. Amer. Meteor. Soc., 84, 1761–1781).
- Each month, NIWA publishes an analysis of how well its outlooks perform. This is available online and is sent to about 3500 recipients of NIWA’s newsletters, including many farmers. See www.niwa.co.nz/our-science/climate/publications/all/cu
- All outlooks are for the three months as a whole. There will inevitably be wet and dry days, and hot and cold days, within a season. The exact range in temperature and rainfall within each of the three categories varies with location and season. However, as a guide, the “near average” or middle category for the temperature predictions includes deviations up to ±0.5°C for the long-term mean, whereas for rainfall the “near normal” category lies between approximately 80 per cent and 115 per cent of the long-term mean.
- The seasonal climate outlooks are an output of a scientific research programme, supplemented by NIWA’s Capability Funding. NIWA does not have a government contract to produce these outlooks.
- Where probabilities are within 5% of one another, the term “about equally” is used.