Current climate: May 2017
May 2017 was characterised by mean sea level air pressures that were higher than normal over and to the southwest of New Zealand. This resulted in more easterly winds than normal over the North Island, and these winds delivered more rainfall than normal to many eastern and inland parts of the North Island. In the South Island, the air pressure anomaly for the month resulted in more southerly winds than normal.
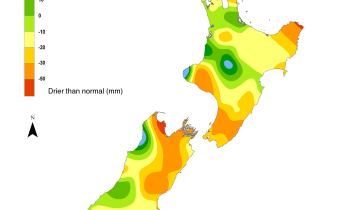
Rainfall
Rainfall was well below normal (< 50%) for many eastern and inland parts of Canterbury, as well as Milford Sound. Below normal rainfall (50-79%) was recorded in Otago, southwestern parts of Southland and the Far North. In contrast, rainfall was well above normal (>149%) for the central North Island and Tasman, and above normal (120-149%) for parts of Nelson, Marlborough, Manawatu, Gisborne and Bay of Plenty.
Temperature
May temperatures were below average (-0.51 to -1.20°C) for eastern and inland parts of the South Island, southern Hawke’s Bay and Wairarapa. Pockets of well below average temperatures (< -1.20 °C) were observed in Tasman, south Canterbury, Mt Cook and southern Central Otago. May temperatures were typically near average (-0.50°C to +0.50°C) for the remainder of the country.
Sunshine
Sunshine was well above normal (> 125%) in southeastern parts of Otago, the Southern Lakes, and Taumarunui. Above normal sunshine (110-125%) was recorded in parts of Northland, Auckland, southern Hawke’s Bay, coastal Wairarapa, Marlborough and the Mackenzie Country. Sunshine was typically near normal (90-109%) for the remainder of the country.
Soil Moisture
As at 1 June 2017, soil moisture levels were below normal for the time of year for large parts of Southland and inland Otago. Soil moisture levels were above normal for eastern parts of New Zealand, especially in Marlborough.