
Drought indicator charts
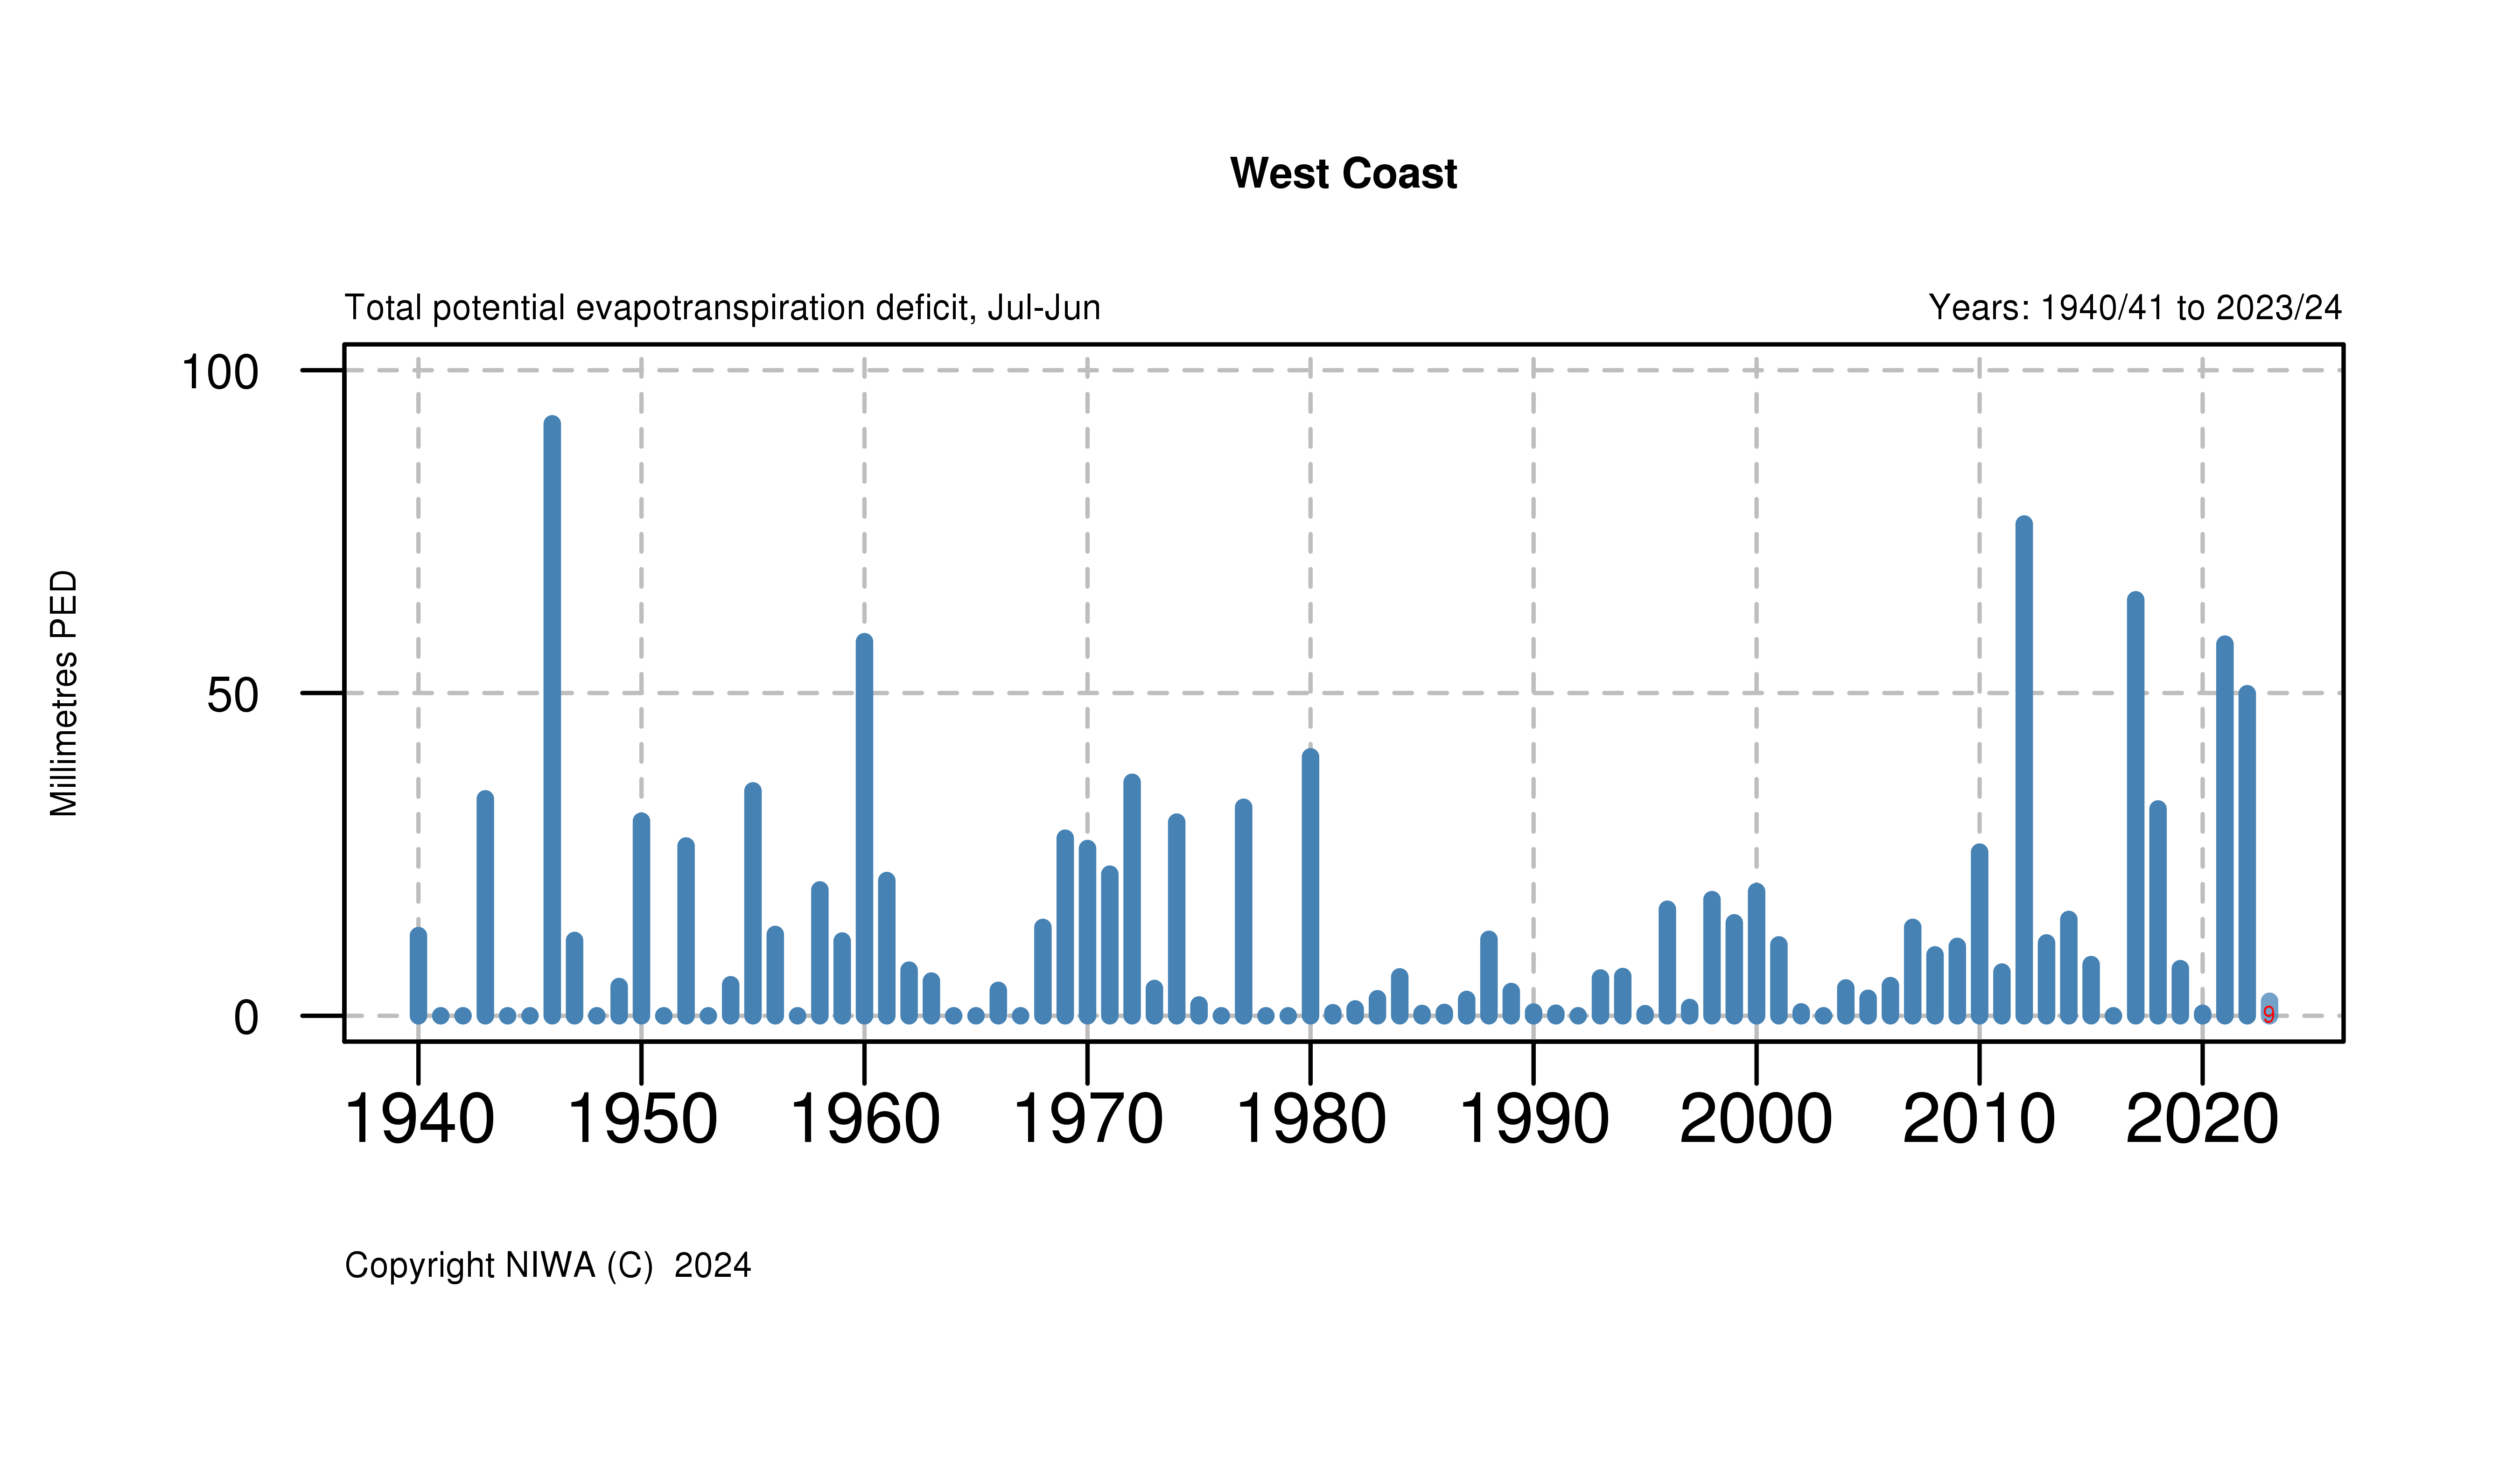
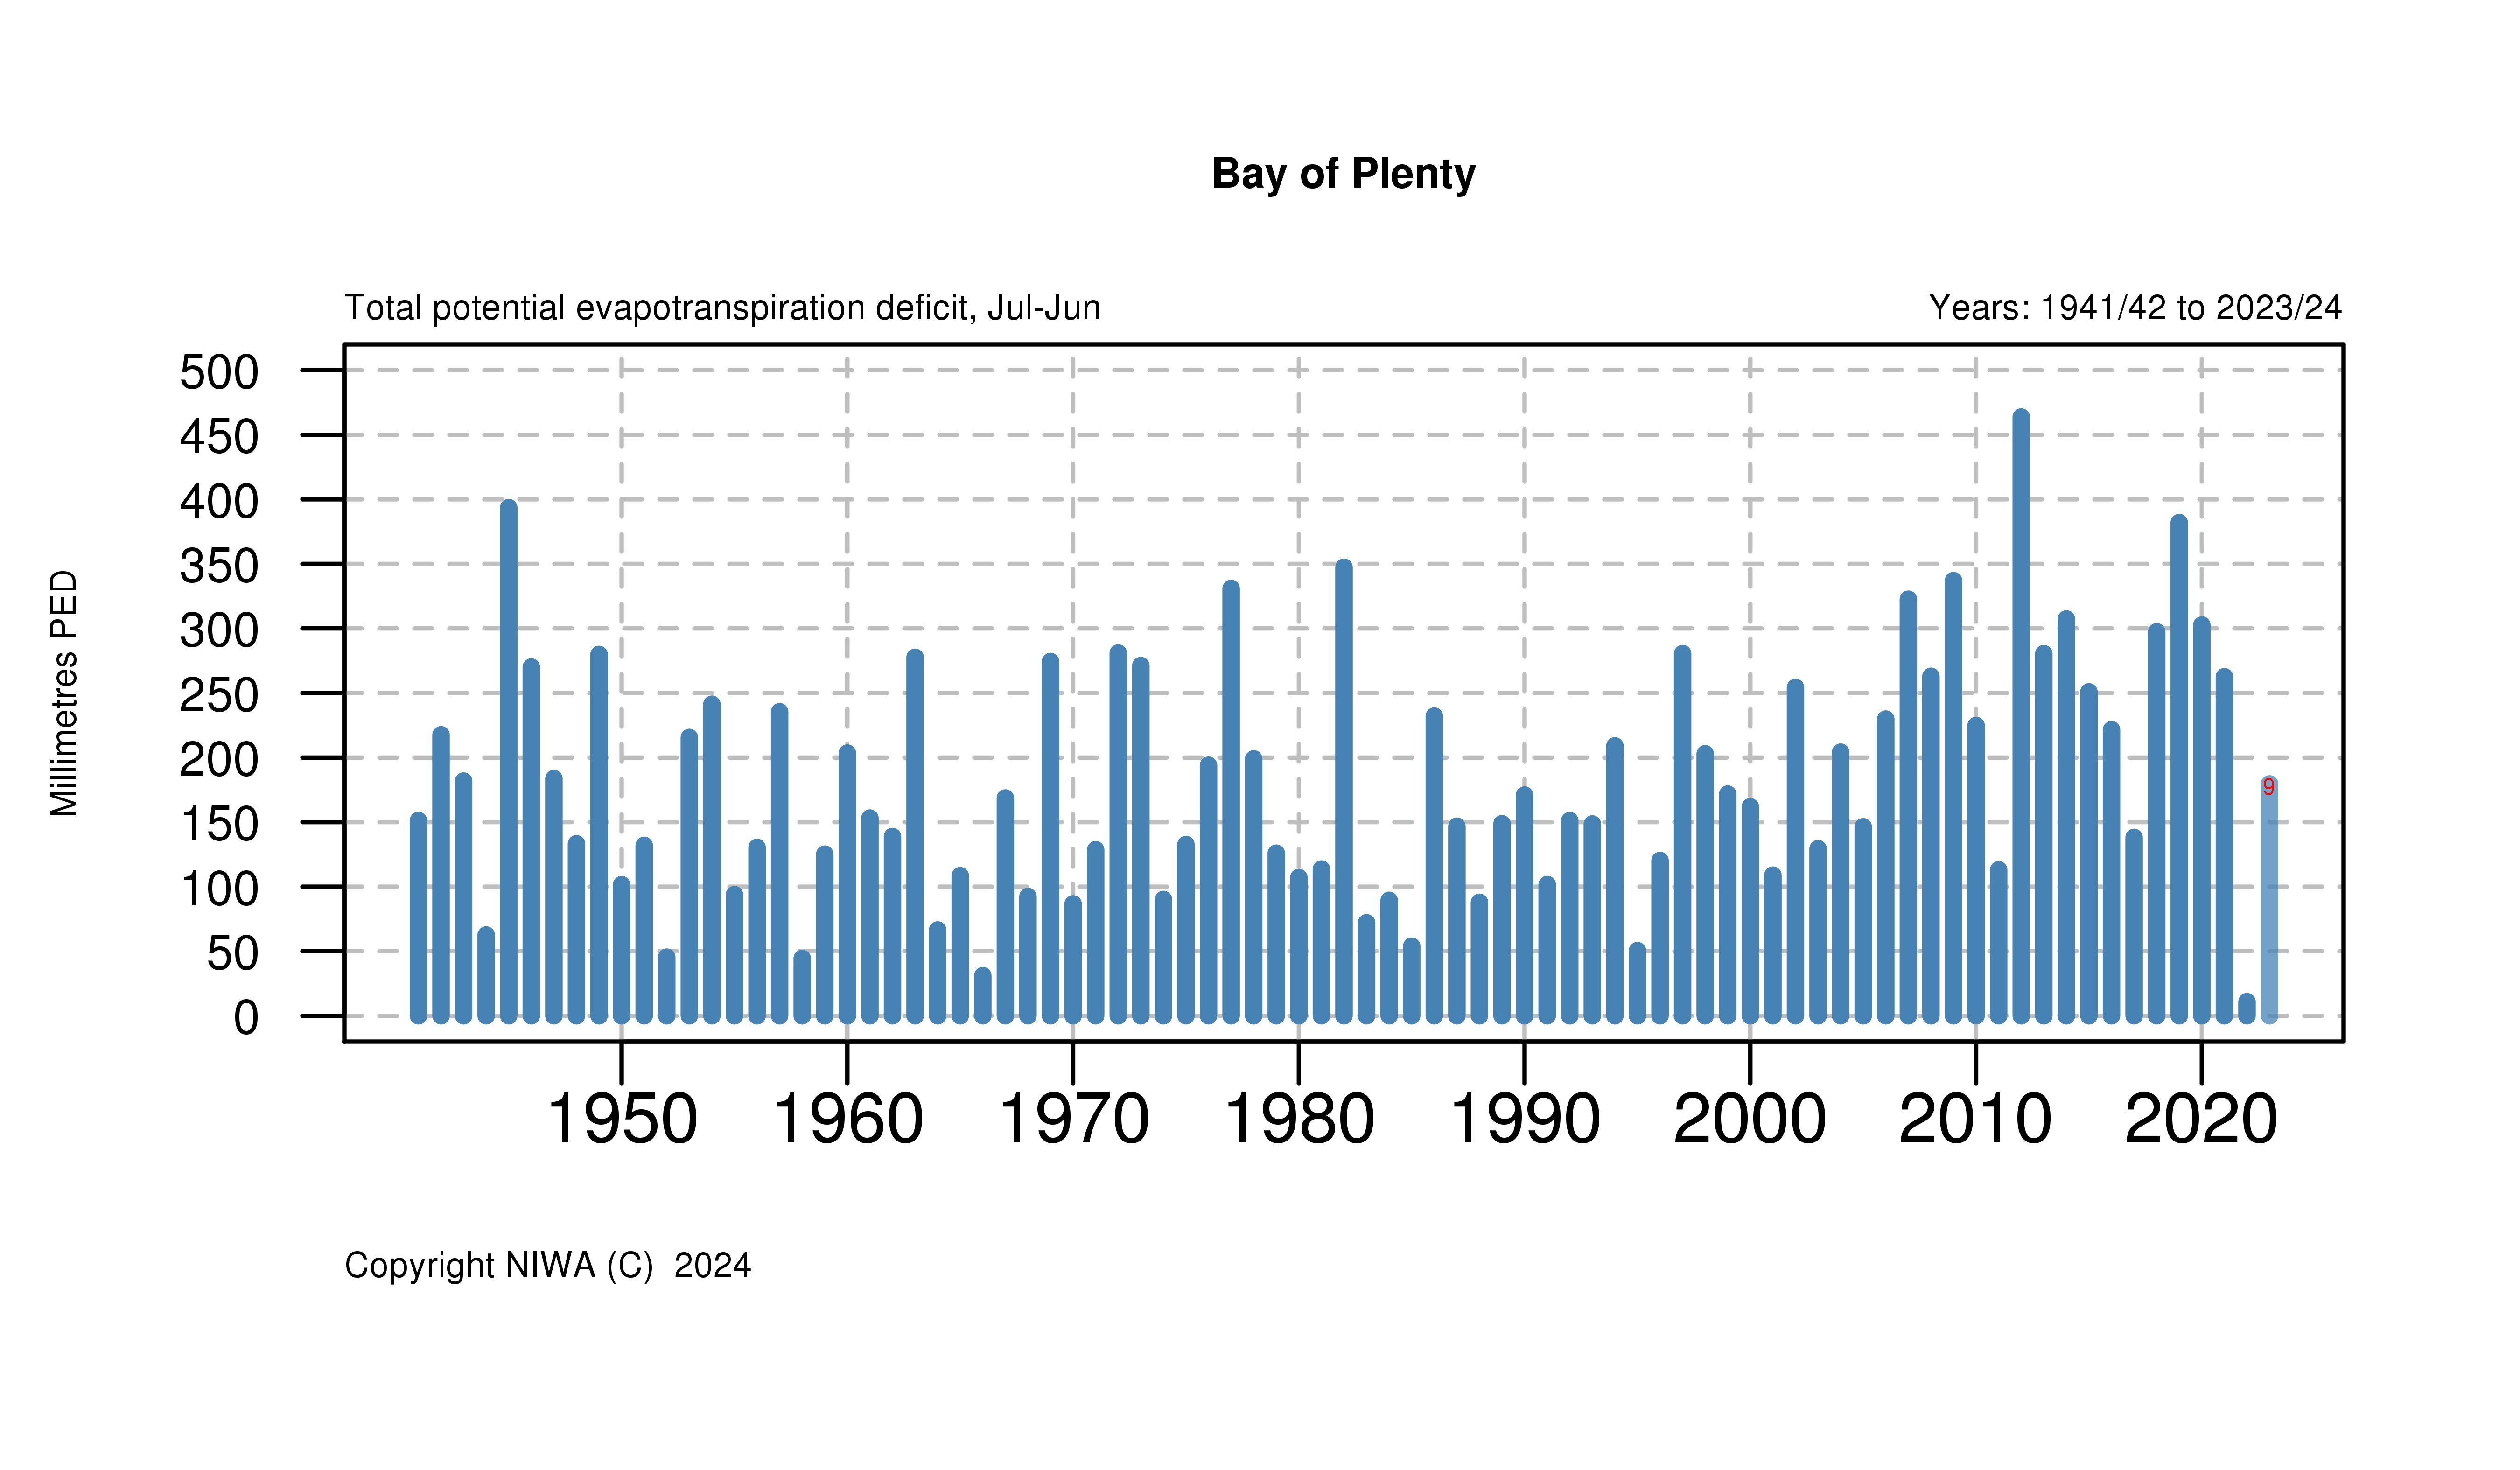
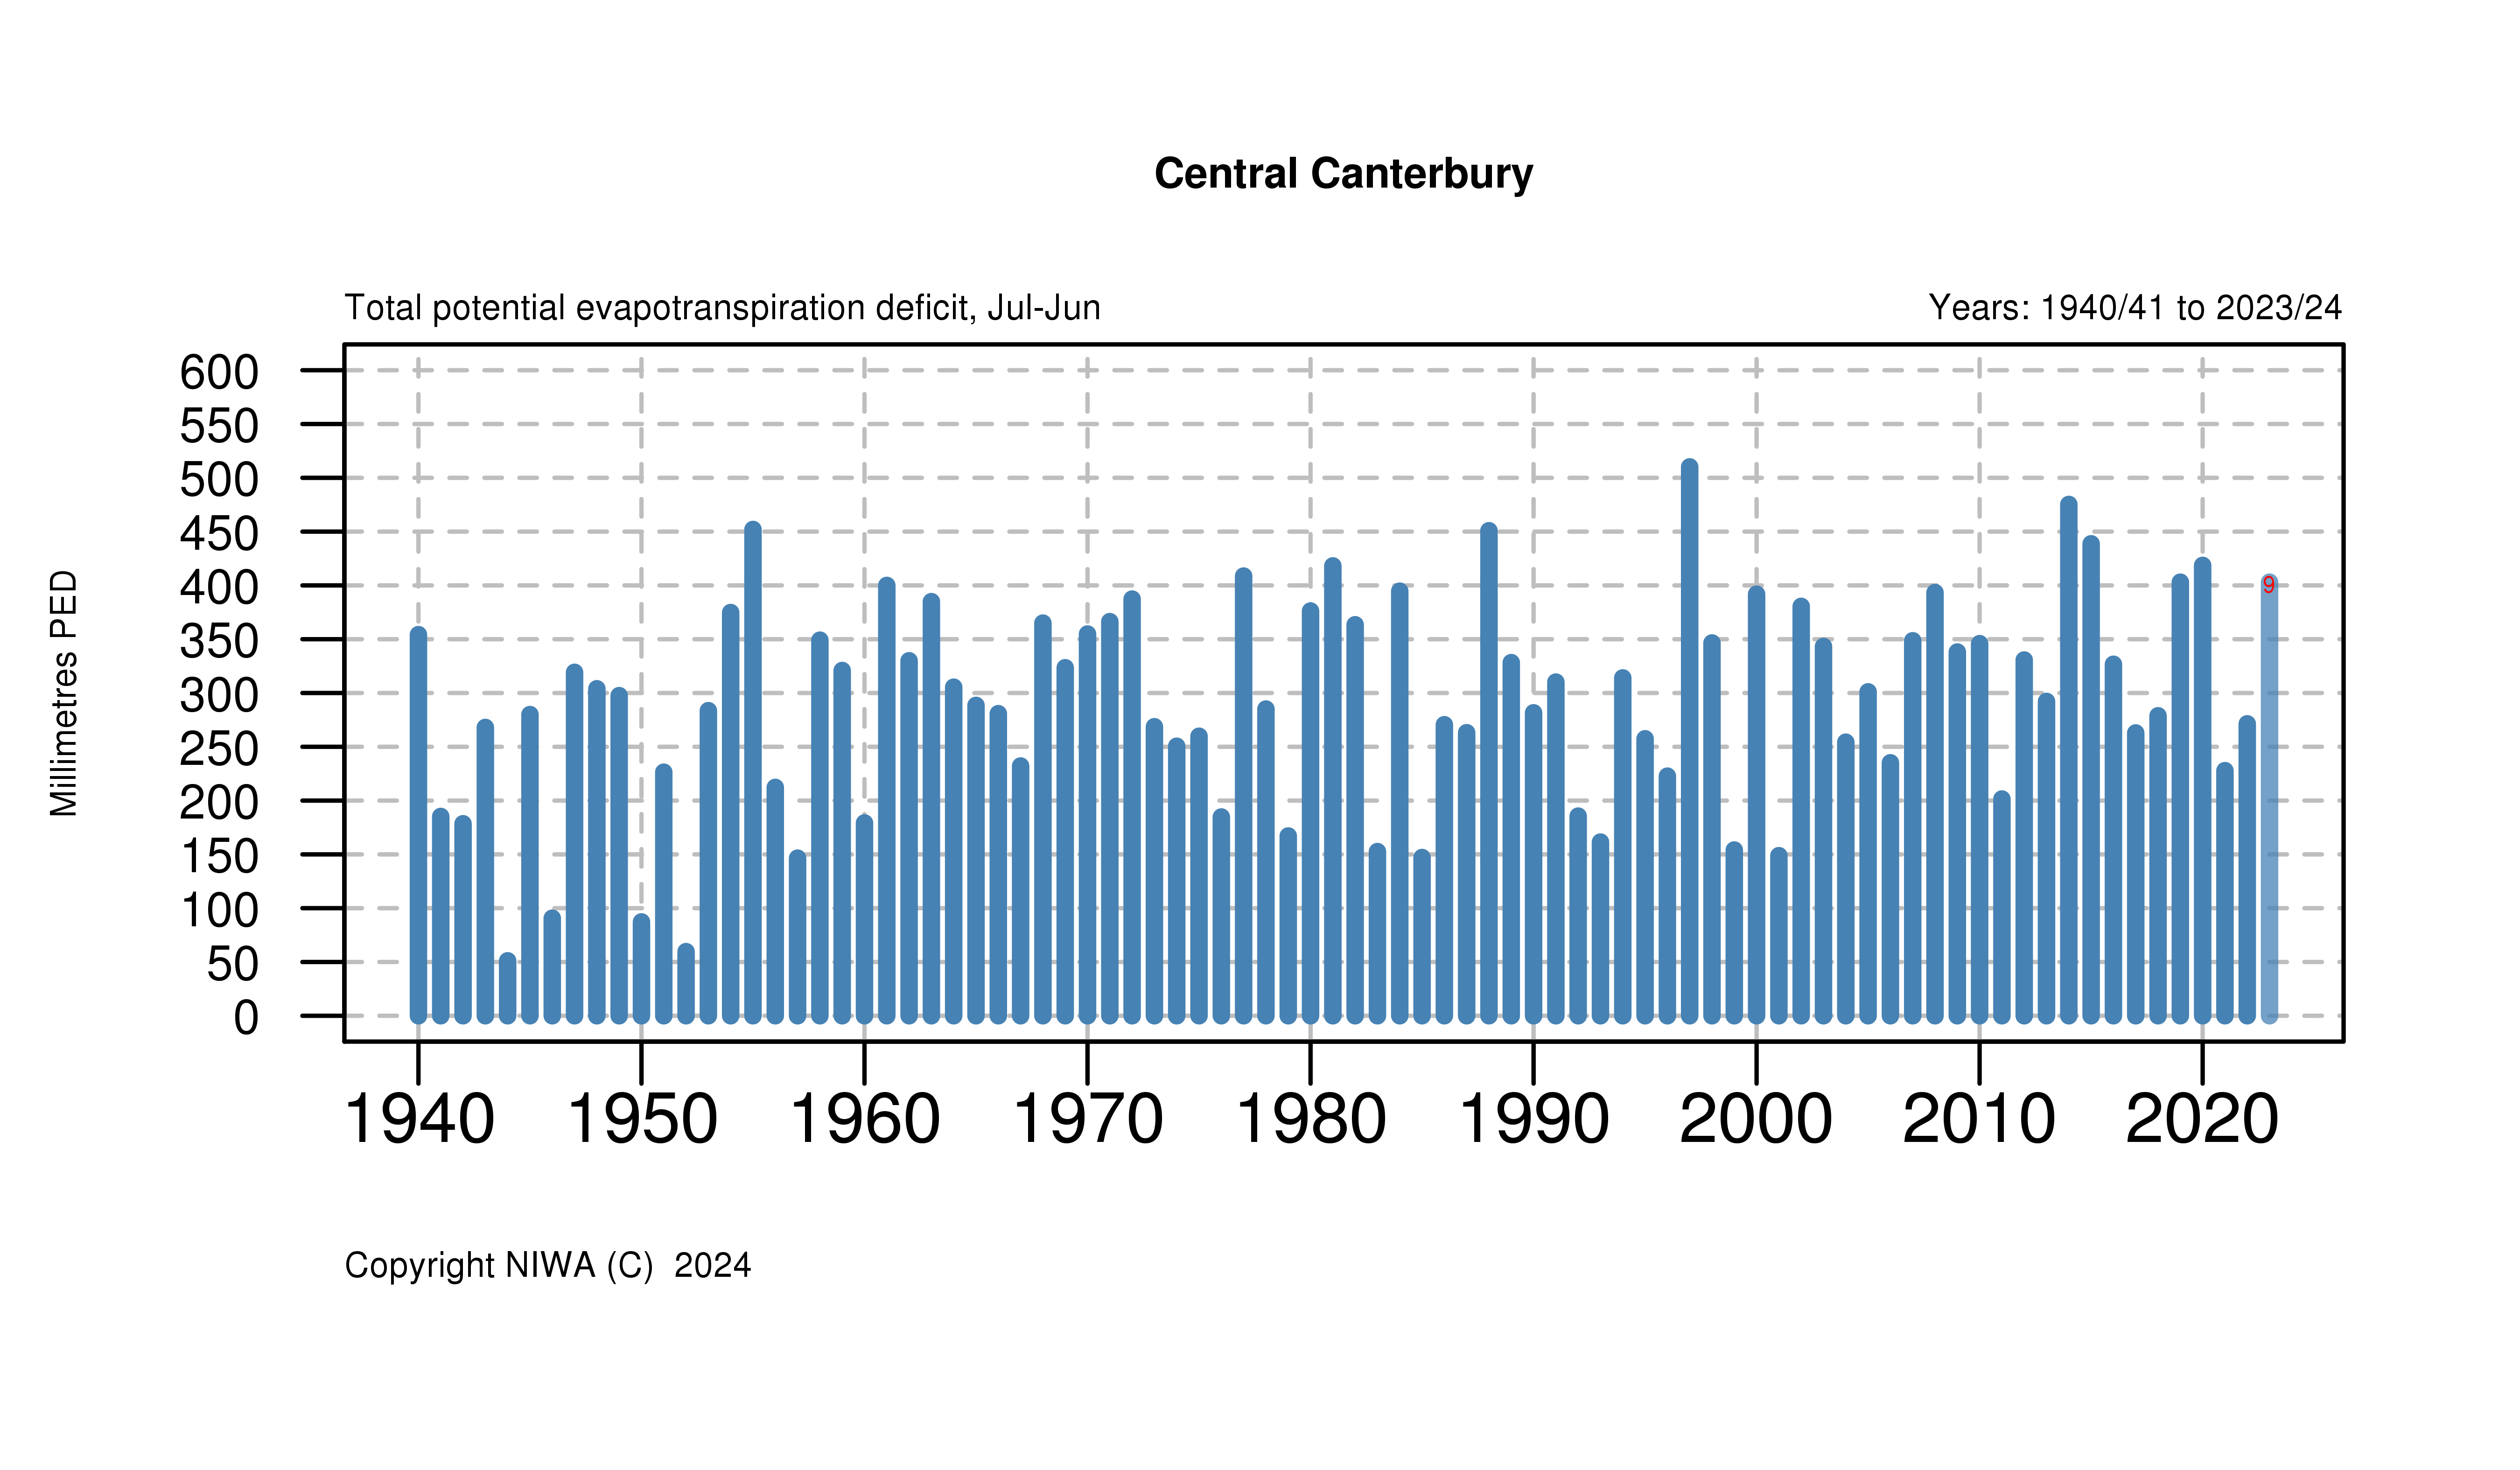
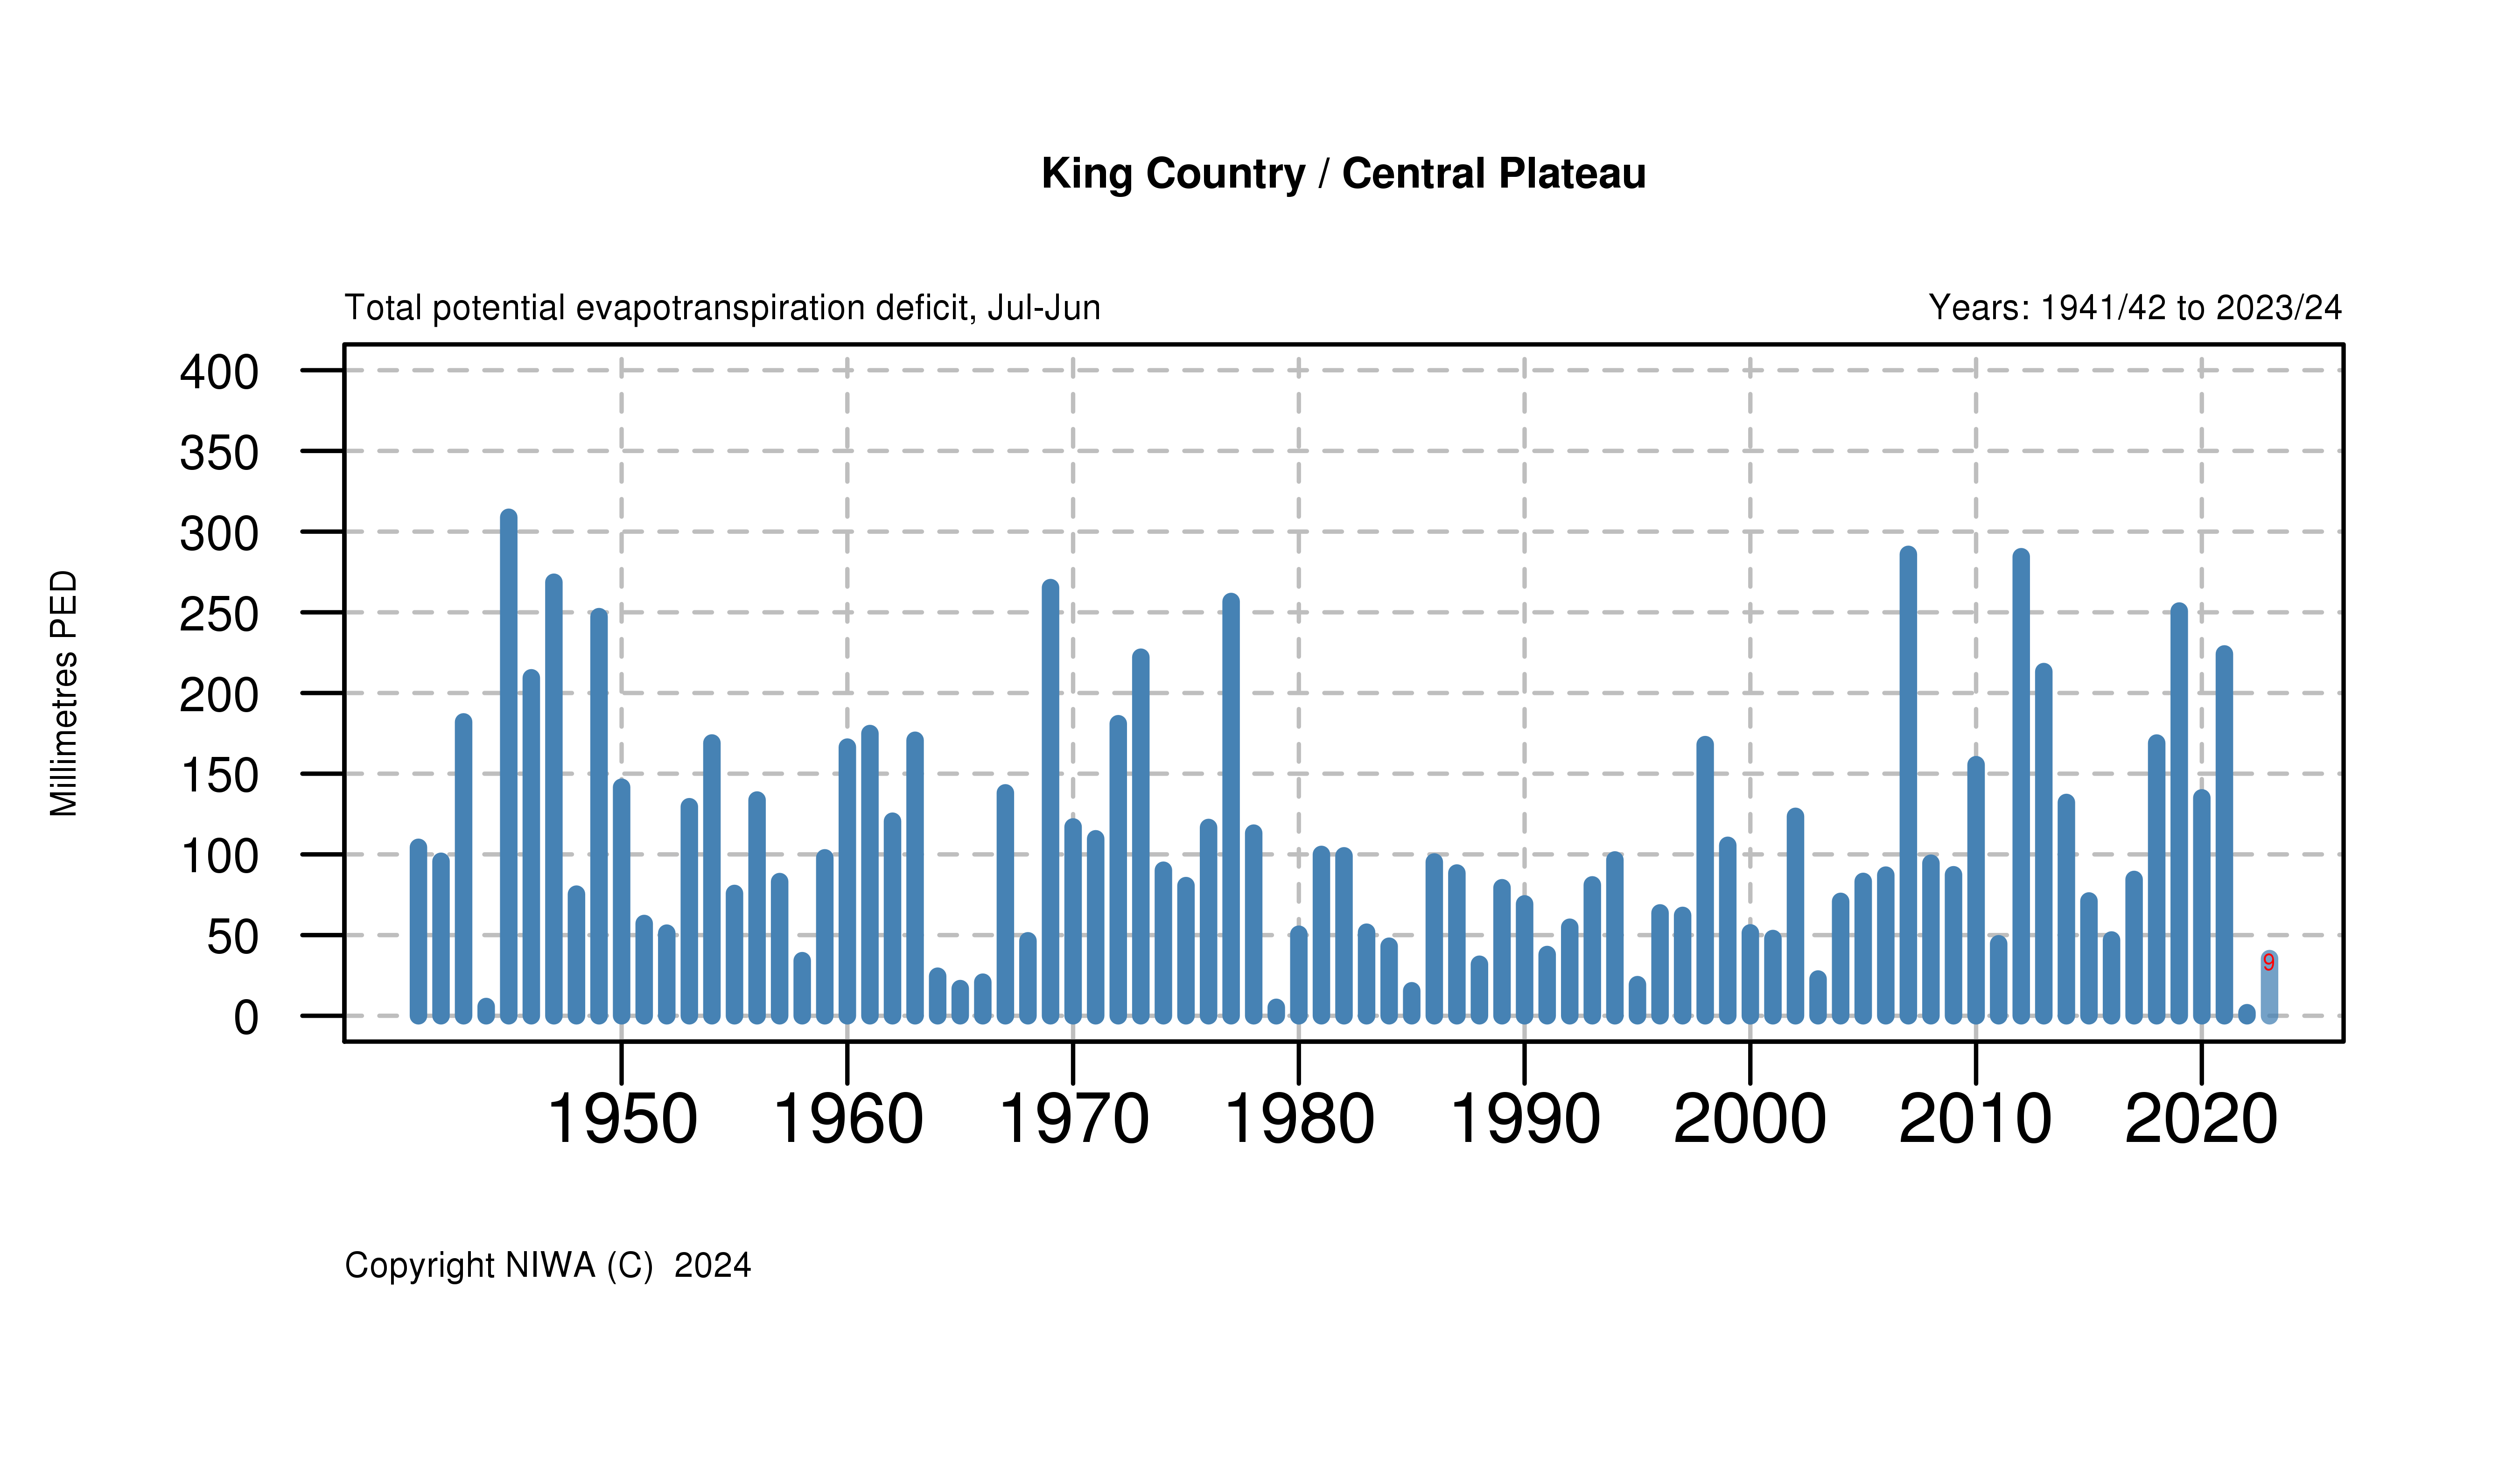
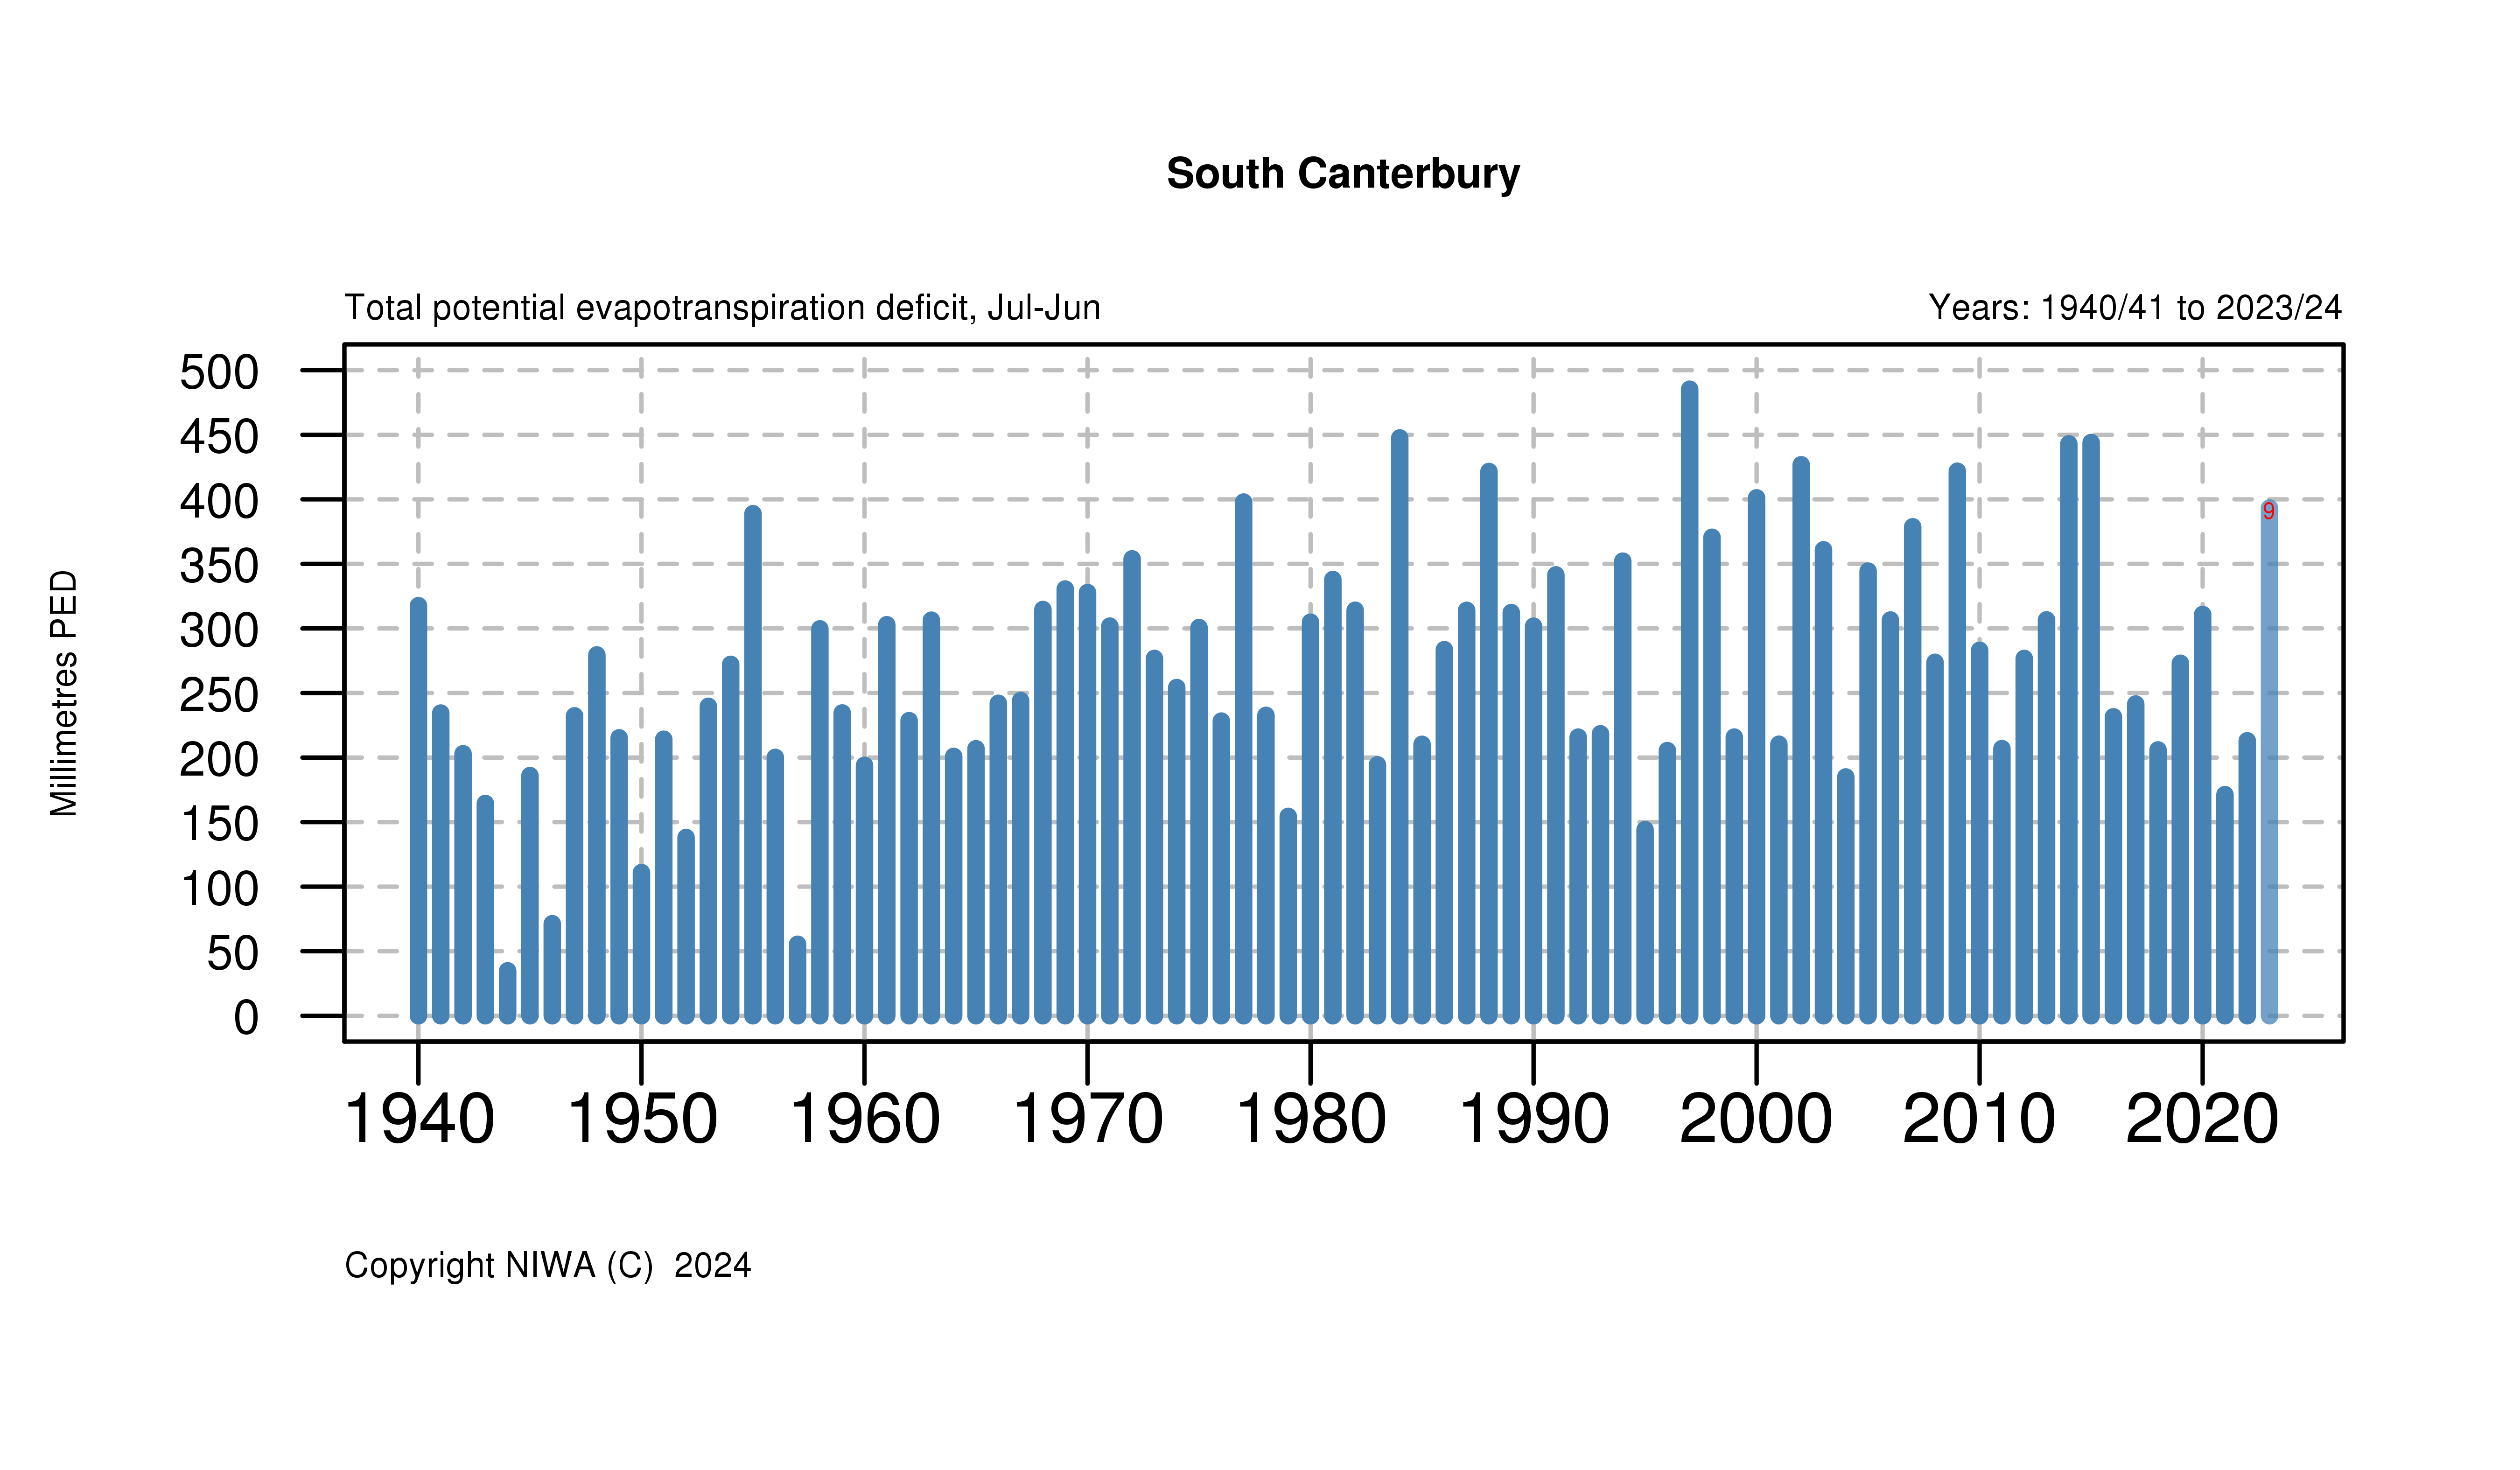
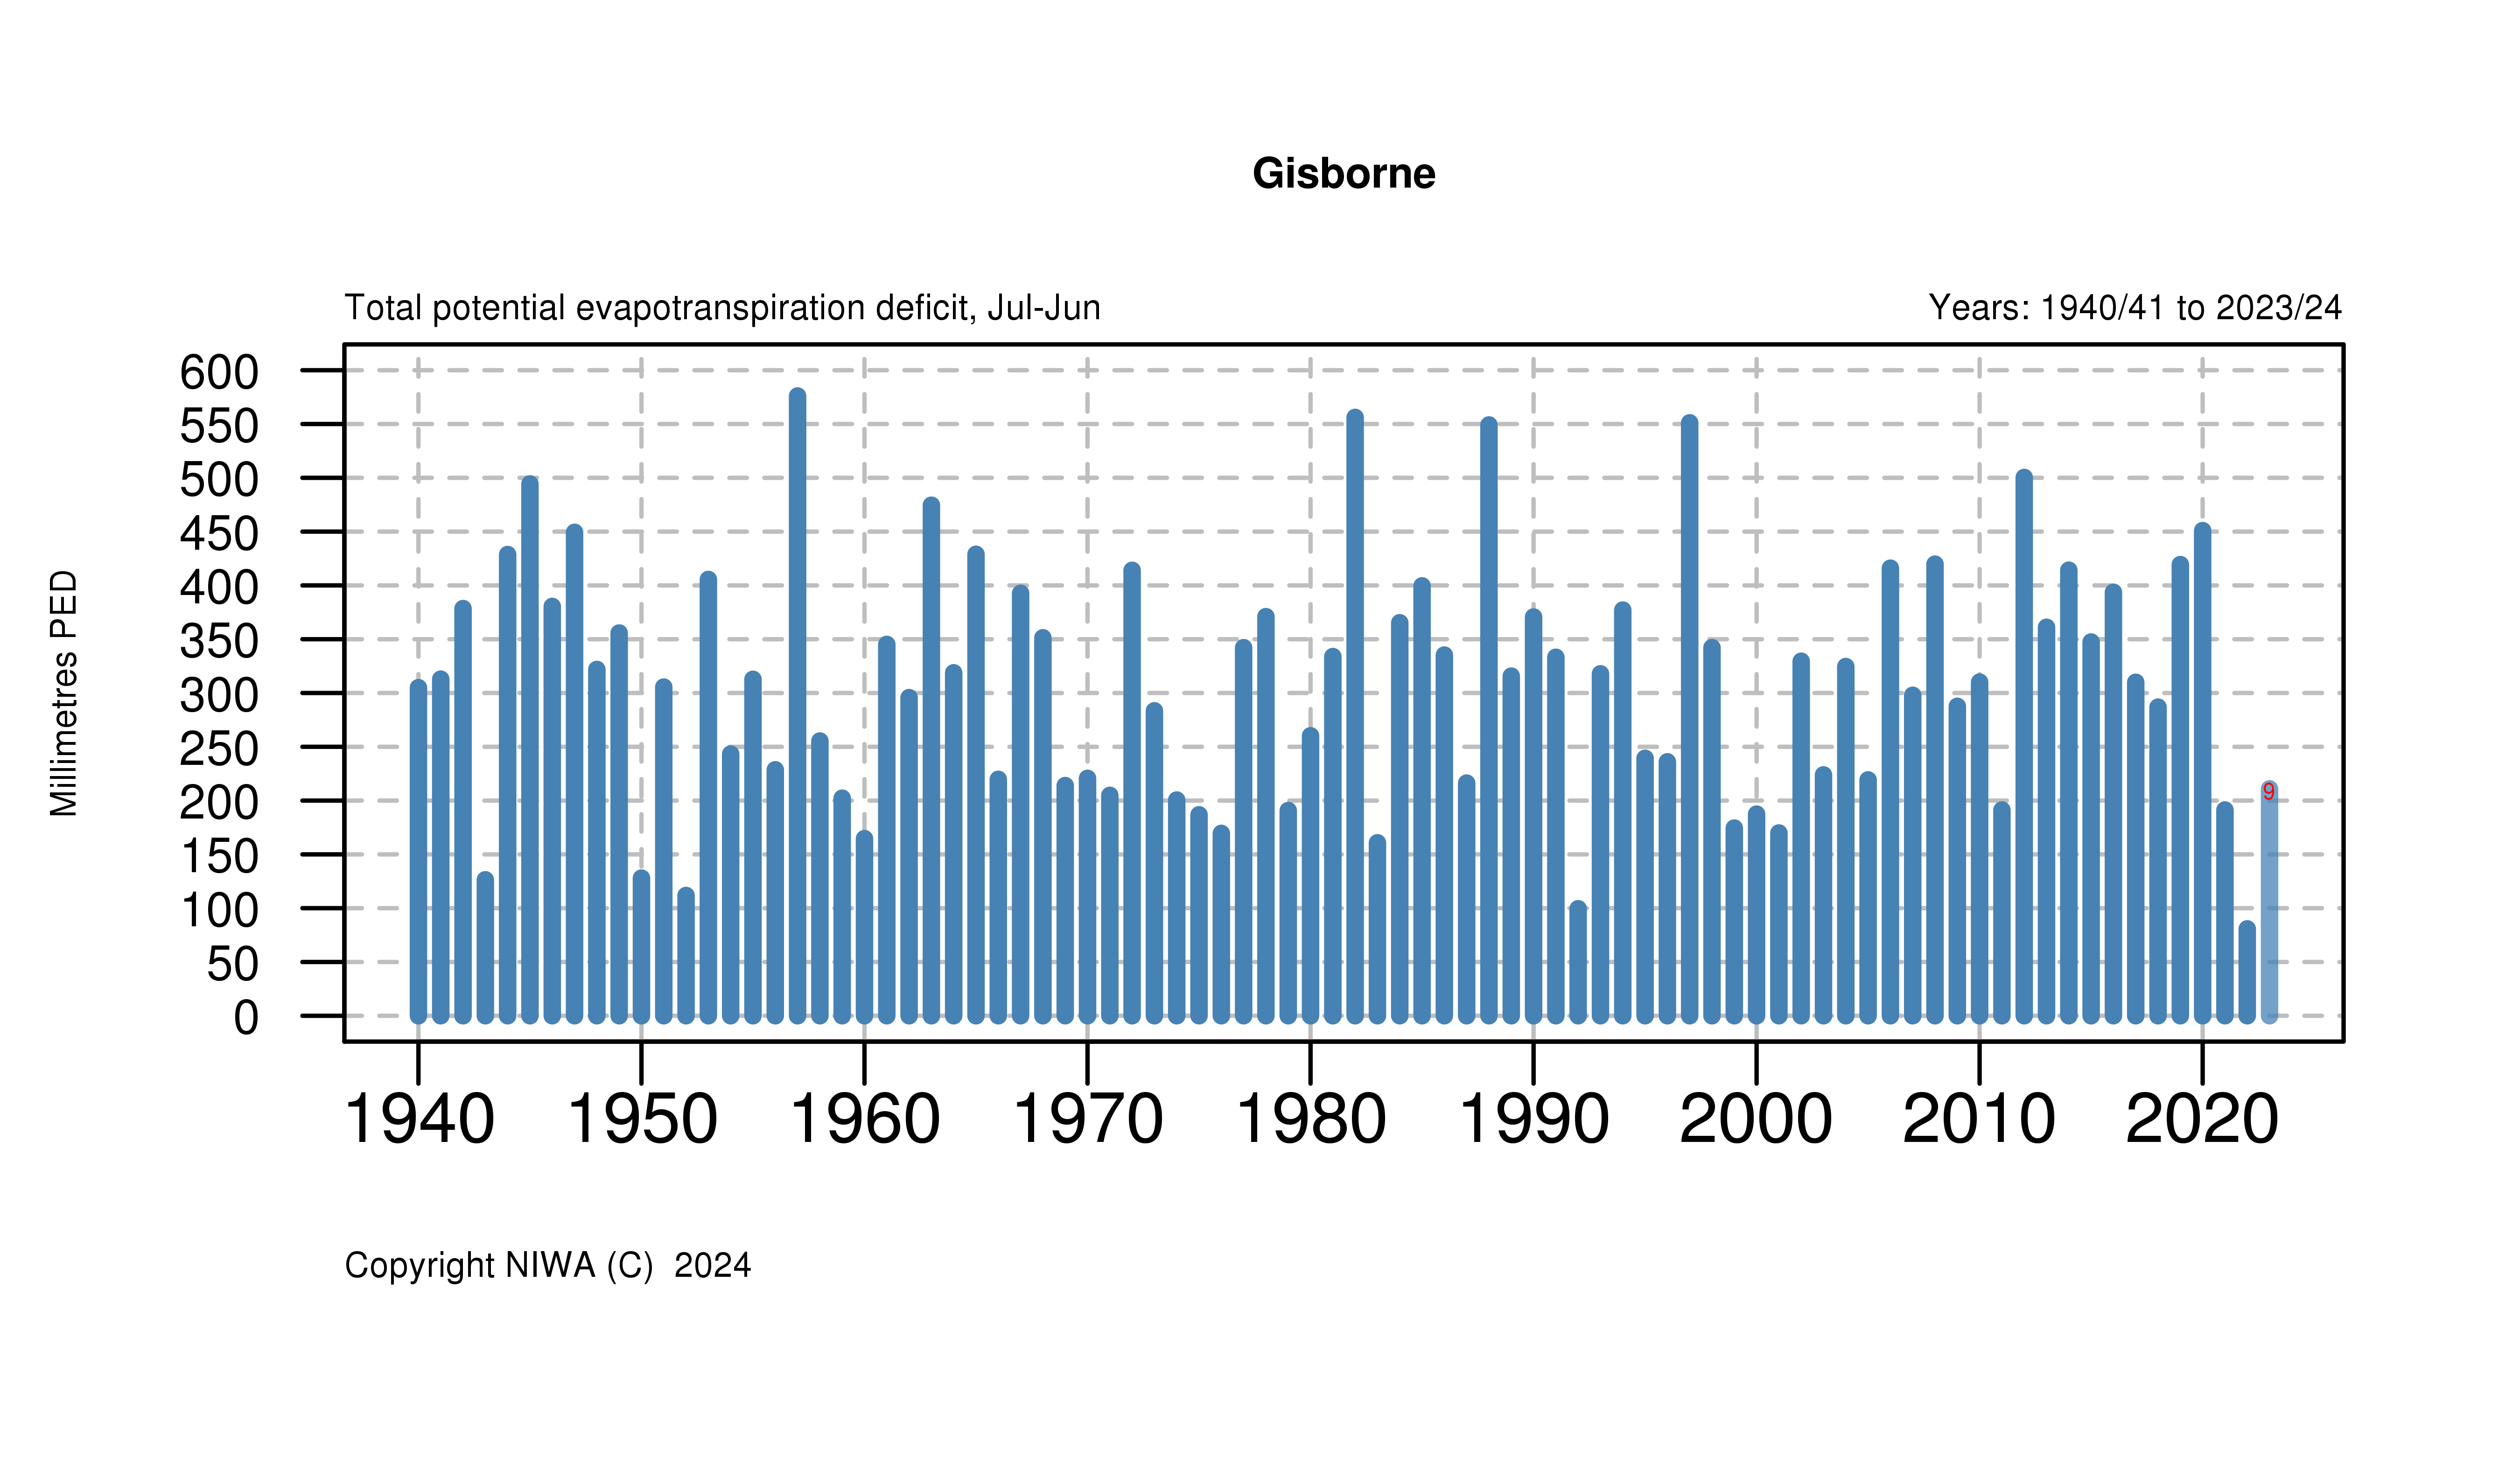
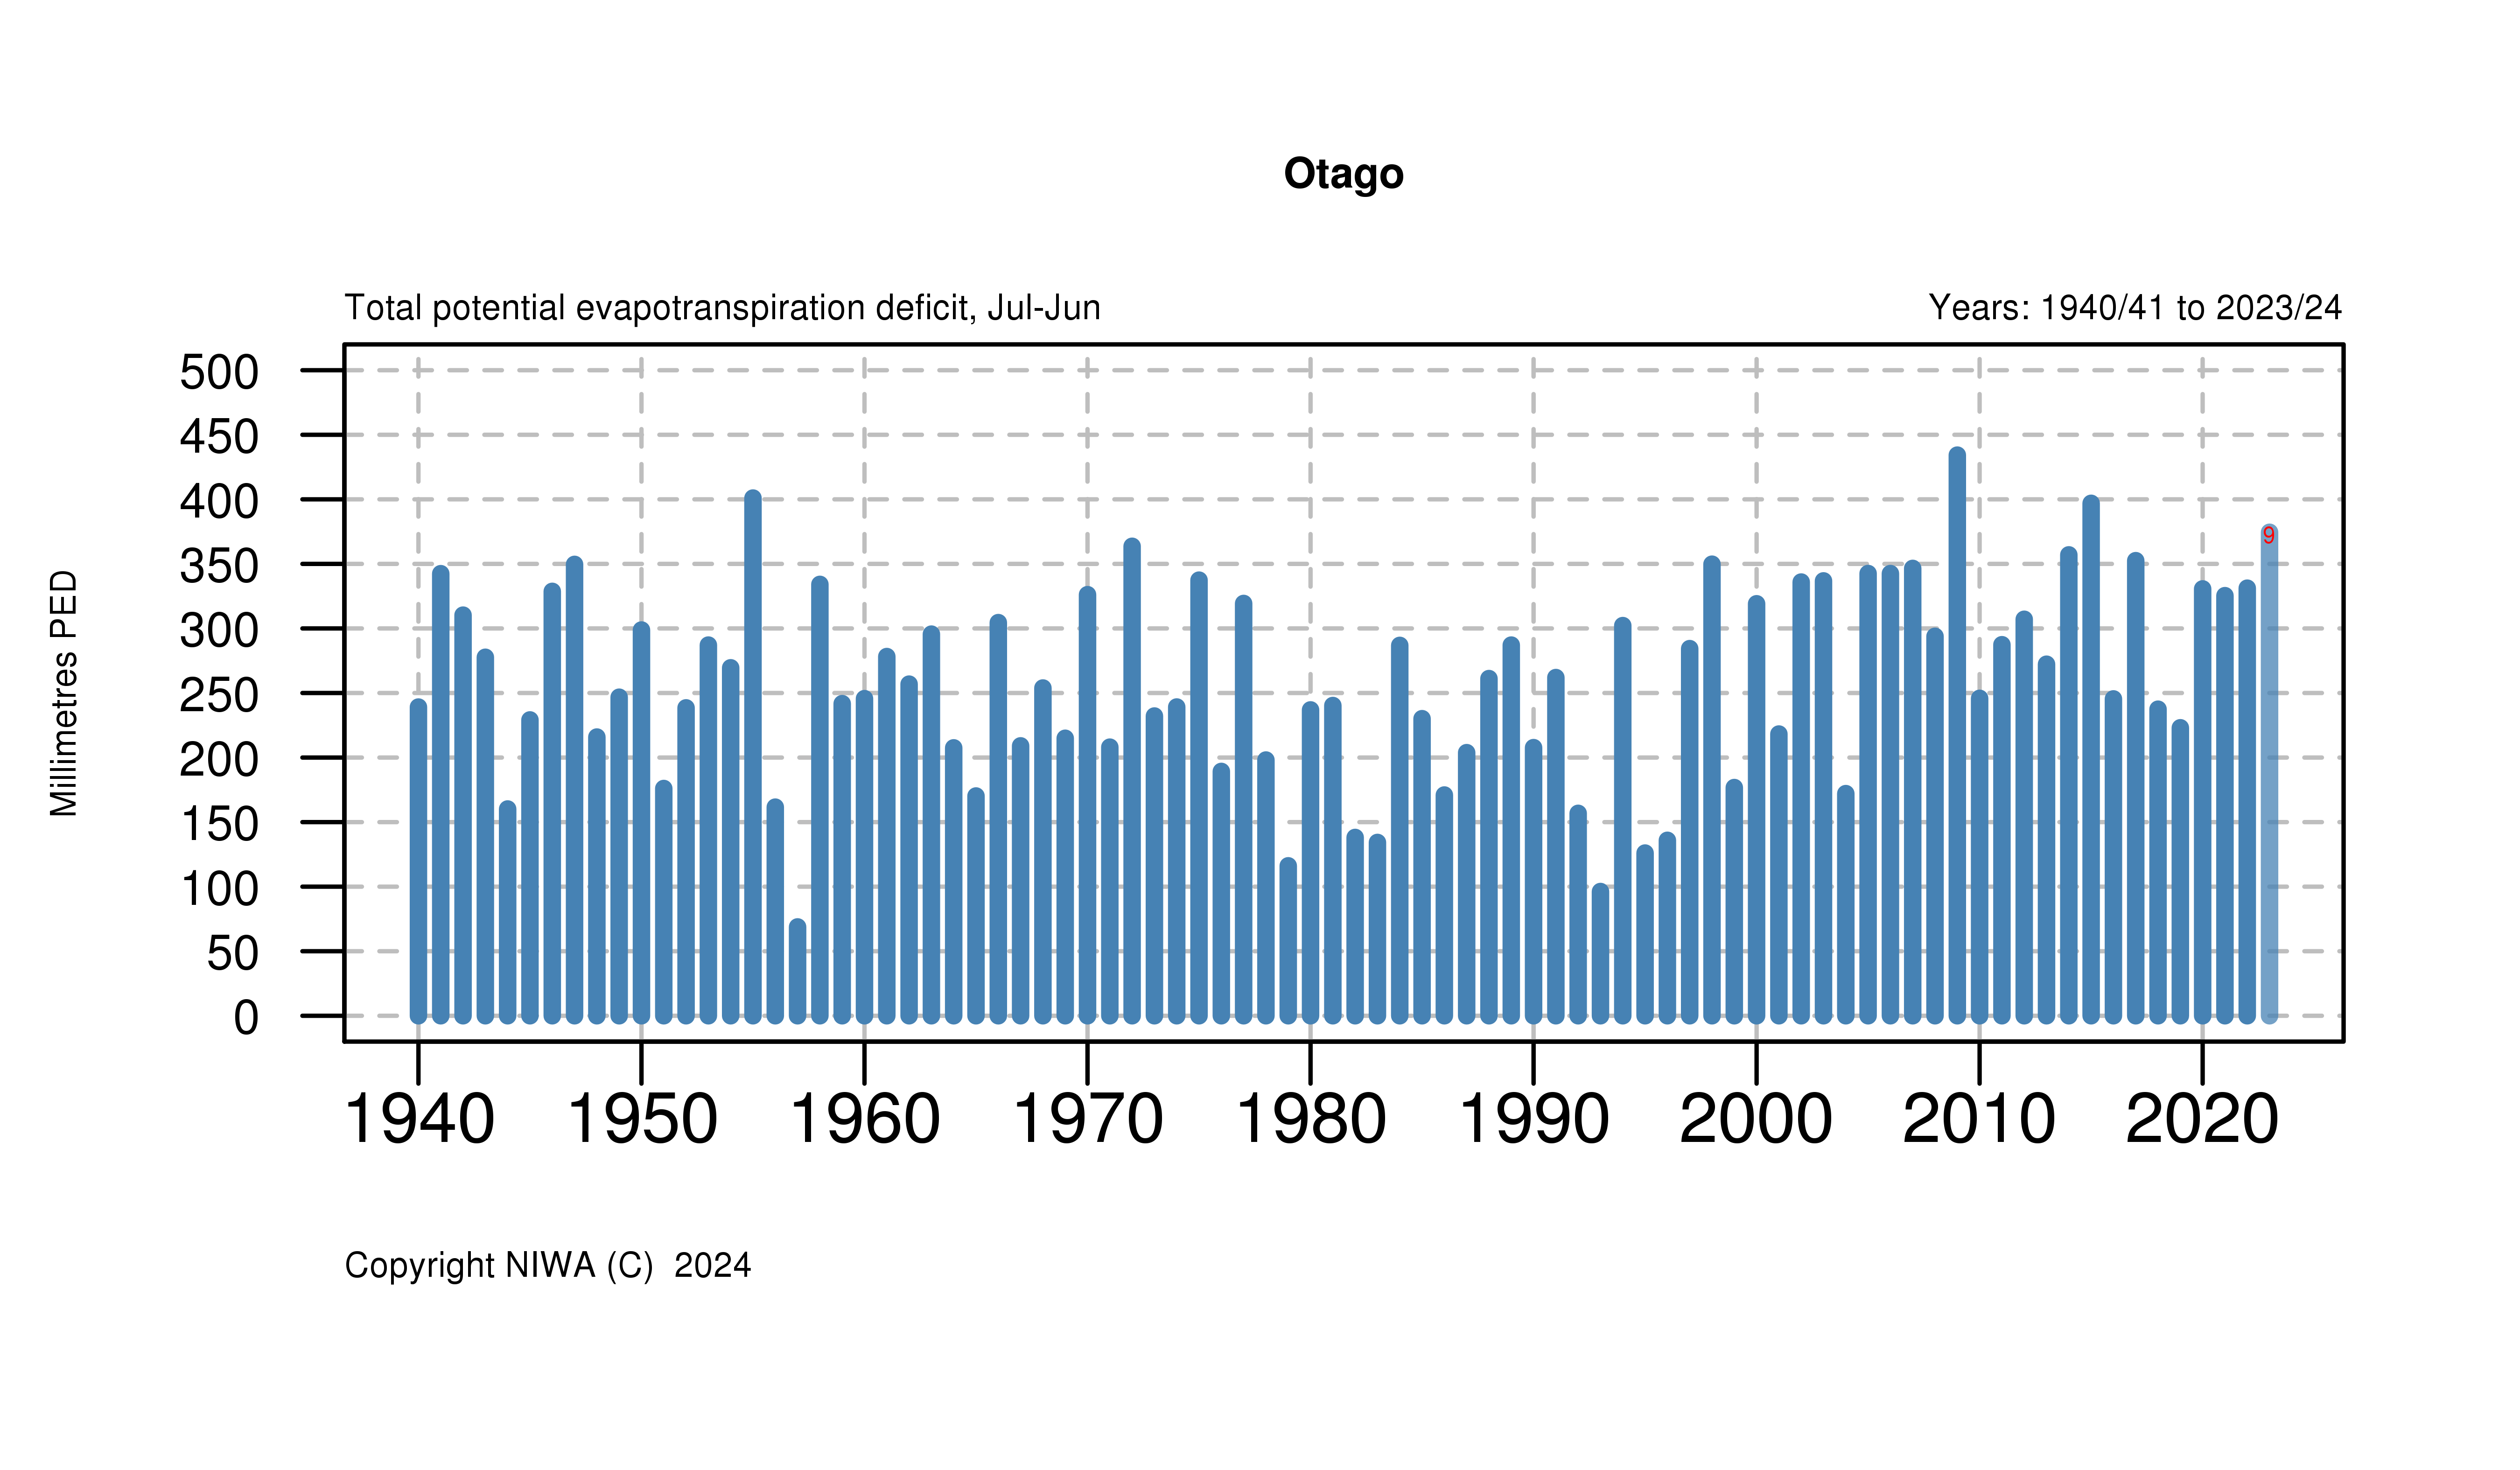
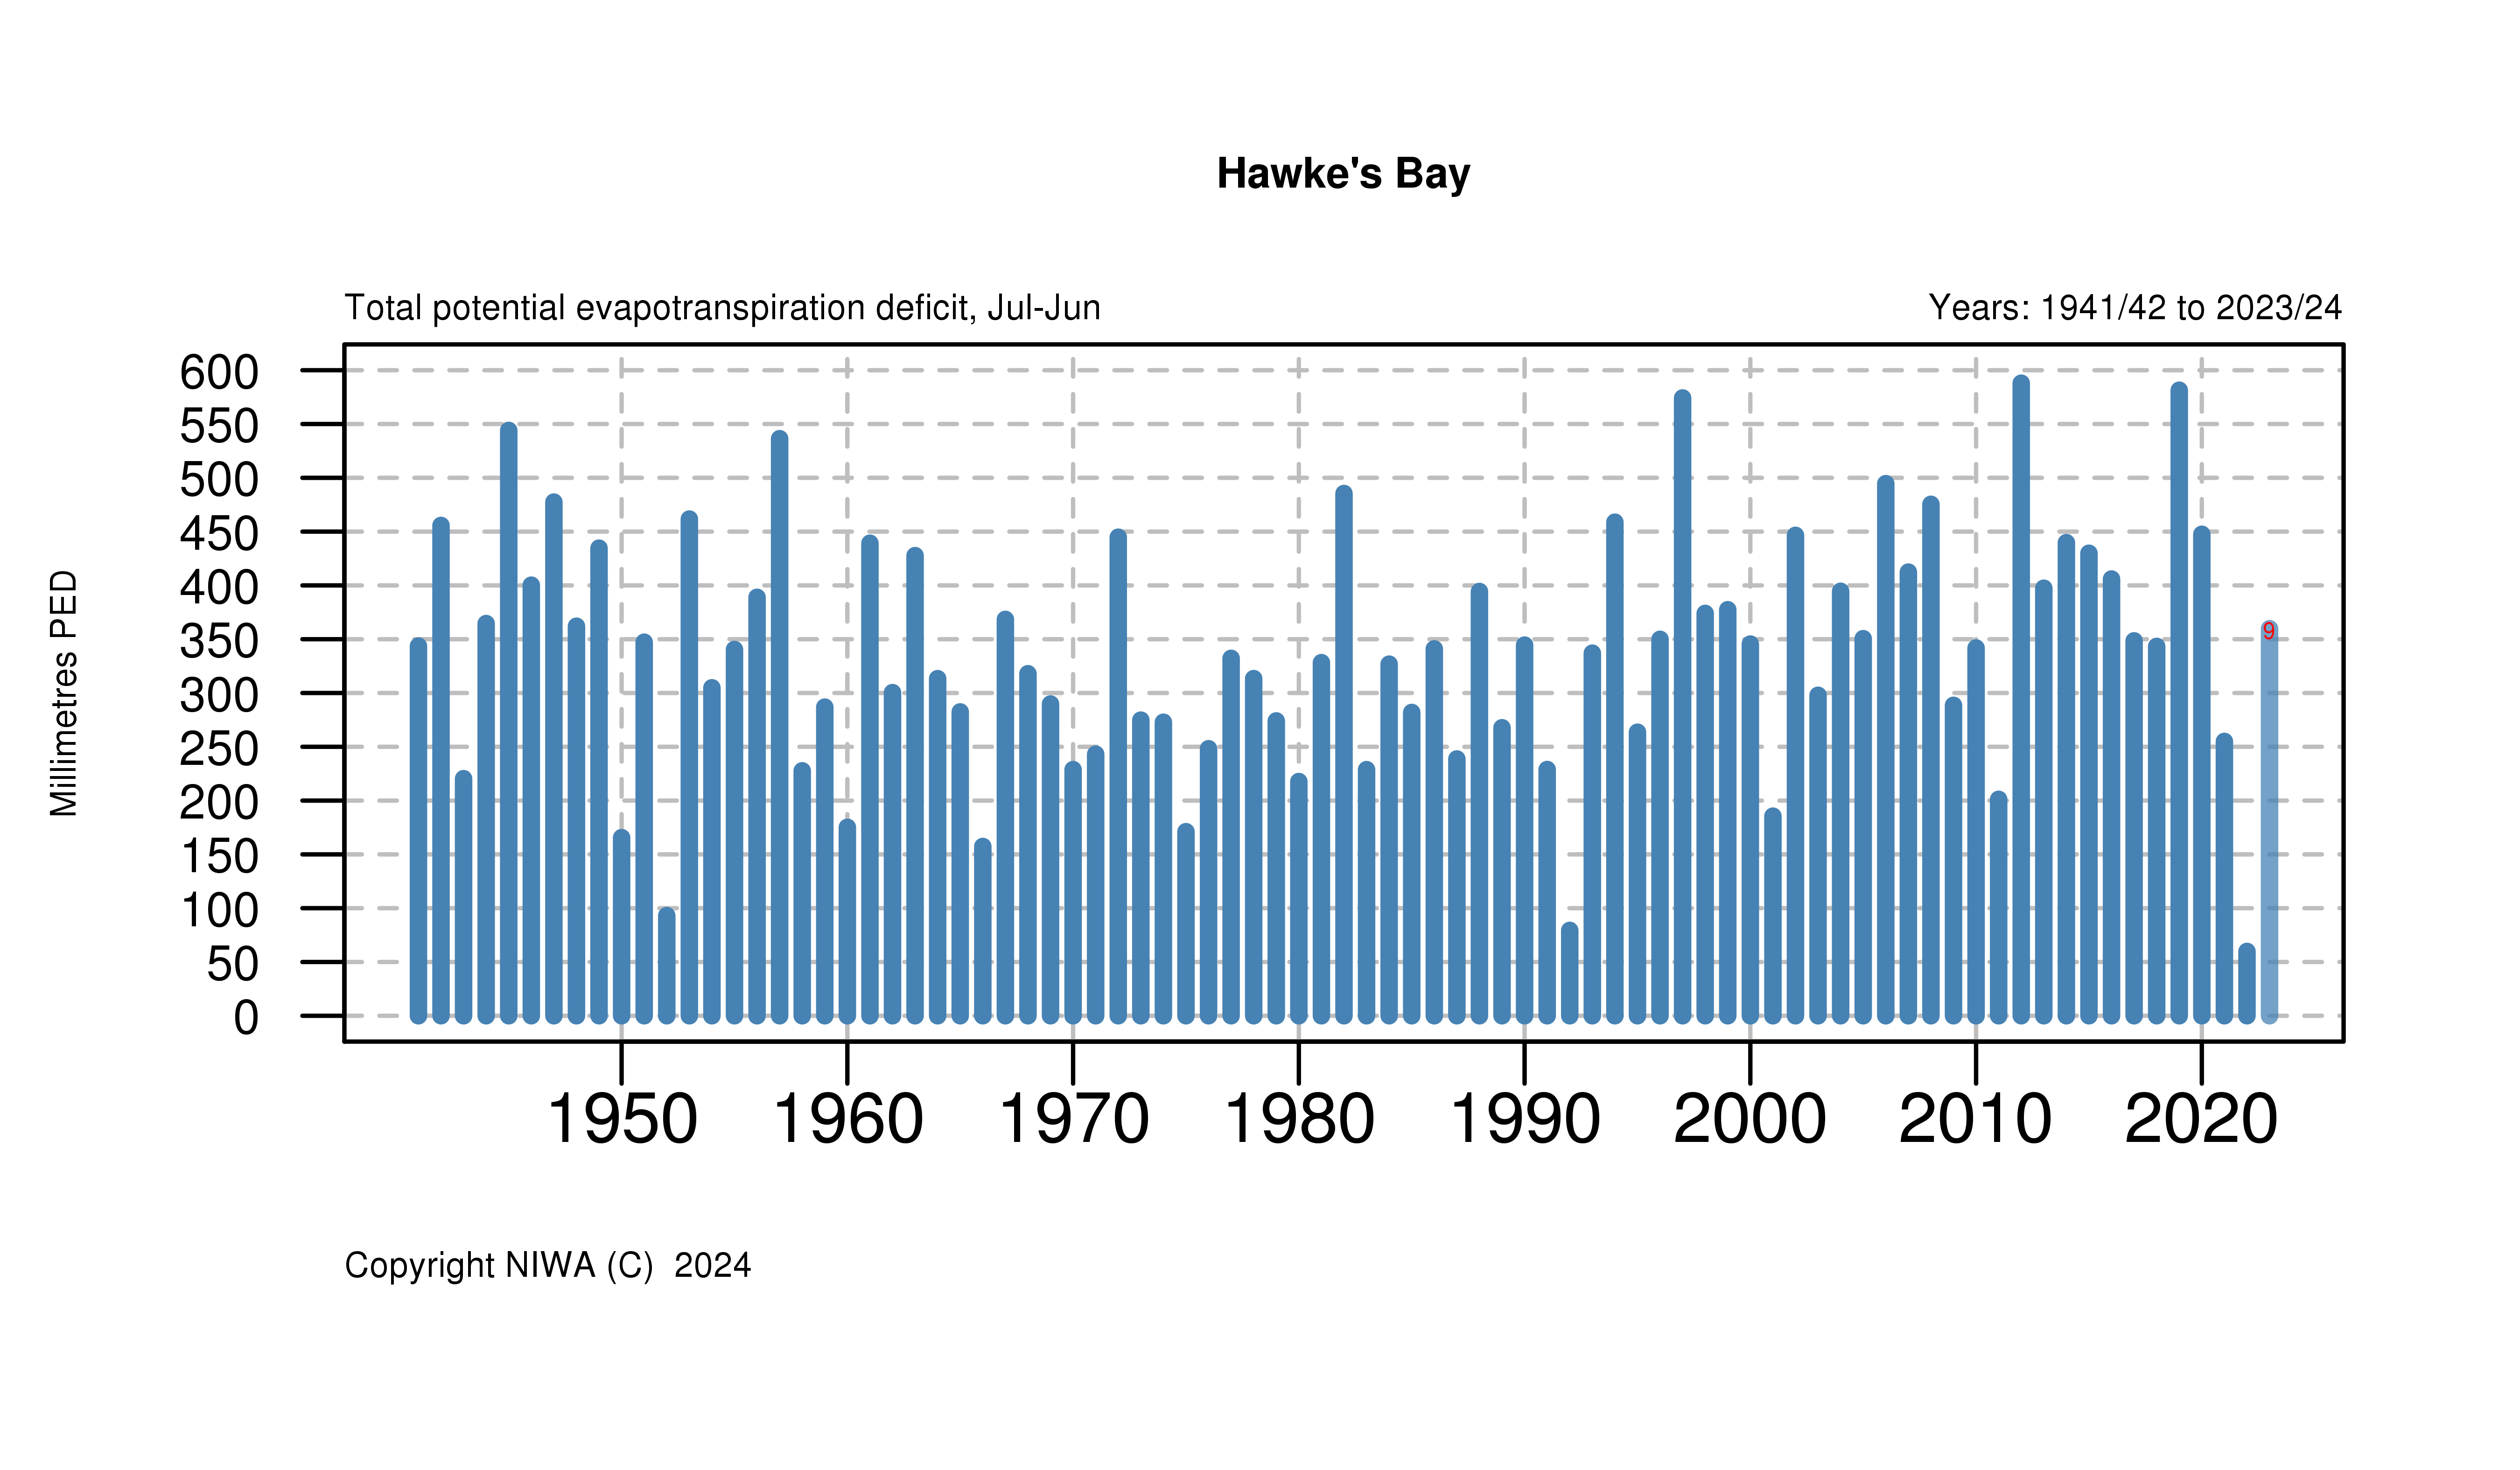
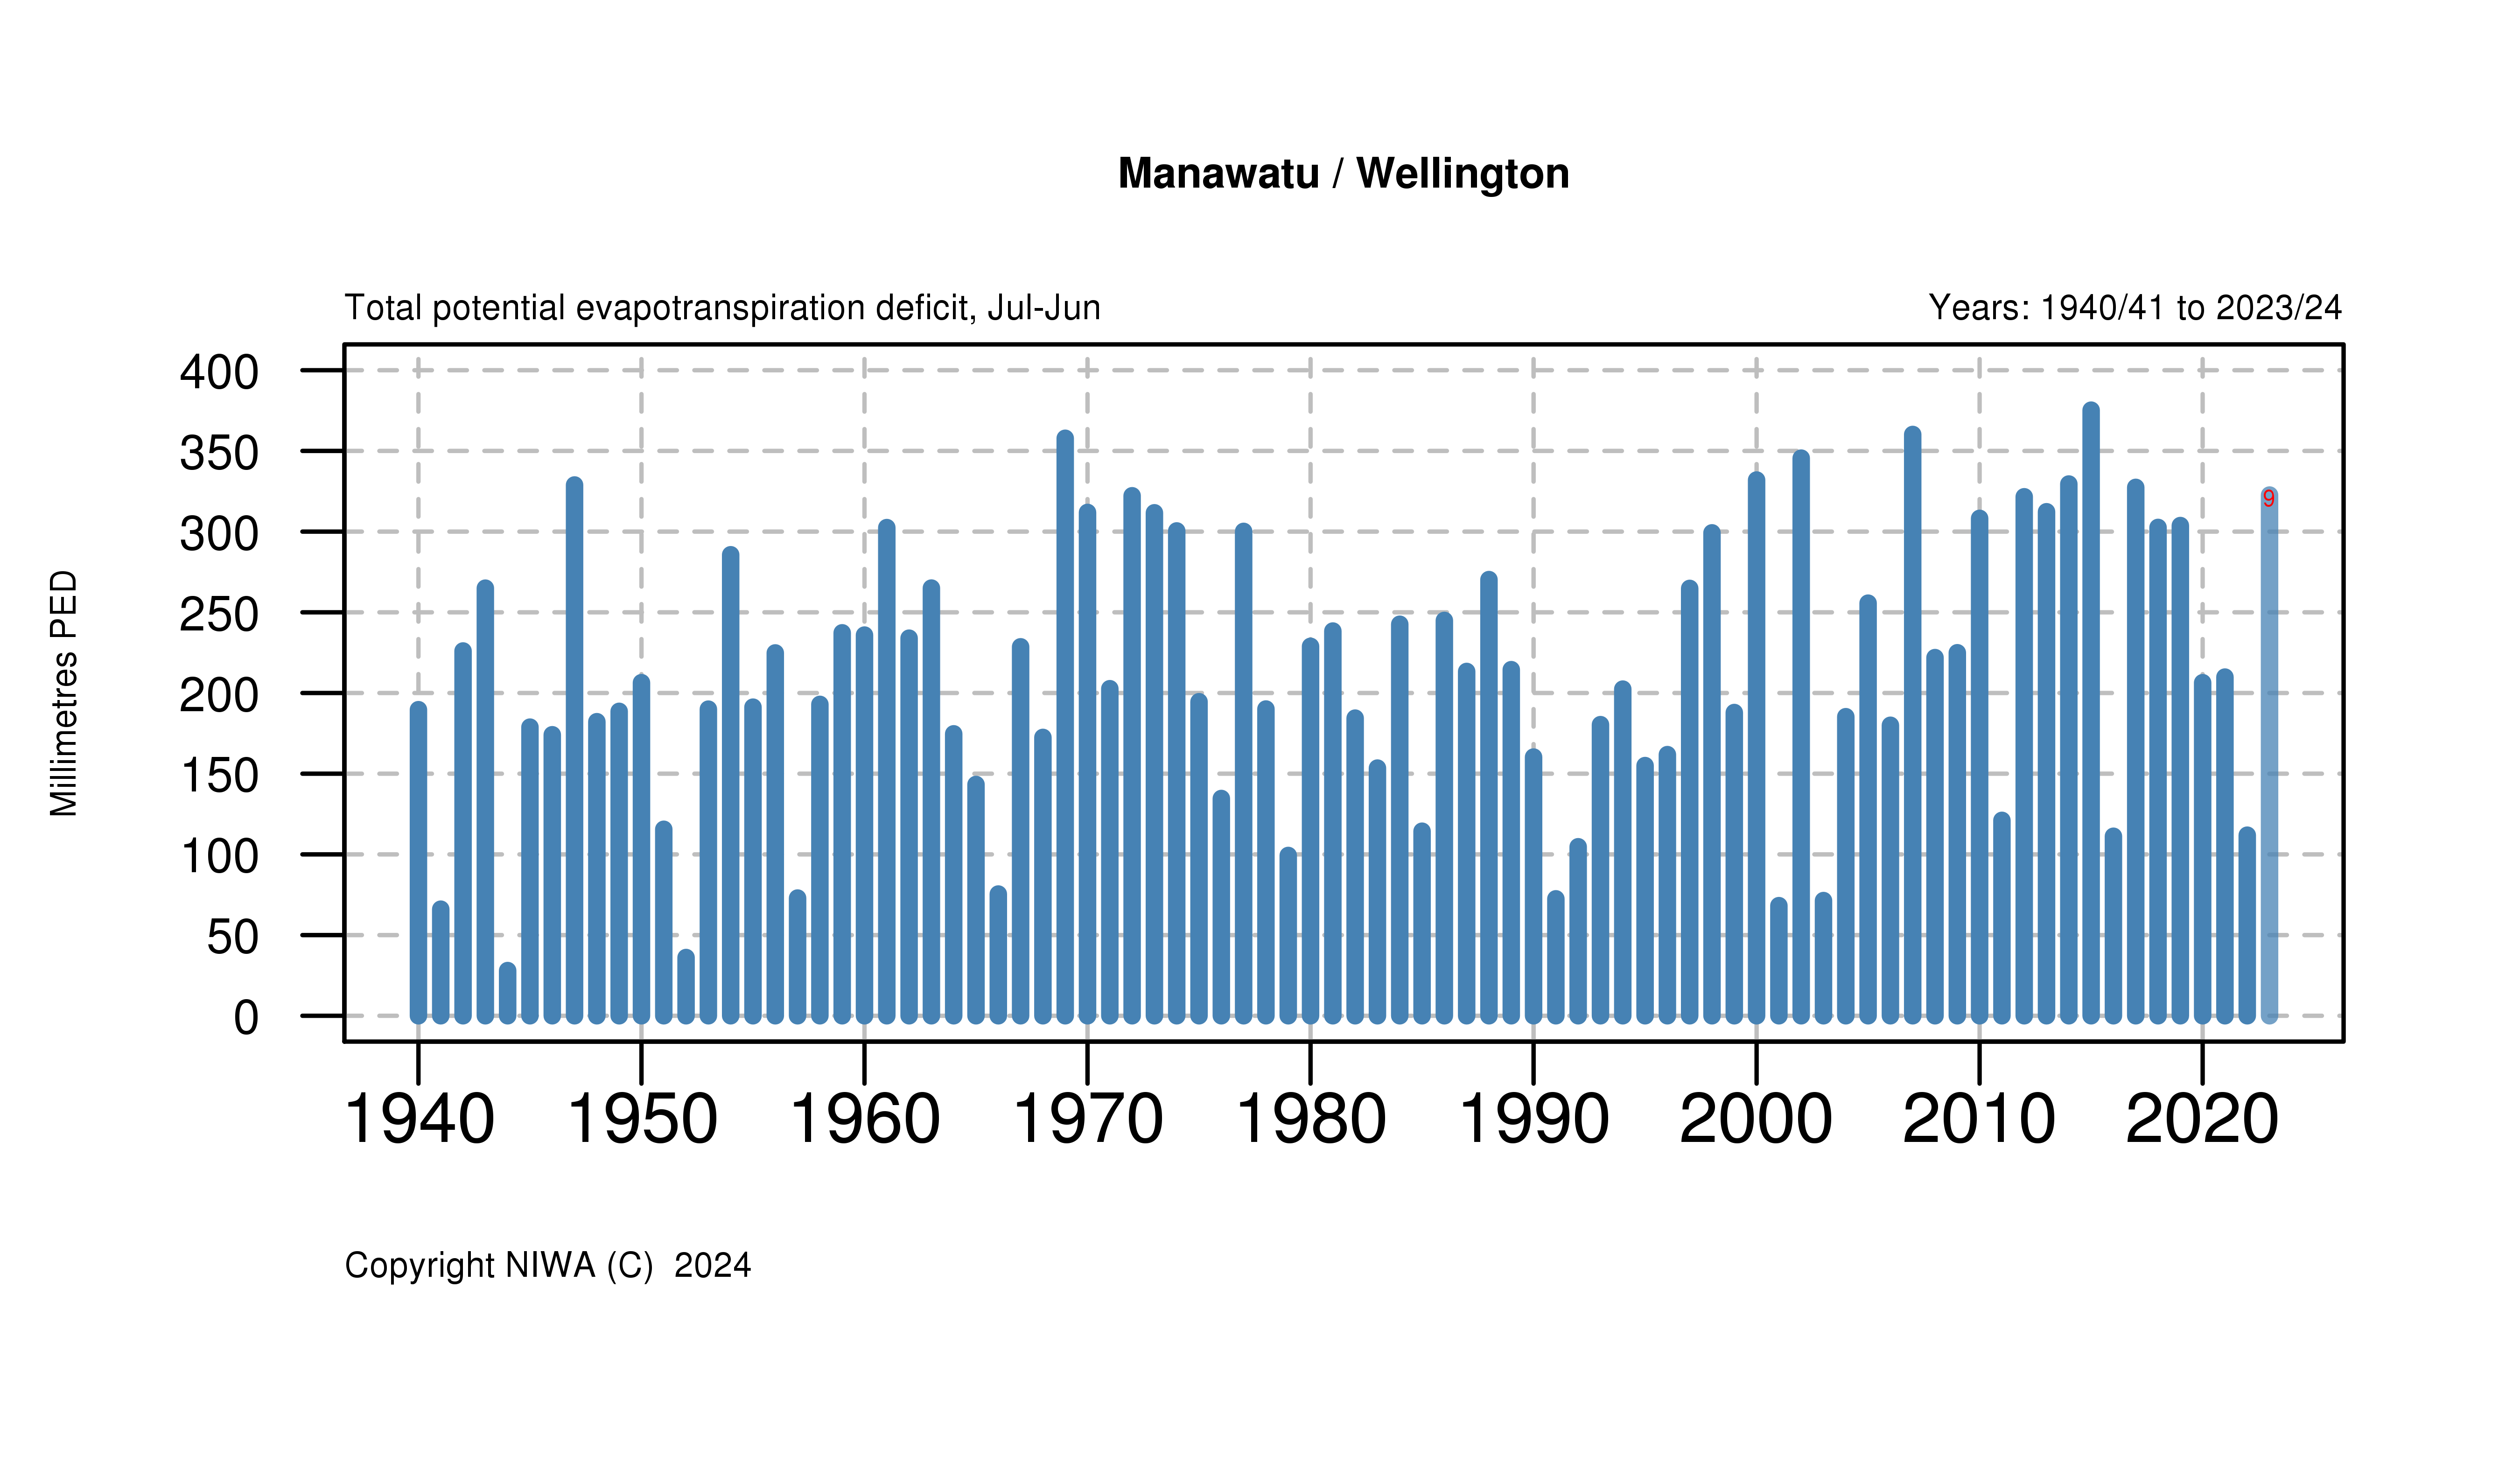
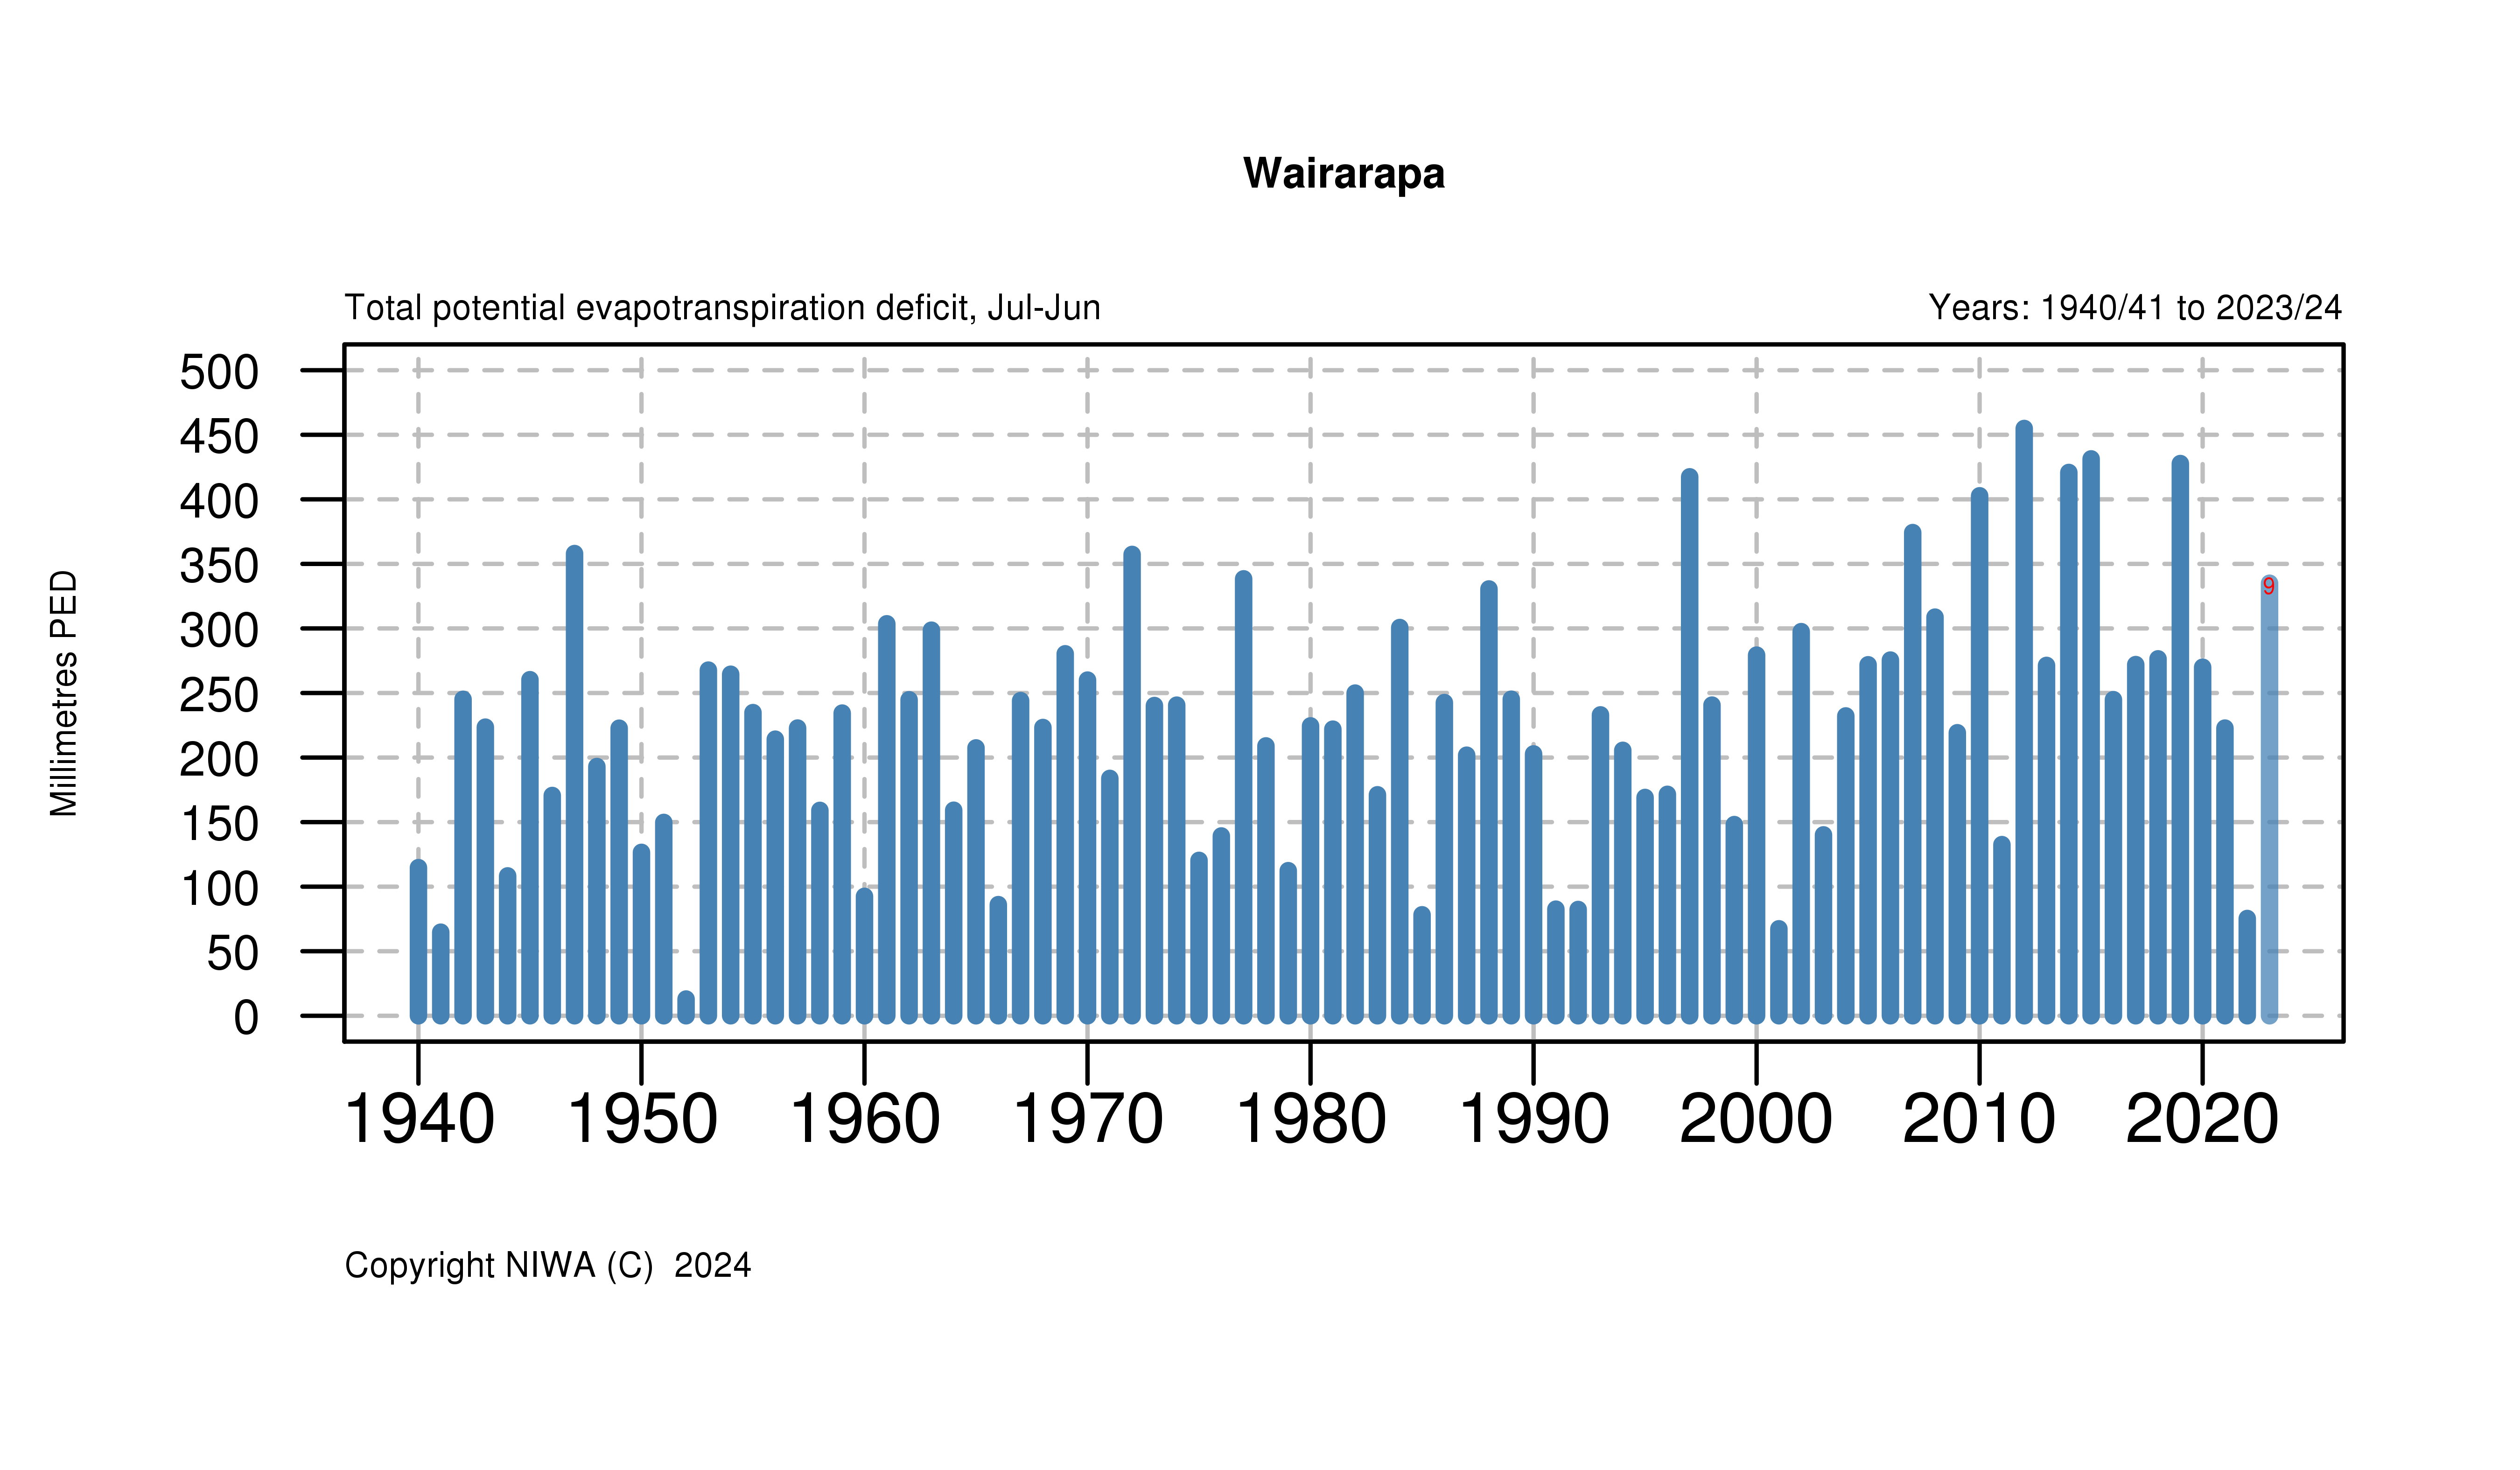
The PED charts show how drought intensity varies from year to year for each region of the country.
Background
Evapotranspiration is the process where water held in the soil is gradually released to the atmosphere through a combination of direct evaporation and transpiration from plants. As the growing season advances, the amount a water lost from the soil through evapotranspiration typically exceeds rainfall, giving rise to an increase in soil moisture deficit. As soil moisture decreases, pasture production becomes moisture-constrained and evapotranspiration can no longer meet atmospheric demand.
The difference between this demand (potential evapotranspiration), and the actual evapotranspiration is defined as the potential evapotranspiration deficit. In practice, PED represents the amount of water required by irrigation, or that needs to be replenished by rainfall, to maintain plant growth at levels unconstrained by soil water shortage. As such, PED estimates provide a robust measure of drought intensity and duration.
Charts
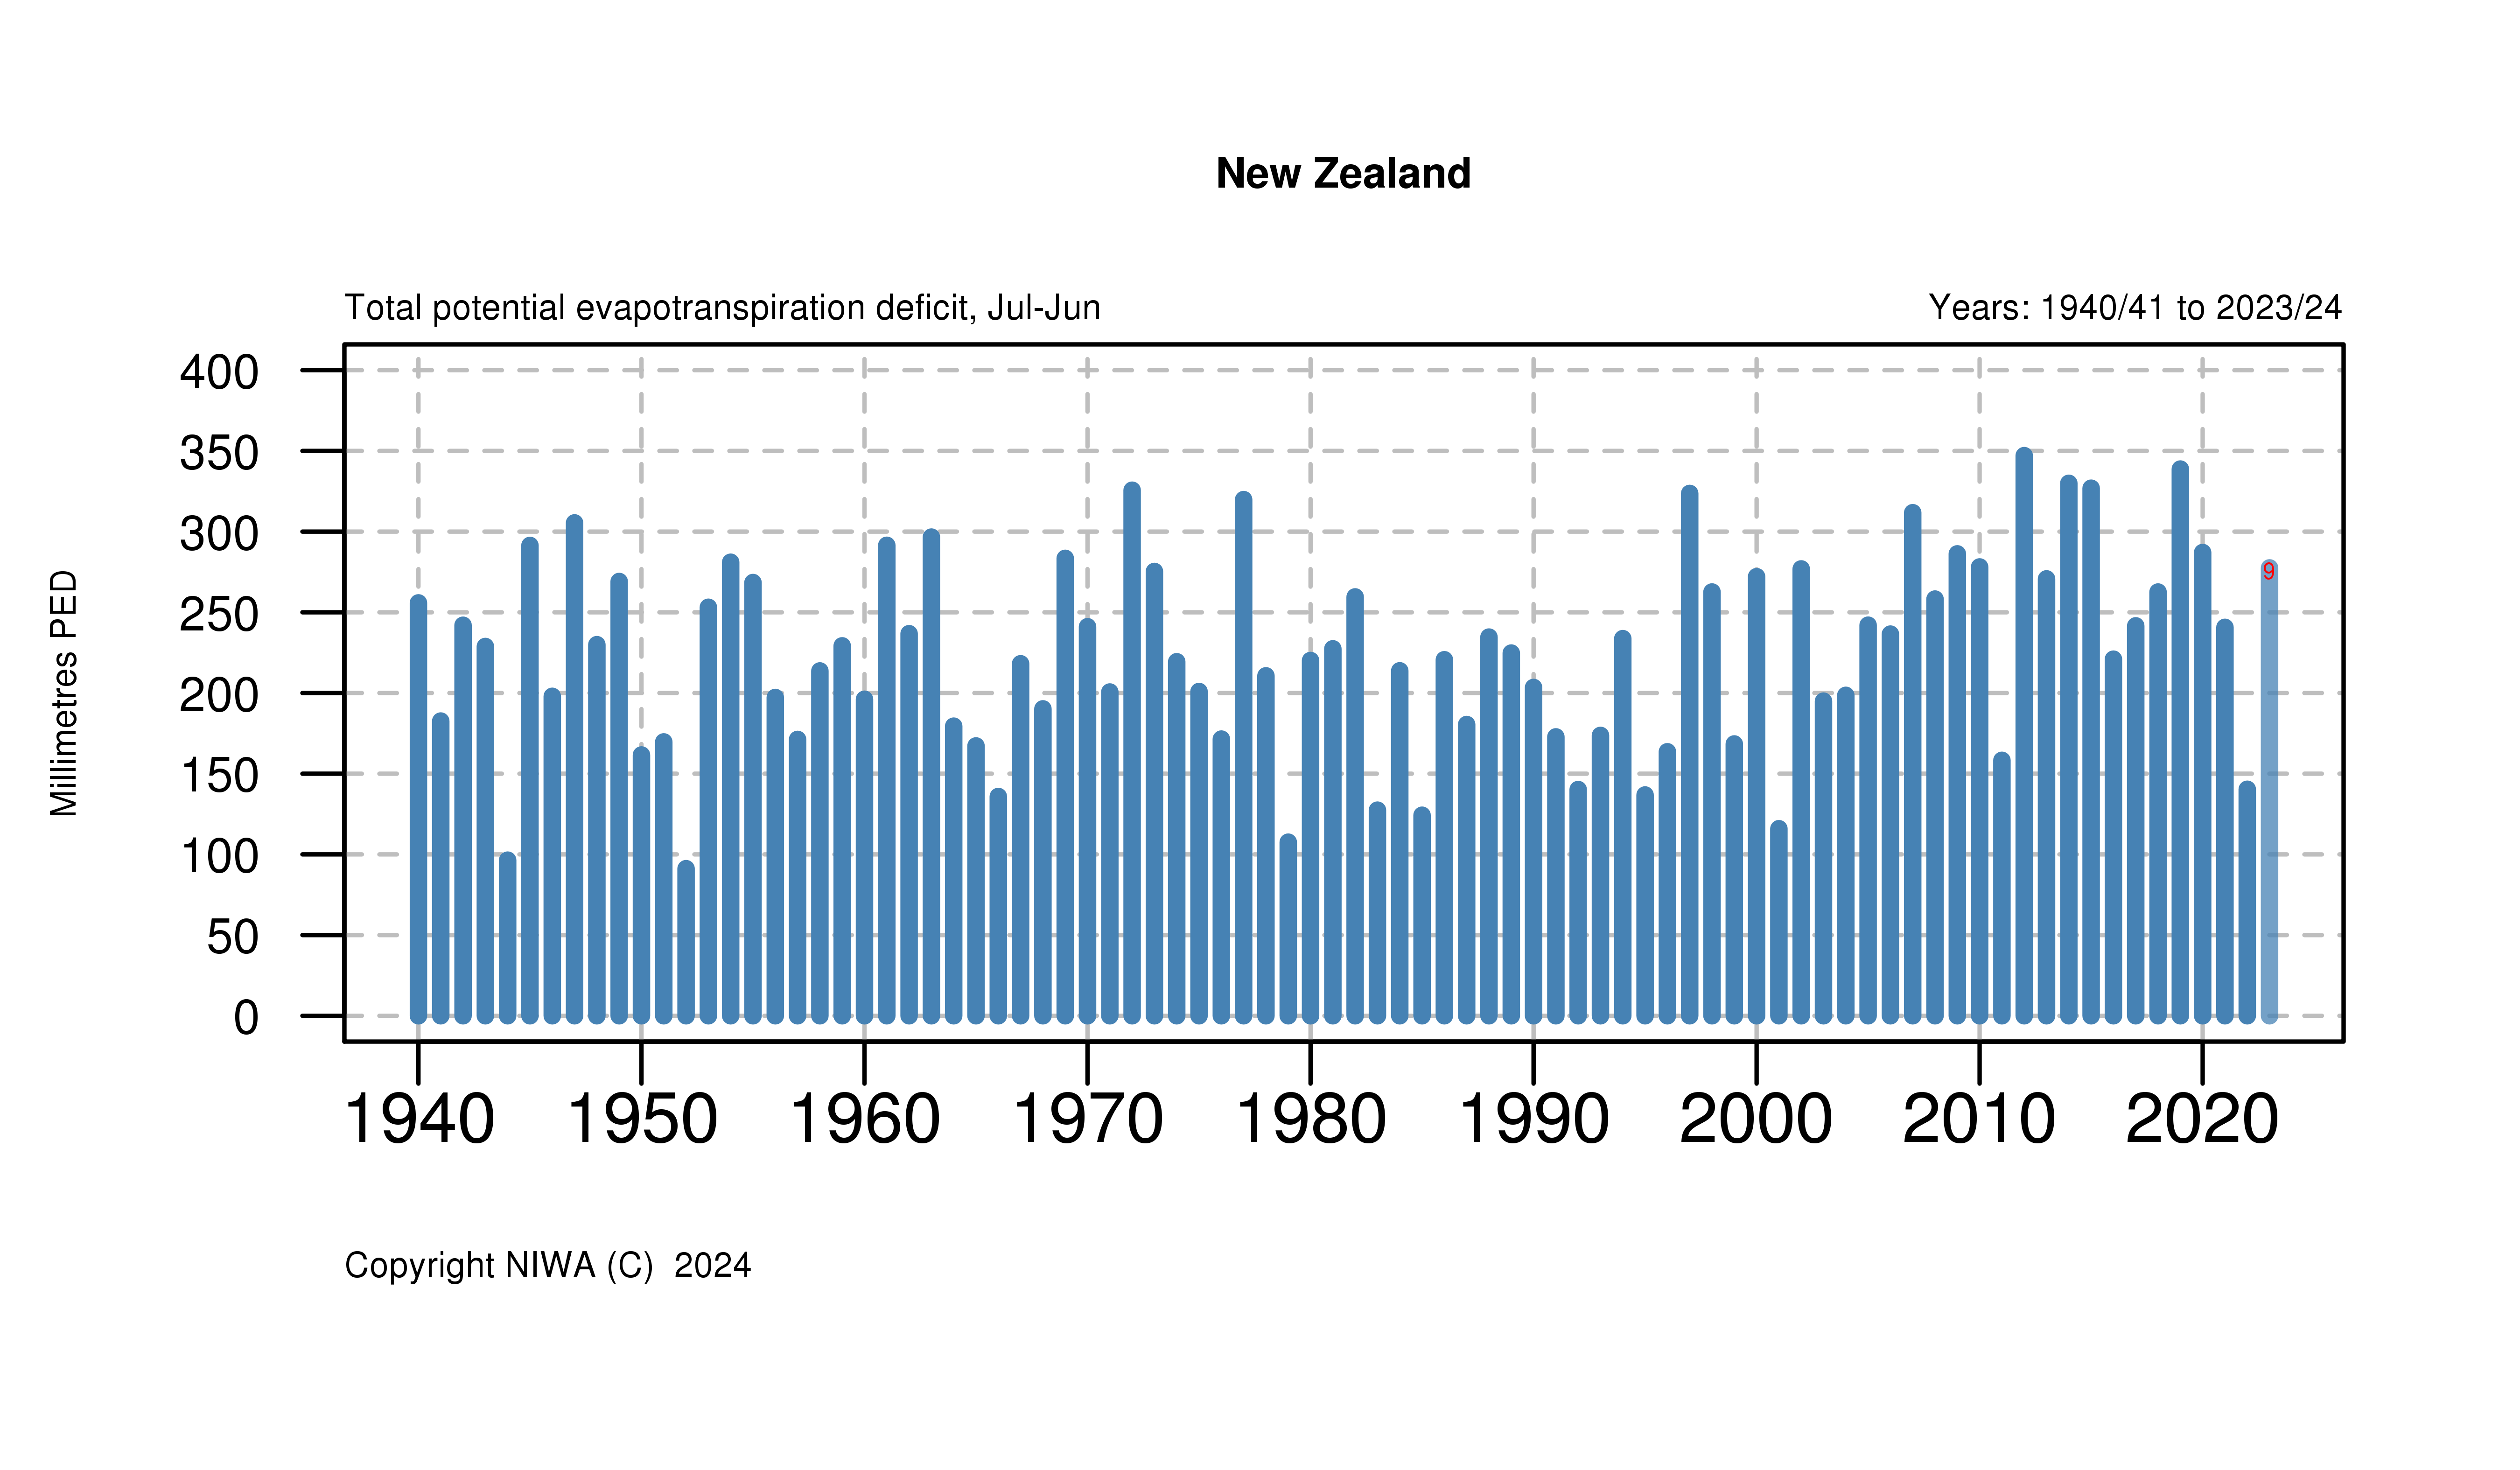
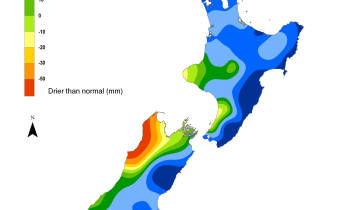
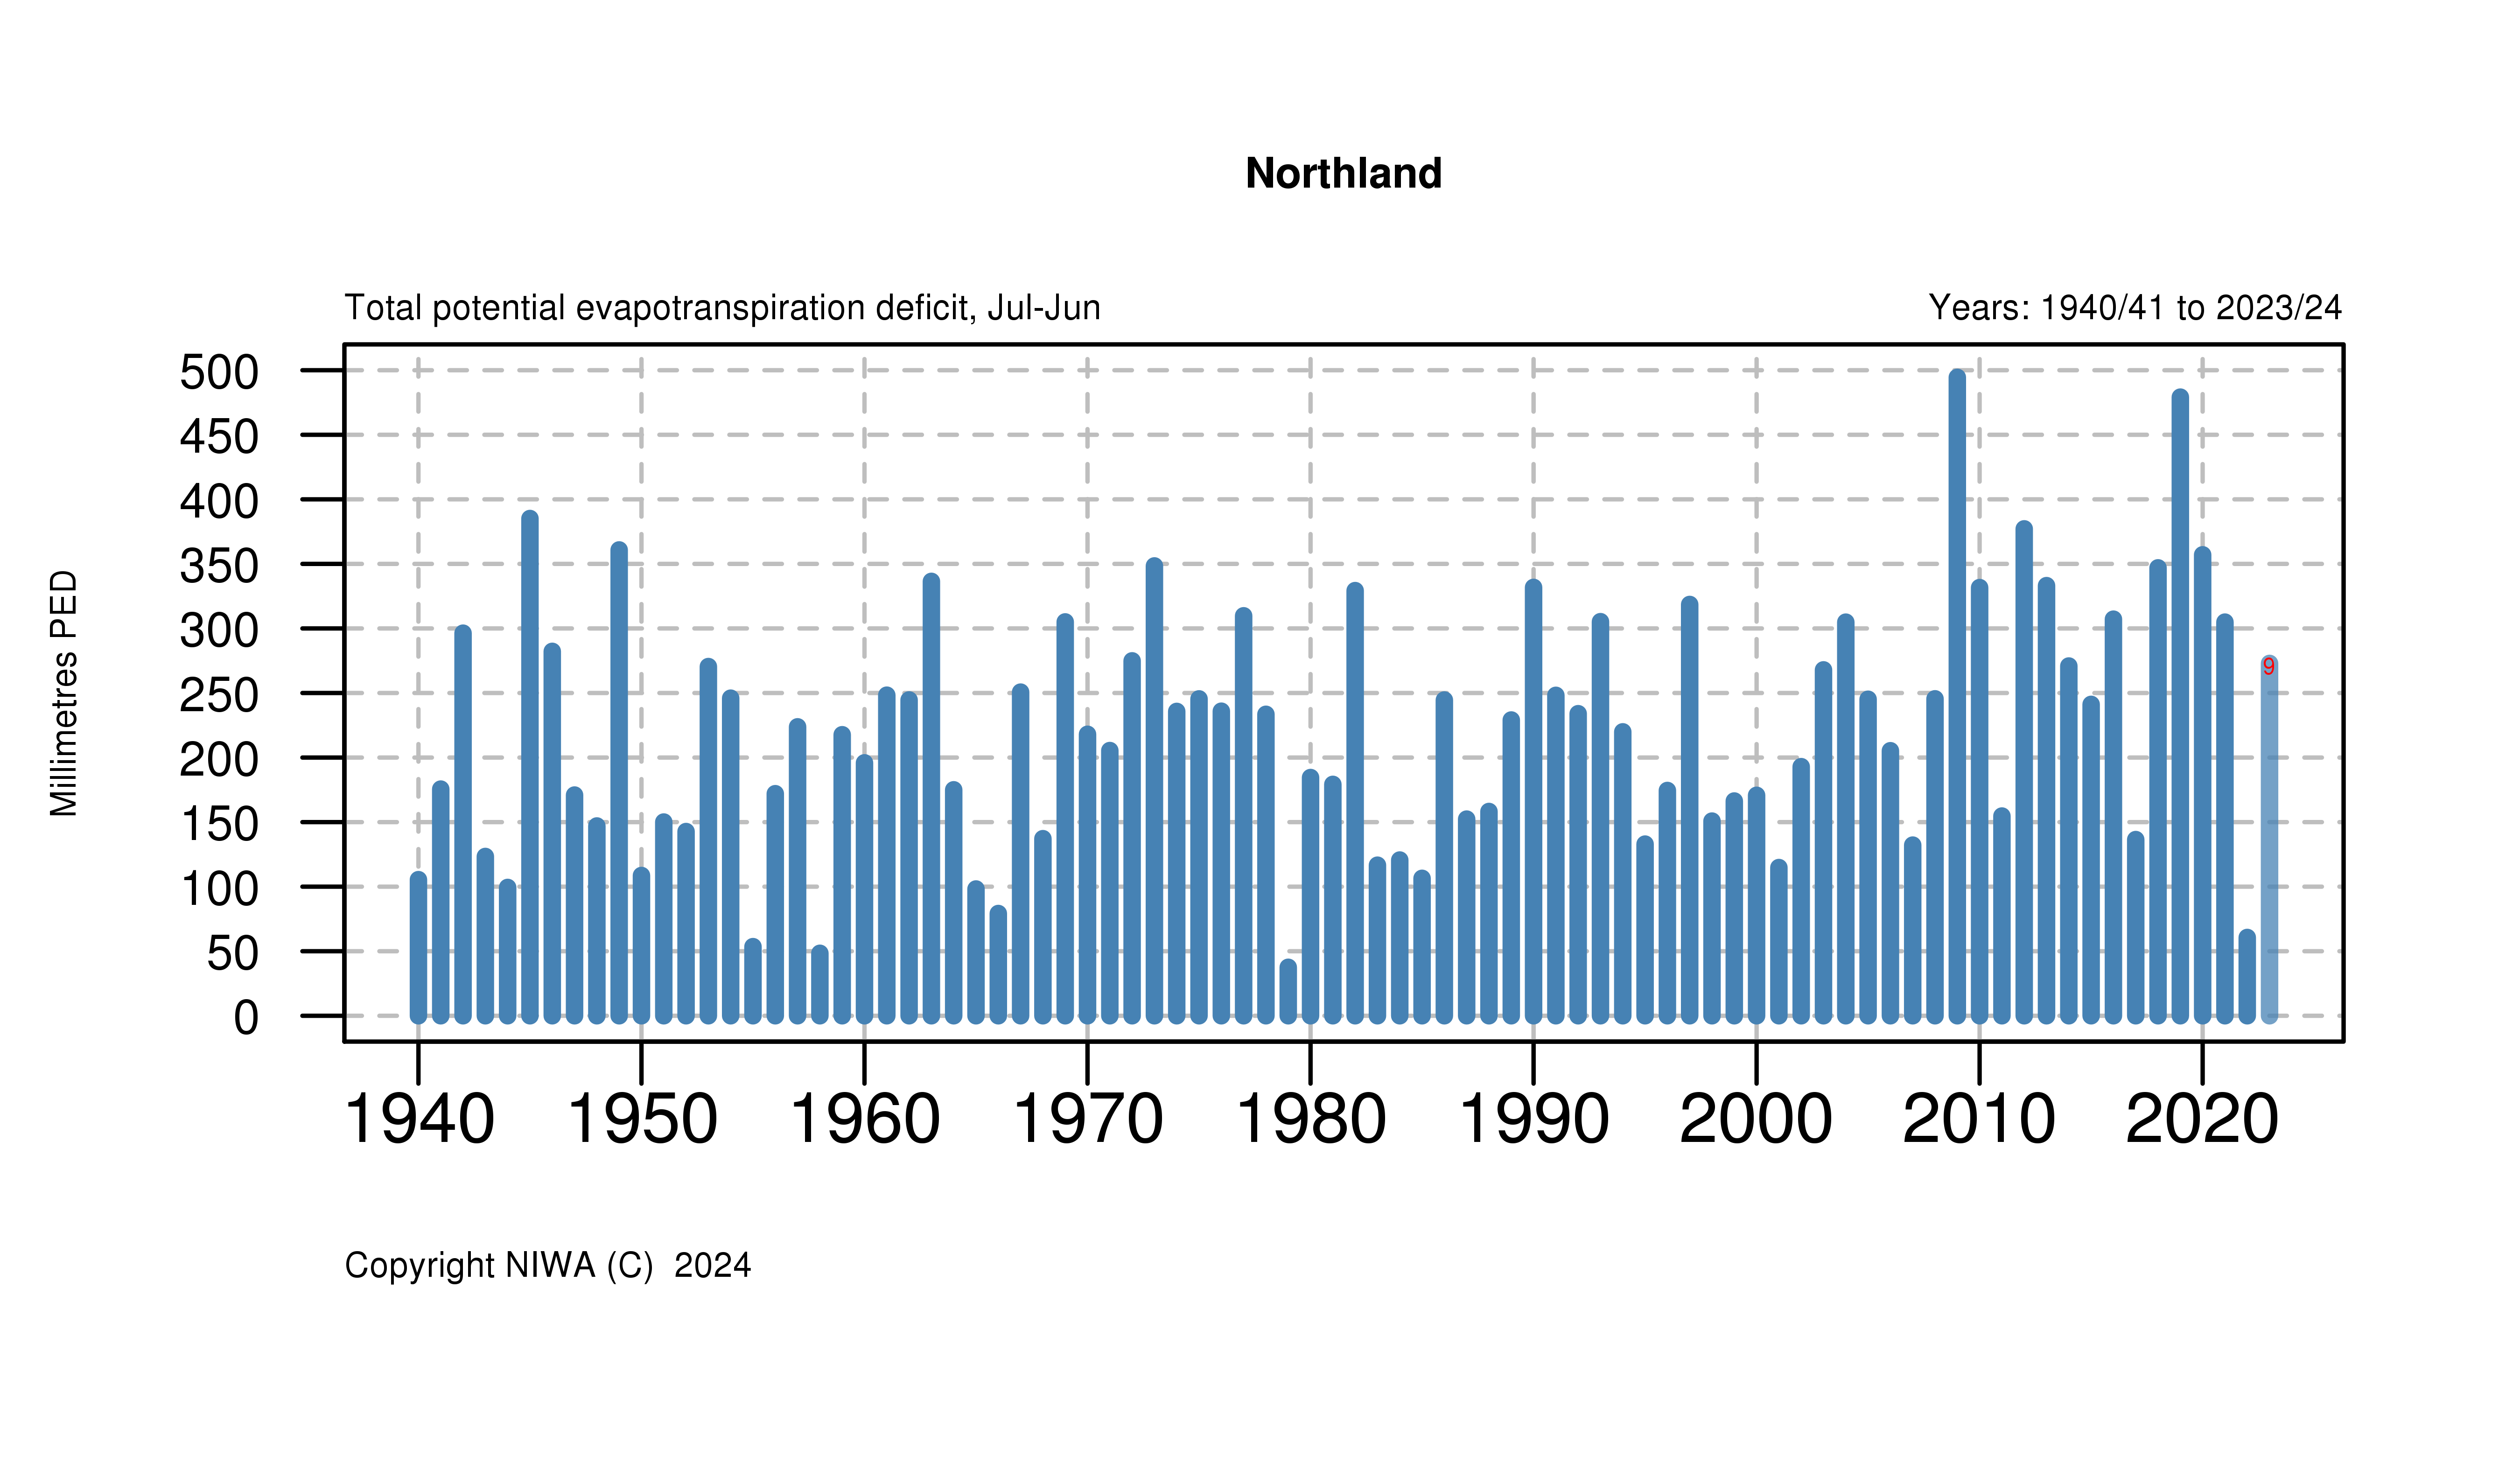
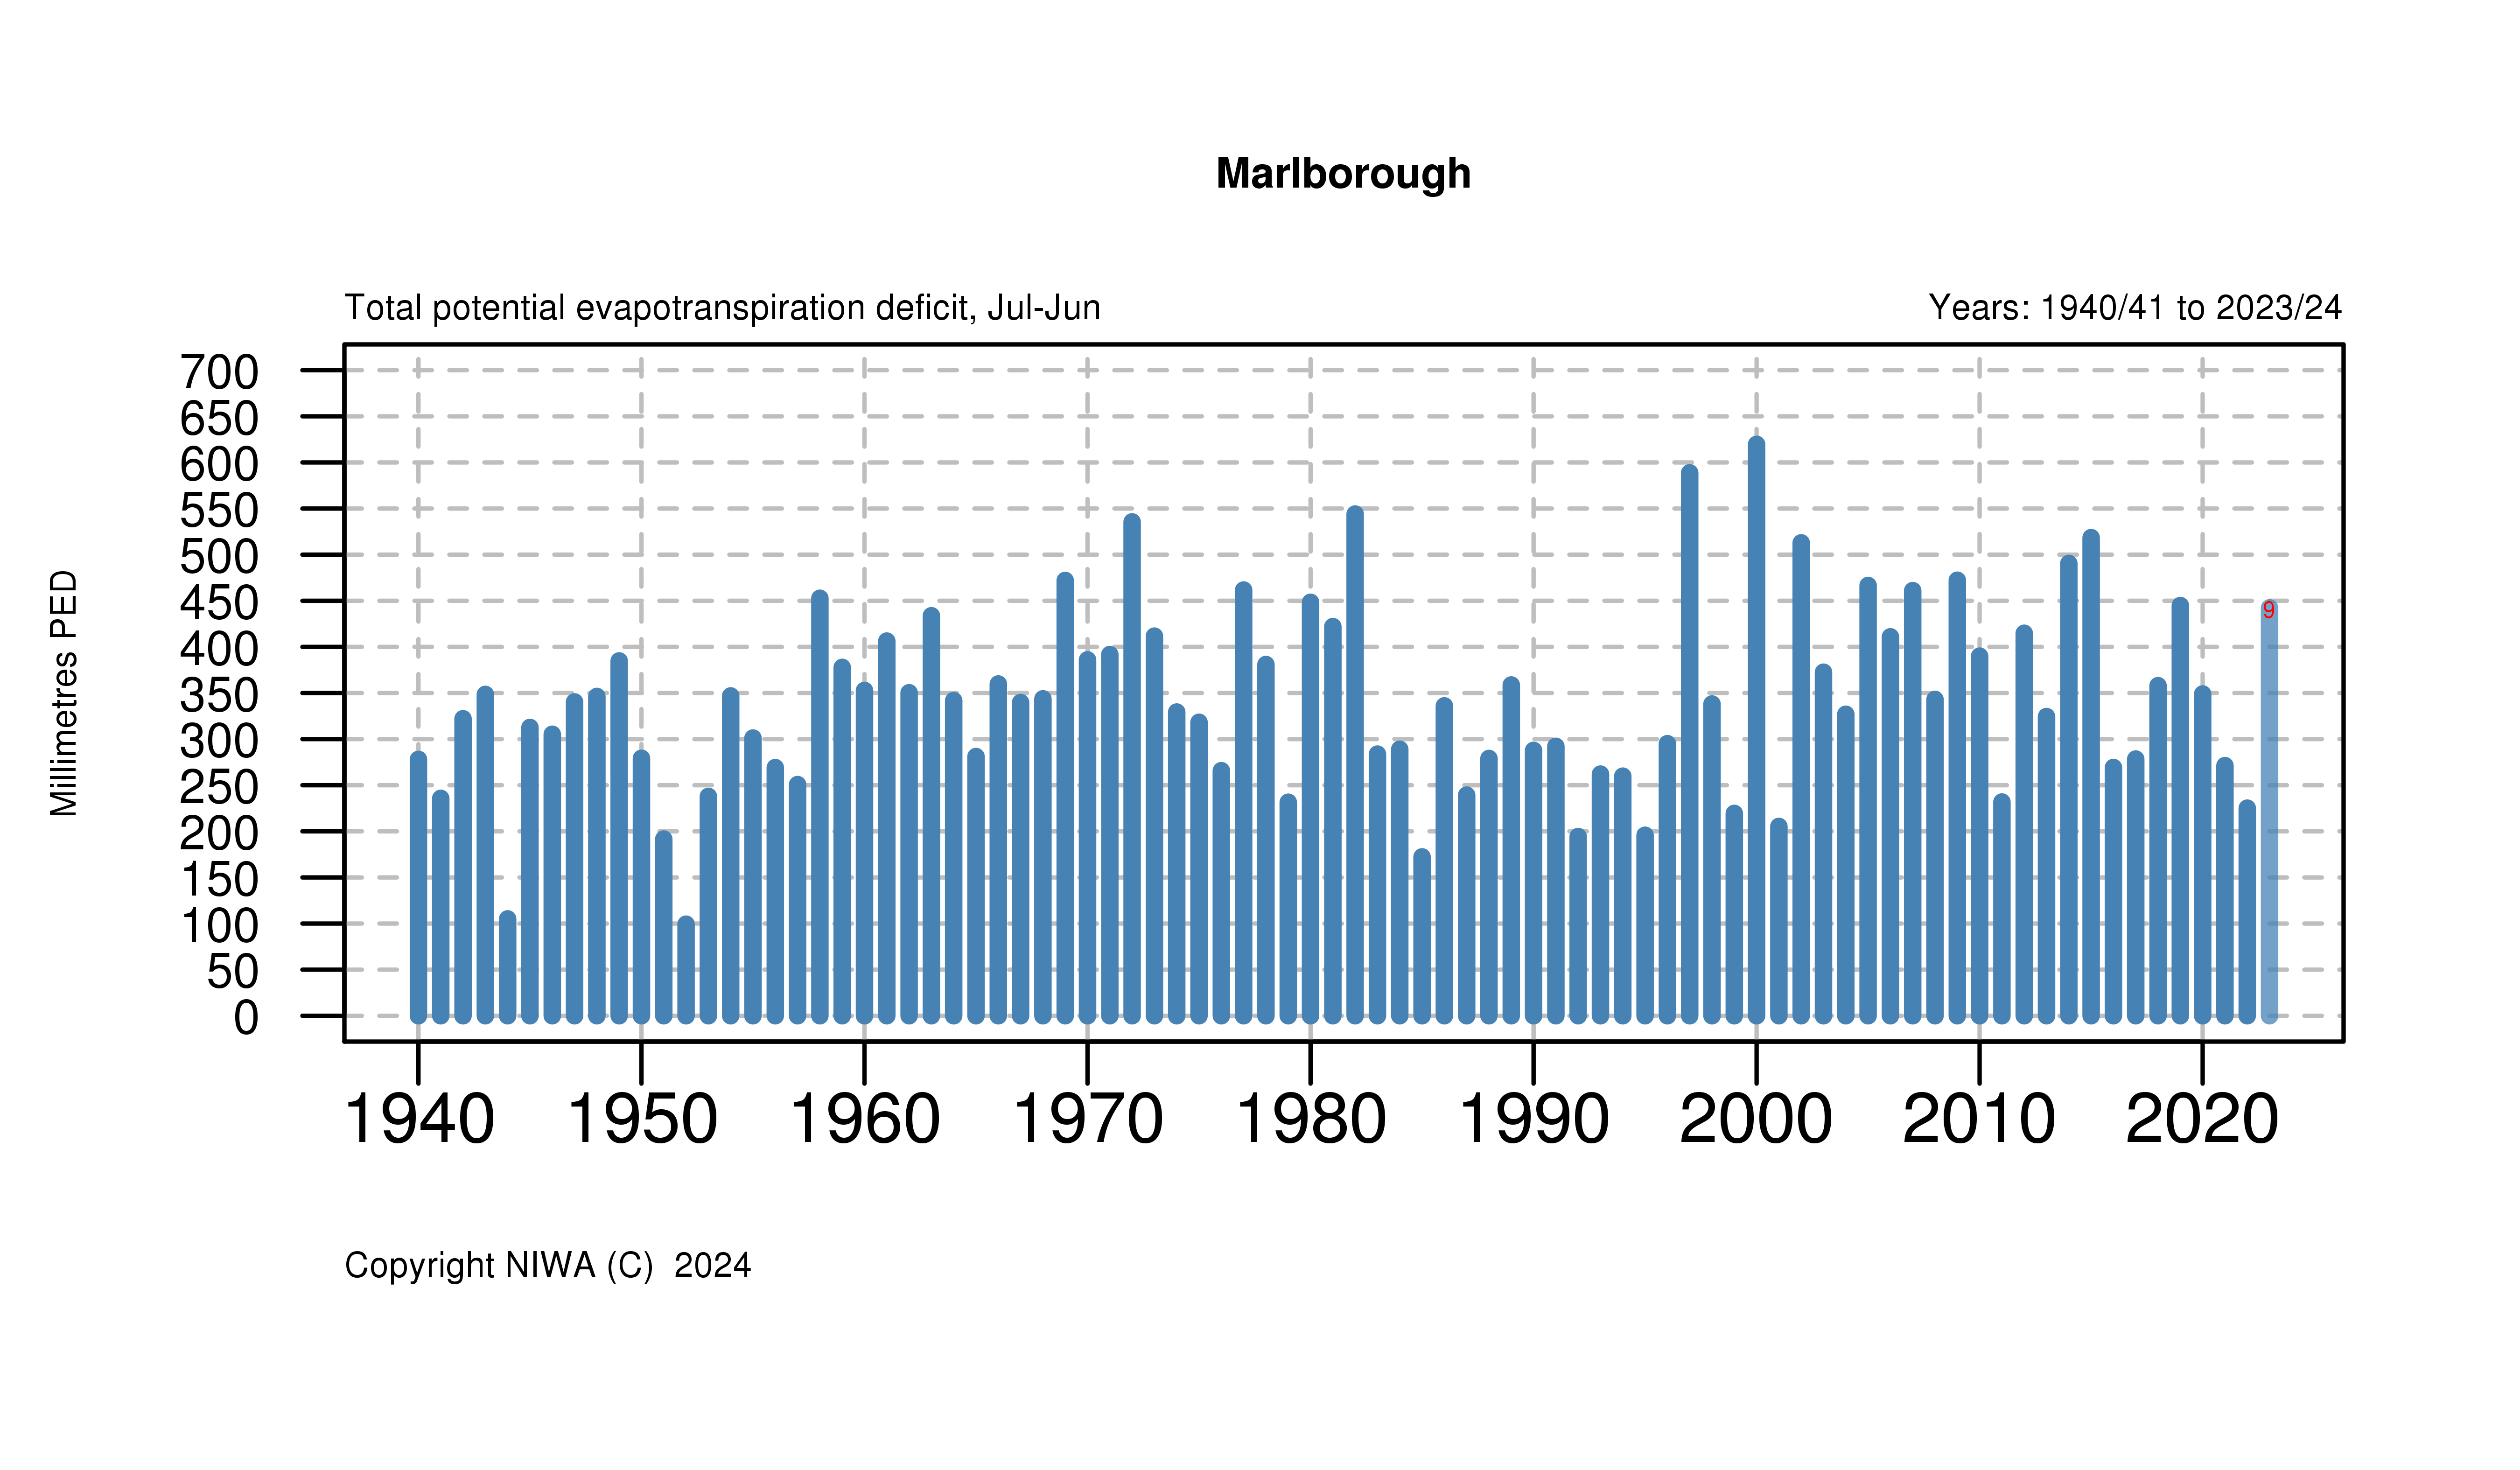
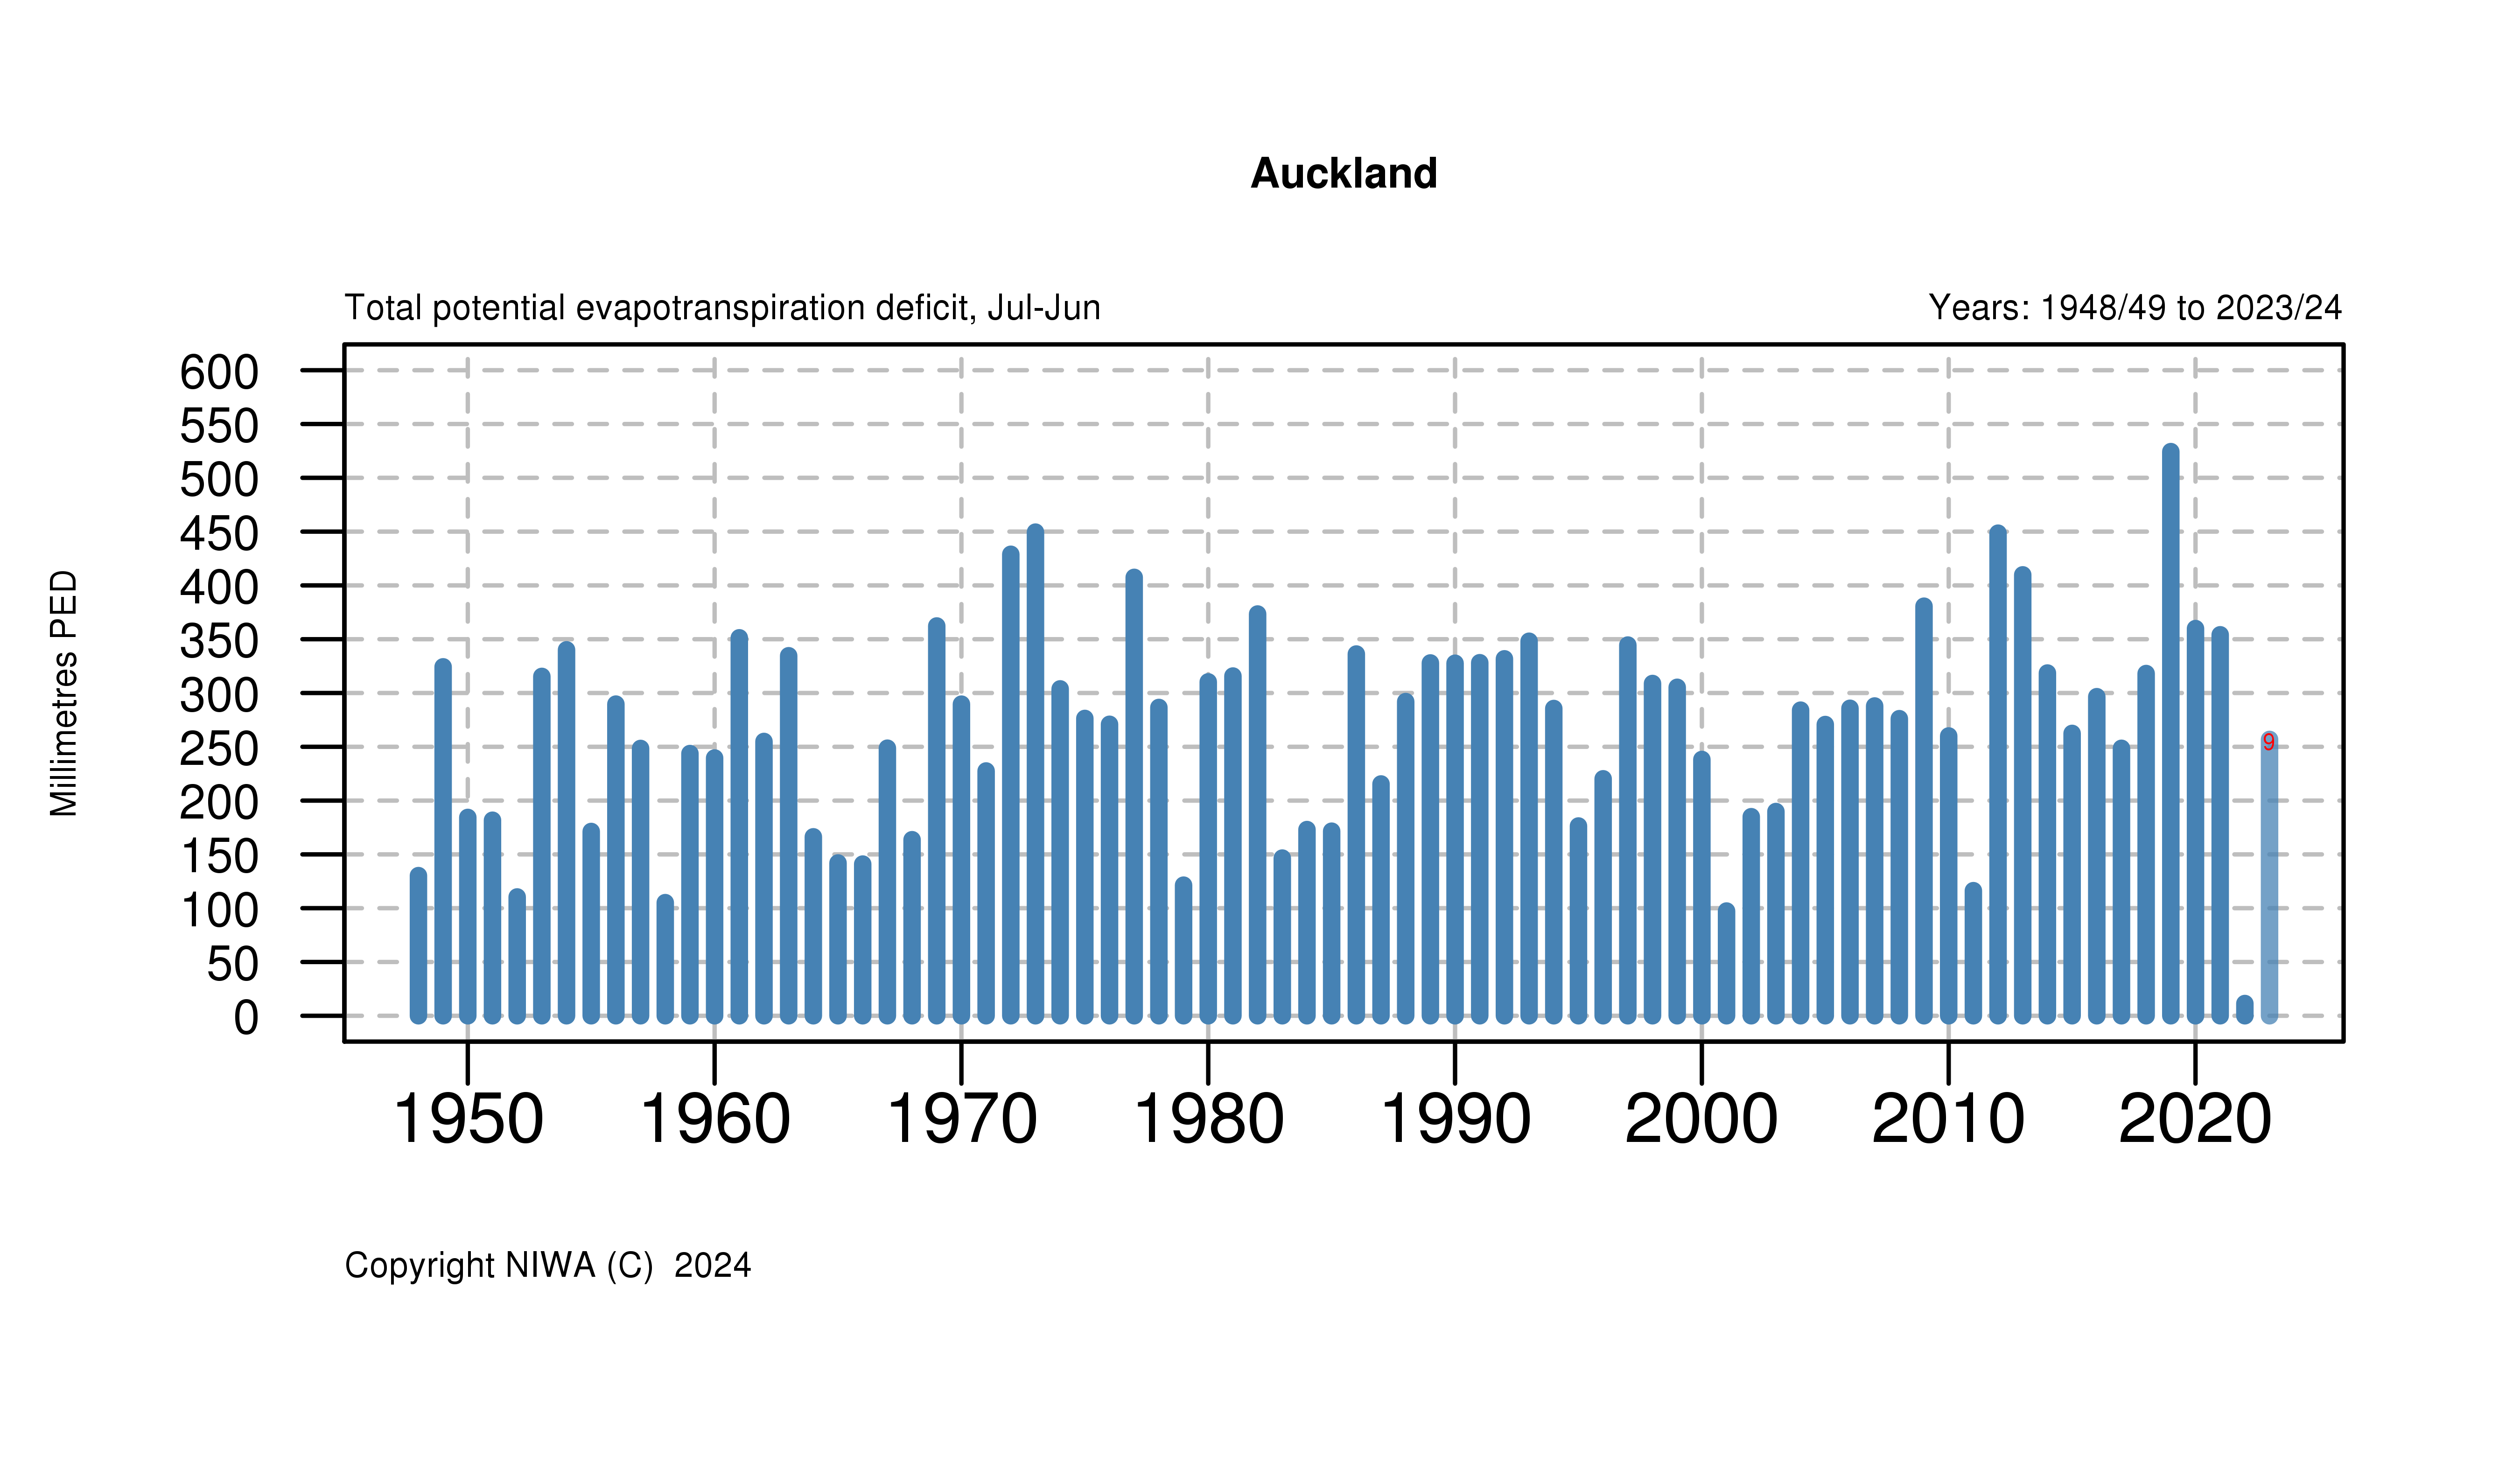
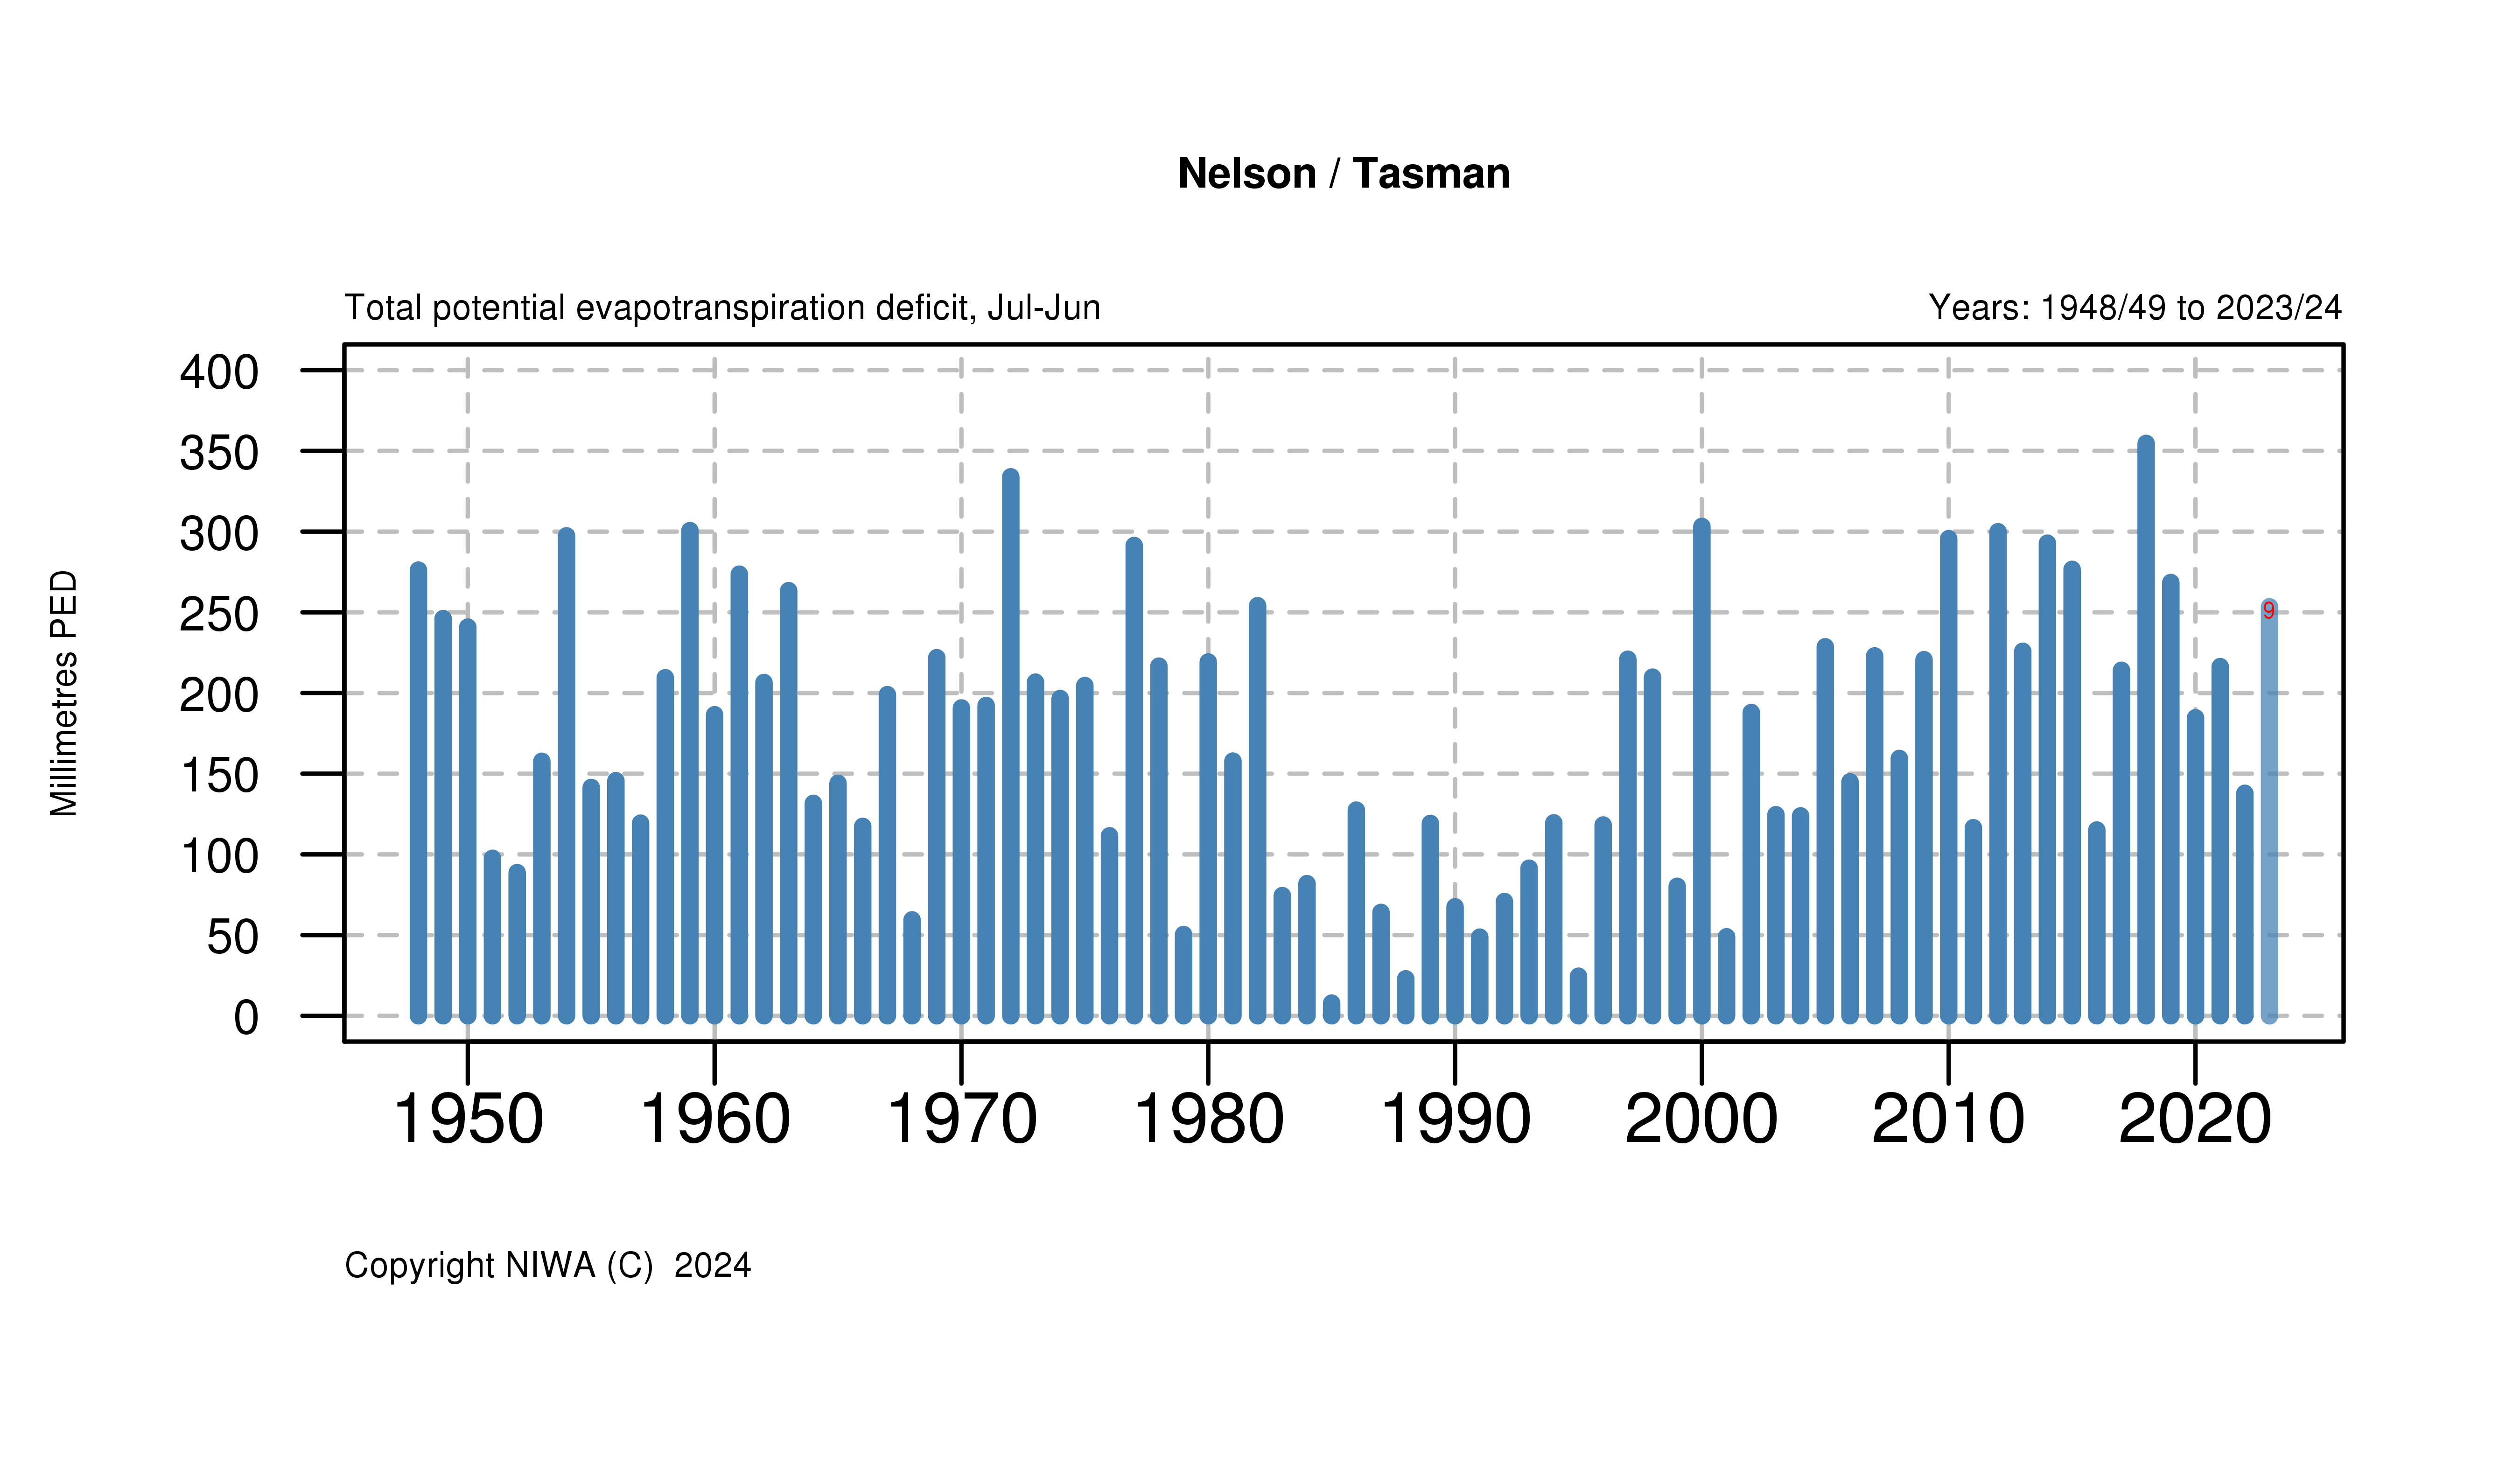
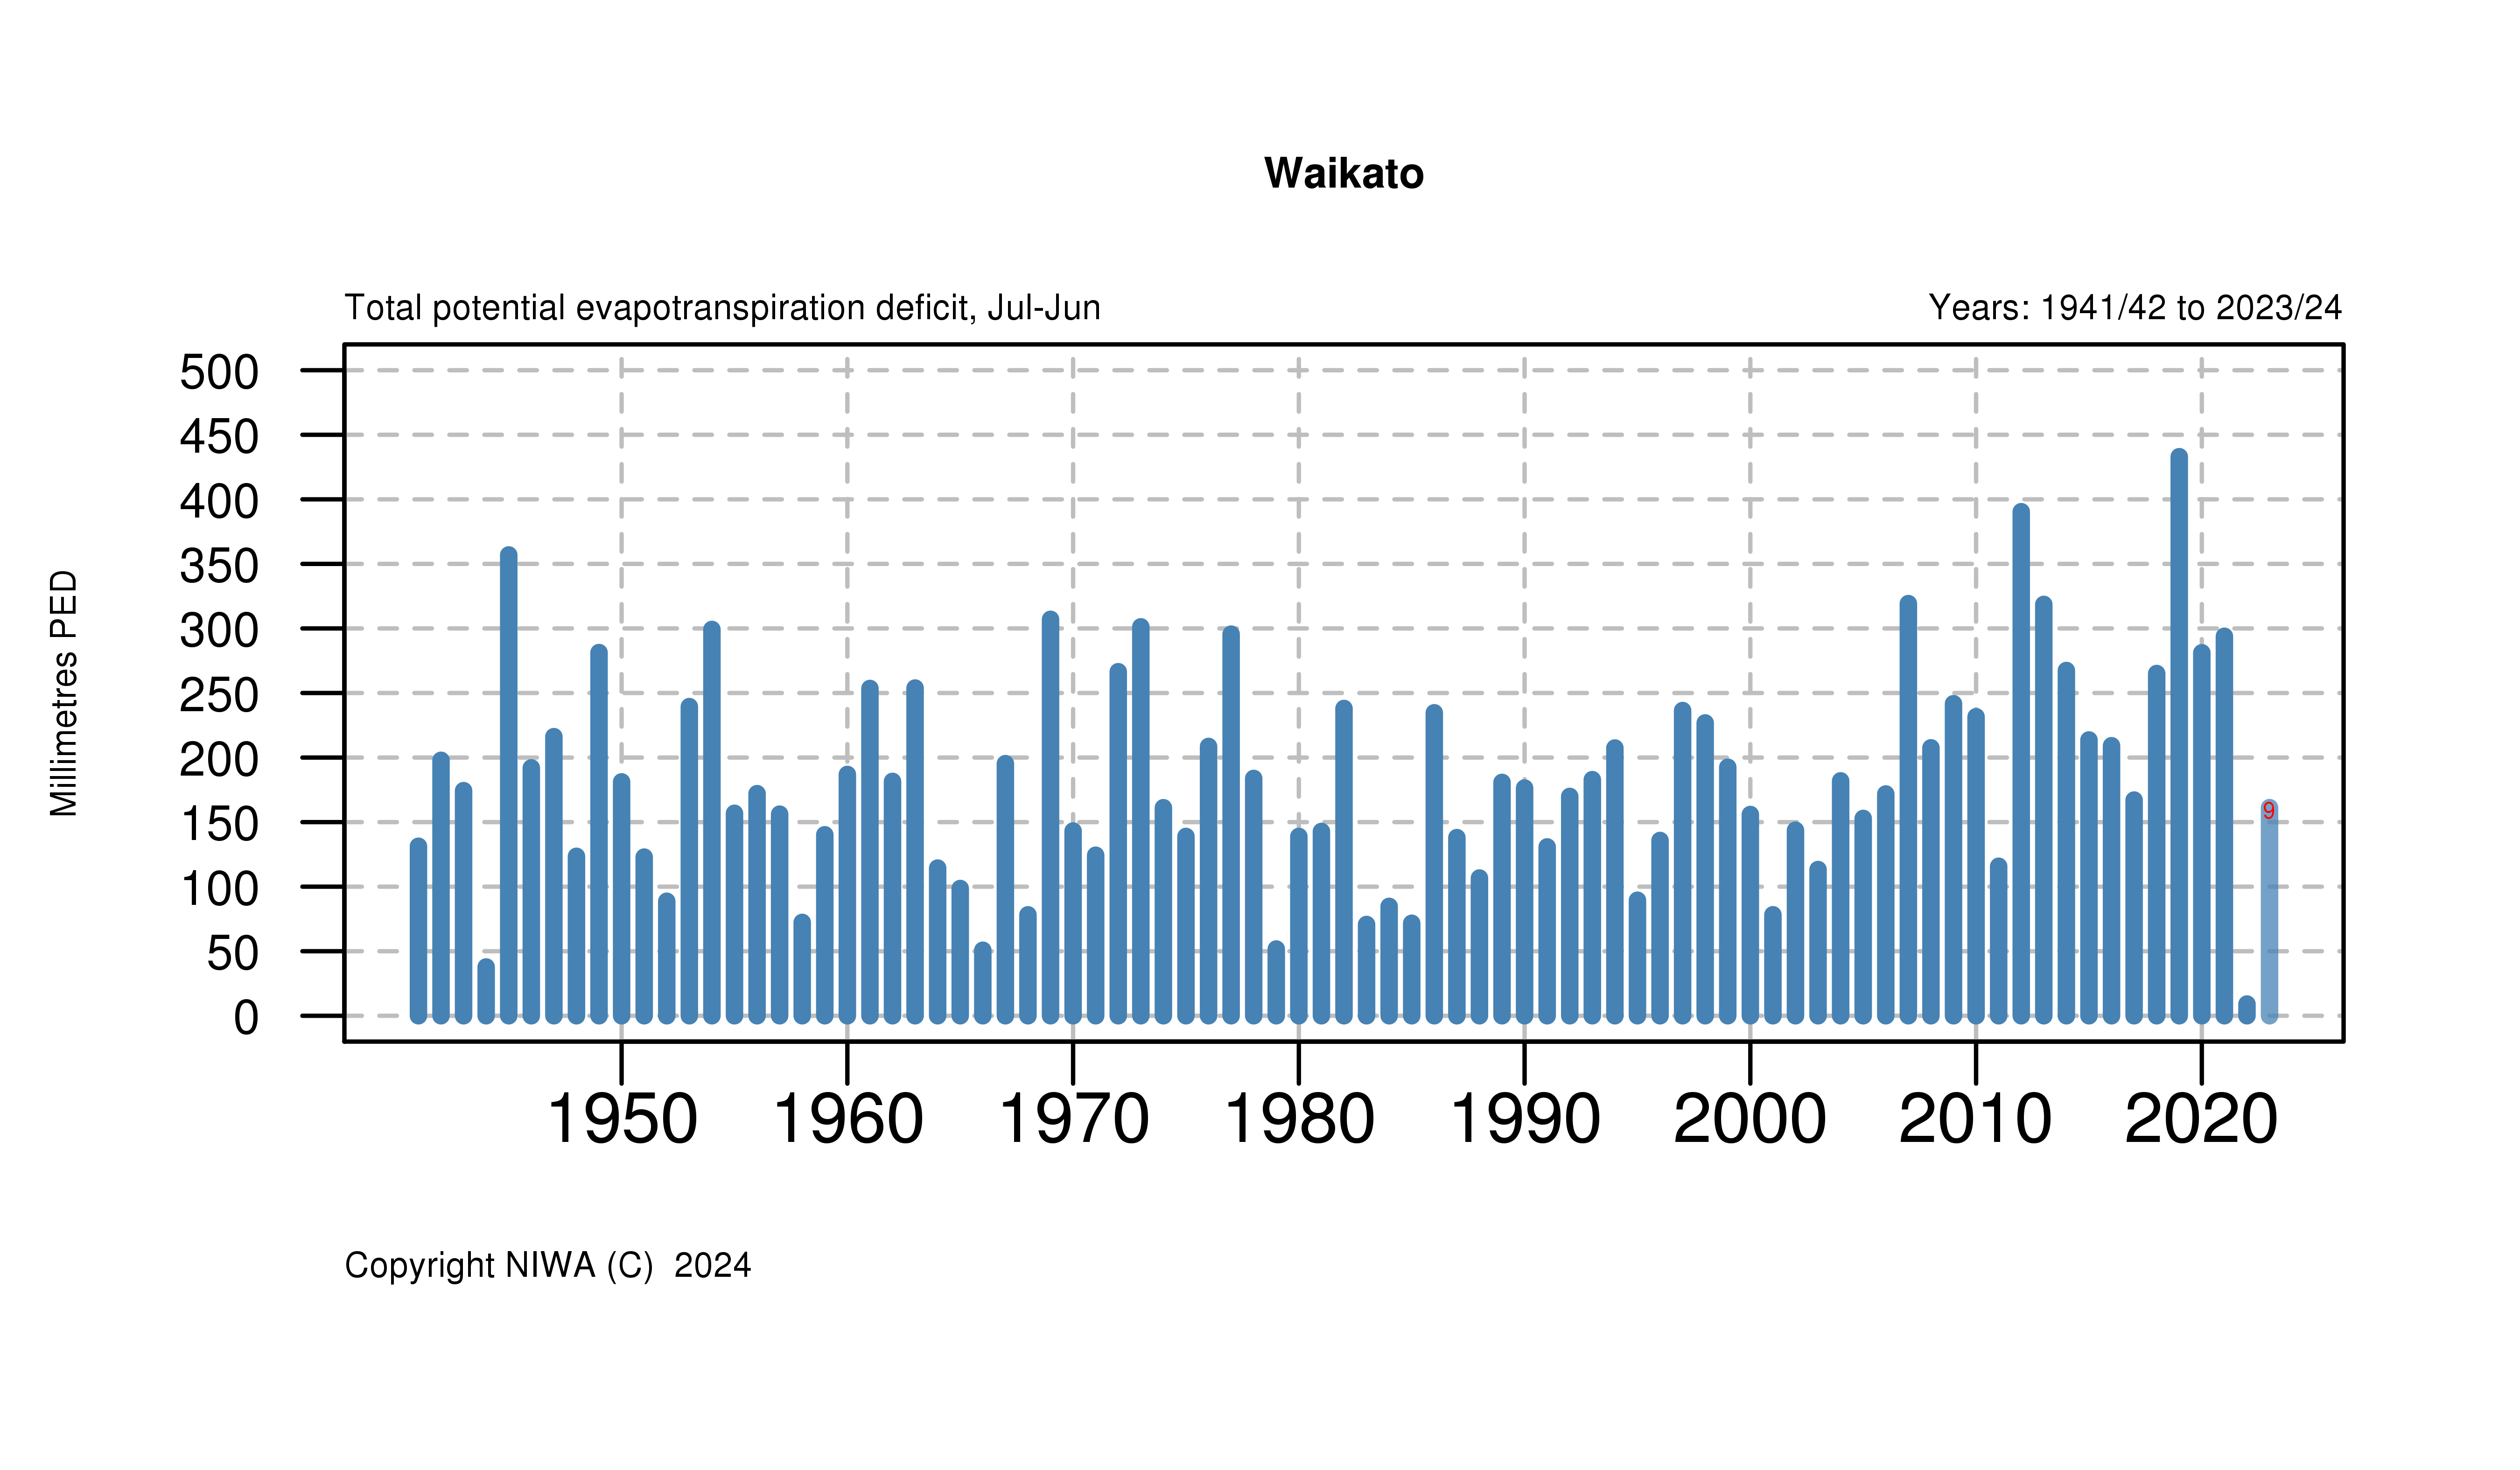
Yearly PED values are shown for each region (see map for regional boundaries). The PED values are averaged over all available climate stations in that region. A number on any of the bars indicates the number of months used in the annual PED total (no number means 12 months of data were used). The data for the current year is updated on a monthly basis (nominally on the 3rd of each month). Click on the region below for the most up-to-date chart.
All of New Zealand
The chart below shows the yearly PED chart for all of New Zealand, based on all available climate stations. Click on the image to view a larger version.


