The ensemble of global climate models for rainfall that are used in METPI show an area of higher than normal rainfall associated with the SPCZ position.
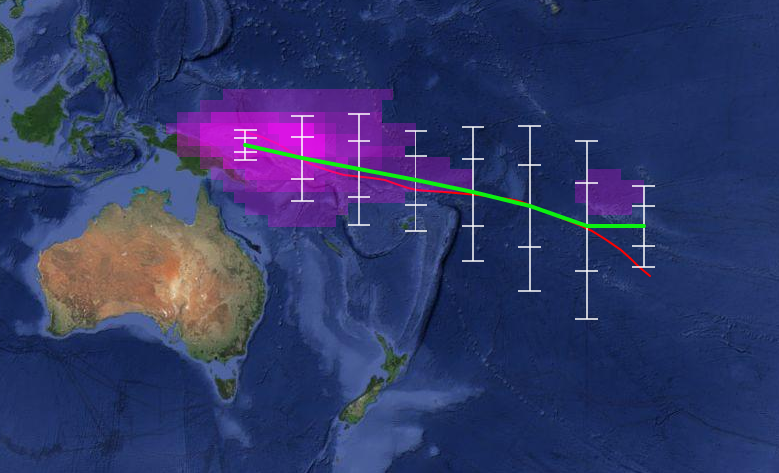
The green line indicates the average SPCZ position for the forecast period based on the average of eight climate models.
The white vertical bars and ‘whiskers’ indicate the one and two standard deviations between the model projections of the SPCZ position every five degrees of longitude.
The purple shading is proportional to the probability of intense convection developing within the SPCZ.
For November 2014 - January 2015, the SPCZ is forecast to be positioned close to normal for the time of year. However model uncertainty is quite large this month, leading to moderate confidence in the SPCZ position forecast. An area of intense convection is forecast over northern Papua New Guinea and the Solomon Islands.