The equatorial Pacific Ocean remains ENSO–neutral at the end of August 2014. Despite the Southern Oscillation Index being currently negative, a fully coupled (ocean – atmosphere) El Niño event has yet to initiate.
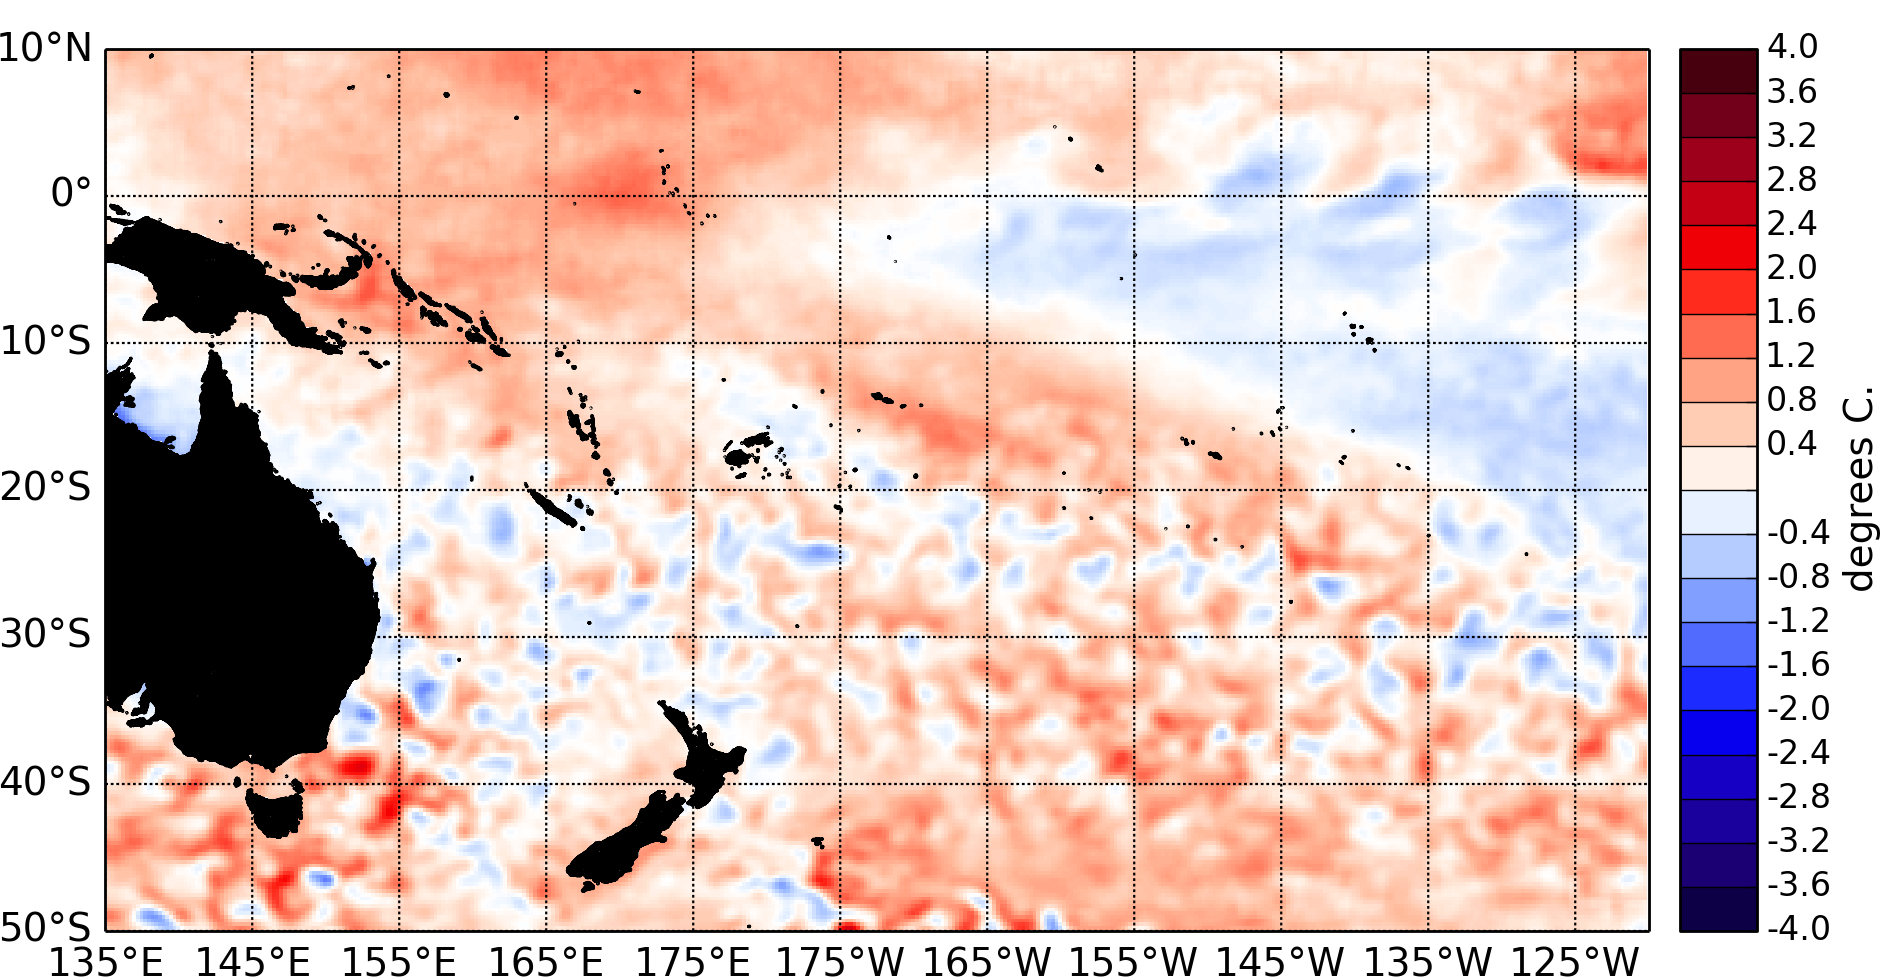
Equatorial sea–surface temperatures (SSTs) in the NINO3.4 region remain below El Niño threshold, while SST anomalies remain elevated in the western Pacific. The latest monthly anomaly values for the NINO SST indices are: 0.26°C for NINO3.4, 0.43°C for NINO3, and 0.62°C for NINO4.
The Southern Oscillation Index (SOI) is at –1.1 for August 2014, and has thus currently crossed El Niño thresholds (typically SOI values above 1 indicate La Niña, and values below –1 indicate El Niño) but it would need to remain below this value for at least 3 month for an El Niño event to be declared. On the other hand, the latest value for the TRMM ENSO index for the 30 days to 2 September is –0.82, i.e. close the La Niña threshold.
The Intertropical Convergence Zone (ITCZ) was mostly suppressed in the western Pacific and shifted north of its climatological position in the eastern Pacific. The South Pacific Convergence Zone (SPCZ) extended further east than normal for this time of year.
As was the case in July, a large region of the southwest Pacific (from Vanuatu to Tonga) experienced anomalously low rainfall in August 2014. The Madden – Julian Oscillation (MJO) was mostly inactive over the Pacific in the last two weeks of August.
The forecasts from the CPC indicate normal or reduced levels of intra-seasonal convective activity over the next two weeks. The consensus forecast from the IRI / CPC indicate that the chance of El Niño developing over the September – November 2014 period is about 55%, increasing to about 70% in December 2014 – February 2015.over the next two weeks, without propagating into the western Pacific.
