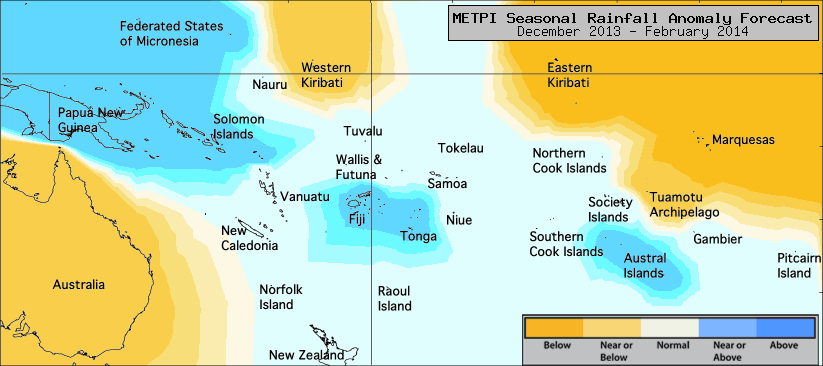
The dynamical models continue to indicate slightly drier conditions than normal in the far eastern Pacific, including parts of French Polynesia.
For the December 2013 to February 2014 period, slightly wetter than normal conditions are expected in the western Pacific and in parts of the central Pacific south of the Equator.
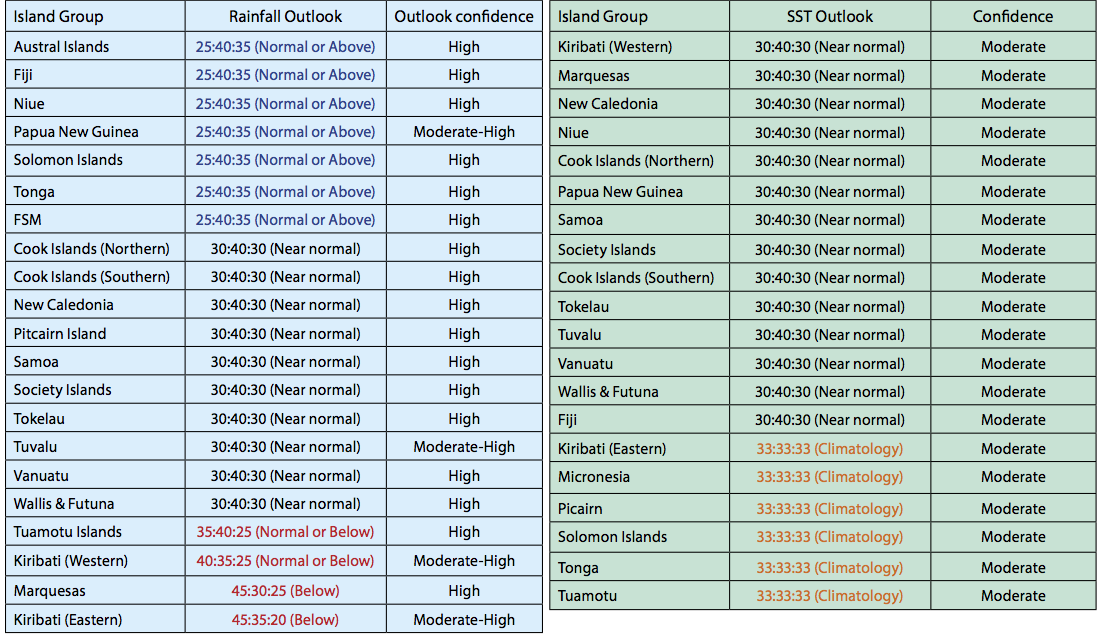
Near or above normal rainfall is forecast for the Austral Islands, Fiji, Niue, Papua New Guinea, the Solomon Islands, Tonga and the Federated States of Micronesia.
Near normal rainfall is expected for the Northern Cook Islands, the Southern Cook Islands, New Caledonia, Pitcairn Island, Samoa, the Society Islands, Tokelau, Tuvalu, Vanuatu and Wallis & Futuna.
Normal or below normal rainfall is forecast for the Tuamotu Archipelago and Western Kiribati. Below normal rainfall is forecast for the Marquesas and Eastern Kiribati.
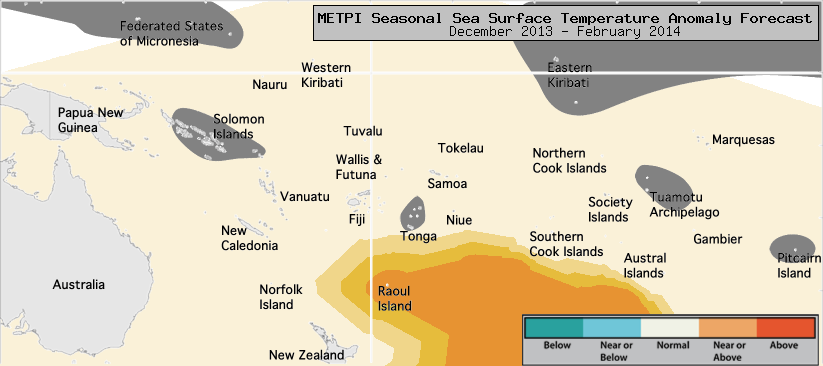
The global model ensemble forecast for SST indicates that the region of higher than normal temperatures in the central and eastern Pacific that has been present over the past six months (see Figure in ENSO section) is likely to persist over December 2013 – February 2014.
Elsewhere in the Pacific near normal SSTs are forecast. Note however that for some regions there is poor agreement between the dynamical model forecasts, leading to weak guidance.
No guidance is provided this month for Eastern Kiribati, the Federated States of Micronesia, Pitcairn Island, the Solomon Island, Tonga and the Tuamotu Archipelago.
Near normal sea surface temperatures are expected elsewhere.
The confidence for the rainfall outlook is generally high, except for Papua New Guinea, Tuvalu, Western Kiribati and Eastern Kiribati, where uncertainty is greater.
The average region–wide hit rate for rainfall forecasts issued in December is 73 %, 6 % higher than the long–term average for all months combined.
The confidence is moderate for the SST forecasts.
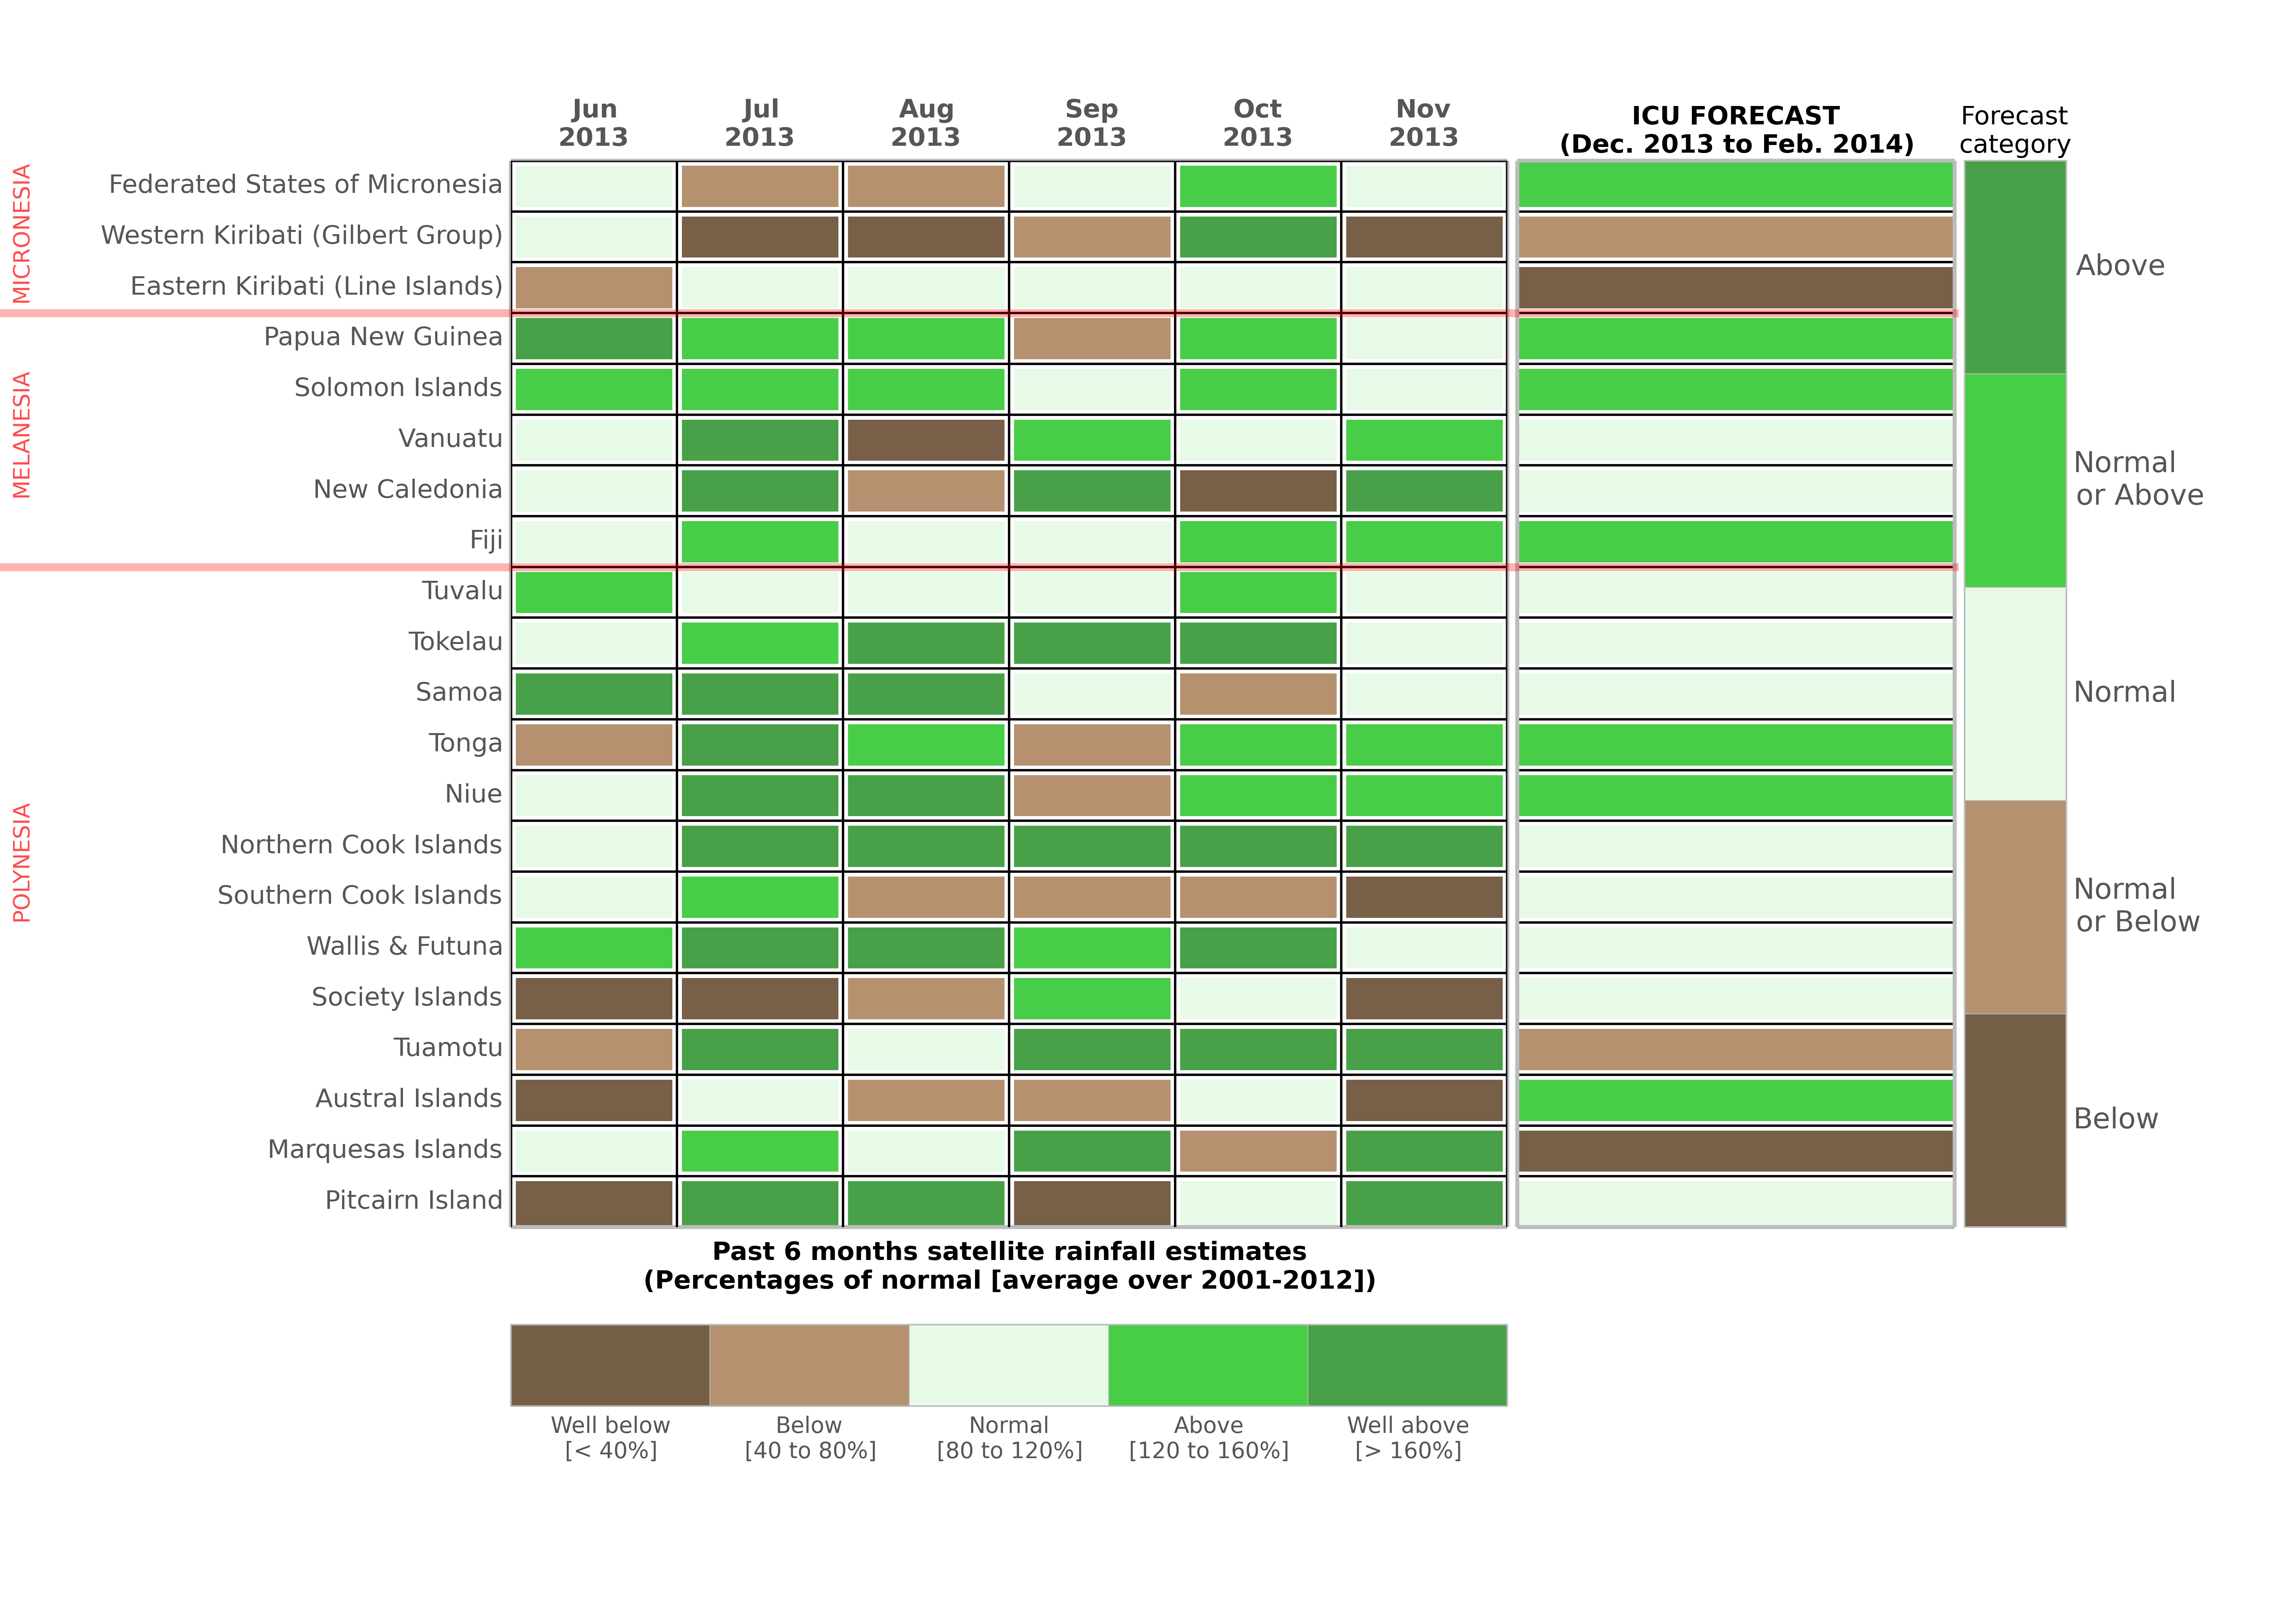
The figure on the bottom right presents the last six months rainfall anomalies for each Island group alongside the latest ICU rainfall forecast for the December 2013 - February 2014 period.
The past 6 months rainfall anomalies are based on the near-real-time TRMM (Tropical Rainfall Measurement Mission) merged satellite product.
TRMM →
The data has been downloaded at ftp://disc2.nascom.nasa.gov/data/TRMM/Gridded/Derived_Products/3B42RT/D….
For each Island group, the monthly value is derived from the average of all grid-points (or "pixels") in the TRMM Dataset that intersect a coastline, to ensure that the values correspond as closely as possible to rainfall on land, and excluding rainfall falling on ocean surfaces.
The climatology used has been established over the 1998 – 2012 period. The categories ("Well-below", "Below", etc) are determined according to the percentage of the normal rainfall for that month. The thresholds are indicated in the colorbar at the bottom: to give an example, "Well-below" normal rainfall means the rainfall for that month was under 40 % of the normal rainfall, "Below" normal rainfall means that between 40 and 80 % of normal rainfall was received, etc.
IMPORTANT NOTE:
Please note that, while we use the same color-scheme for the past rainfall anomalies and the ICU forecast, the type of information presented is different. In the case of the past 6 months, actual rainfall has been estimated by satellite, and the categories are well-defined by monthly estimated rainfall compared to the long-term mean.