Download the seabed!
Highly detailed maps of New Zealand’s seabed are now freely available on NIWA’s website.
The high-resolution maps show the hidden seabed of the deep sea around the country in incredible digital detail, making them a treasure for all New Zealanders.
They give an unprecedented insight into the shape of the ocean floor – ridges, volcanoes, plateaus, canyons and seamounts. The data presents digital terrain models generated from multibeam data, combined with traditional bathymetric data.
The 250-metre-resolution digital terrain maps of New Zealand’s Exclusive Economic Zone are available in multiple high-resolution file formats to suit many current and future needs. The dataset provides the most up-to-date bathymetry of the major features from one of the largest areas of deep-water seabed under our national jurisdiction.
“These maps produce significant benefit for all New Zealanders and for all users of the marine environment, revealing potential for fisheries, environmental management, conservation, hazard mitigation, and energy and mineral opportunities,” says NIWA Marine Database Manager, Kevin Mackay.
NIWA are proven specialists in fine-detail mapping and advanced bathymetric data analysis. These maps are the culmination of NIWA’s geological, oceanographic, and fisheries research, and their collection of high-resolution sea-floor images from around New Zealand. They also incorporate significant worldwide data sets.
NIWA Chief Scientist Māori Development & Oceans, Dr Charlotte Severne, says putting the maps online is an opportunity to showcase the extent of what NIWA does.
“These are the best map product around. They include an extensive area of 11.7 million square kilometres, an area that extends past the continental shelf, and to depths of up to 11 000 metres,” says NIWA geologist, Dr Helen Neil. “They are the product of truly sophisticated seafloor mapping combined with expert marine geological knowledge.”
New Zealand has the world’s fourth biggest Exclusive Economic Zone. This ocean and sea floor is a massive area of nearly four million square kilometres, and it’s New Zealand’s biggest resource.
So what can you get and what can you do with theses files? The data products start from low-resolution images of the New Zealand region, from the Pacific Islands to the Southern Oceans, for use as a general background to maps, reports and assignments. There is a high-resolution image of the NZ region able to be zoomed in to for more detailed information and planning. At the top end are high-resolution 250 metre gridded Geographical Information Systems (GIS) products for use by mapping professionals. To download the maps go to: /our-science/oceans/bathymetry
The digital products and bathymetry project are the culmination of effort at NIWA, supported by funding from the Foundation for Research, Science and Technology and the Royal New Zealand Navy, the US National Geophysical Data Center, Institute Francais de Recerche pour l’Exploitation de la Mer, and Land Information New Zealand.
The maps (bathymetry) of NZ online, were produced from 2 593115 km2 of swath coverage and 5 005 568 kilometres of single-beam survey lines. That’s equivalent to nearly 30 years at sea.
To find out how the seafloor is mapped visit: /our-science/vessels/common-questions/all/seafloor-mapping
Mapping out their history – NIWA’s bathymetry
NIWA’s history of bathymetry is intertwined with the history of New Zealand. Seafloor mapping records date back to early Māori, and to early European explorers. One of the first maps drawn of the seafloor was by an old chief, Toiawa, on the deck of the Endeavour in 1769. Captain James Cook gauged water depth by lowering a weighted, adjustable rope to the seabed – a technique used in ancient Egyptian times.
Systematic recording of ocean depths began in coastal waters with the settlement of New Zealand. However charts of the southwest Pacific Ocean did not appear until about 1895 with the publication of results from the first, world-wide ocean survey - the Challenger expedition of 1873-76. This voyage saw the first depth sounder, but soundings were few, and barely identified features on the sea ocean floor.
The next 60 years saw more detailed and extensive surveys by naval and research ships, and our view of the ocean floor began to take shape.
The echo-sounder was invented and used around 1912, and the accuracy and speed of surveying increased.
Marine surveys flourished in the 1950s with the deployment of the naval ship Lachlan, the creation of the New Zealand Oceanographic Institute, and more arrivals of foreign vessels. By 1967, most major features on the ocean floor had been charted. From 1974 onwards data was collected by the Royal New Zealand Navy, who were operating satellite systems.
By 1998, geographical positioning systems (GPS) as we know them were introduced and in use.
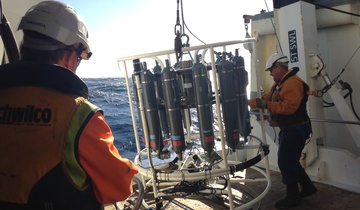
New technologies continue to uncover the face of the sea floor. The multibeam echo sounder system used by NIWA calculates water depth. It uses a fan of sound beams to build up a 3-D picture of the seafloor.
Contact