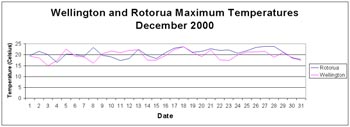
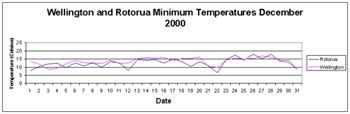
The graphs to the right show the maximum and minimum temperatures for December in Rotorua and Wellington.
Click on a graph to enlarge.
- Which city had the highest temperature? What was it? What date was it on?
- Which city had the lowest temperature? What was it? What date was it on?
- If your answer for questions 1 and 2 is the same city, why do you think this is?
- Which city jumped around the most in temperature? Why do you think this city's temperature is more variable than the other city? (Think of the location of the cities in New Zealand)
- Was there a date in the month on which both cities had the same minimum temperature? If so, what date was it and what was the temperature?
- Which city would you want to live in based on the weather you see? Why?
Teacher background to "What's up with the weather?"
Achievement objectives
Within a meaningful context students will be able to:
- Communicate features in measurement data. [S4.3]
- Report the distinctive features of data displays [S4.5]
- Sketch and interpret graphs which represent everyday situations [A5.3]
Mathematics in the New Zealand Curriculum
Students may be provided with the data to draw their own graphs.
Answers
- Rotorua has the highest temperature of 23.8°C on the 27 and 28 December. Wellington's highest was 23.6°C on 18 December.
- The lowest temperature was 6.6°C in Rotorua on 22 December. Wellington's lowest temperature was 8.6°C on 3 December.
- Rotorua is inland and not affected by the sea which cools the day temperatures and warms the night temperatures. It also has a higher altitude.
- Rotorua's temperature is more variable because it does not have the moderating effect of a large body of water nearby which tends to lessen the temperature extremes.
- Yes. On 23 December the temperature was 14.4°C.
- Wellington, because the temperatures are less variable. The range between the maximum and minimum temperatures in Rotorua is greater than in Wellington. However this is not necessarily the only aspect of weather you would need to consider.
Data tables
Rotorua Temperatures
| Maximum | Minimum | |
|---|---|---|
| 1/12/00 | 19.6 | 7.9 |
| 2/12/00 | 21.5 | 10.4 |
| 3/12/00 | 20.1 | 12.1 |
| 4/12/00 | 16.4 | 12.2 |
| 5/12/00 | 20.3 | 9.5 |
| 6/12/00 | 20.1 | 12.7 |
| 7/12/00 | 19.3 | 10.8 |
| 8/12/00 | 23.4 | 12.9 |
| 9/12/00 | 19.8 | 10.0 |
| 10/12/00 | 19.0 | 13.4 |
| 11/12/00 | 17.3 | 12.6 |
| 12/12/00 | 18.3 | 7.9 |
| 13/12/00 | 22.5 | 14.4 |
| 14/12/00 | 19.6 | 14.2 |
| 15/12/00 | 18.2 | 14.5 |
| 16/12/00 | 20.9 | 12.5 |
| 17/12/00 | 23.0 | 15.0 |
| 18/12/00 | 23.7 | 13.3 |
| 19/12/00 | 21.1 | 10.3 |
| 20/12/00 | 21.5 | 13.4 |
| 21/12/00 | 22.7 | 10.9 |
| 22/12/00 | 22.0 | 6.6 |
| 23/12/00 | 22.2 | 14.4 |
| 24/12/00 | 20.7 | 17.4 |
| 25/12/00 | 21.9 | 14.2 |
| 26/12/00 | 23.3 | 18.0 |
| 27/12/00 | 23.8 | 15.1 |
| 28/12/00 | 23.8 | 18.1 |
| 29/12/00 | 21.2 | 13.8 |
| 30/12/00 | 18.6 | 14.0 |
| 31/12/00 | 17.5 | 8.2 |
Wellington Temperatures
| Maximum | Minimum | |
|---|---|---|
| 1/12/00 | 19.3 | 13.3 |
| 2/12/00 | 18.6 | 11.7 |
| 3/12/00 | 15.0 | 8.6 |
| 4/12/00 | 17.3 | 9.3 |
| 5/12/00 | 22.6 | 12.0 |
| 6/12/00 | 19.3 | 14.3 |
| 7/12/00 | 19.0 | 12.8 |
| 8/12/00 | 16.1 | 12.2 |
| 9/12/00 | 20.4 | 12.4 |
| 10/12/00 | 21.7 | 14.3 |
| 11/12/00 | 20.9 | 12.2 |
| 12/12/00 | 22.0 | 12.7 |
| 13/12/00 | 22.2 | 15.4 |
| 14/12/00 | 17.5 | 15.8 |
| 15/12/00 | 17.5 | 15.6 |
| 16/12/00 | 19.6 | 15.8 |
| 17/12/00 | 22.4 | 13.9 |
| 18/12/00 | 23.6 | 15.2 |
| 19/12/00 | 20.9 | 15.3 |
| 20/12/00 | 19.1 | 16.1 |
| 21/12/00 | 22.2 | 10.4 |
| 22/12/00 | 17.7 | 10.0 |
| 23/12/00 | 17.3 | 14.4 |
| 24/12/00 | 19.9 | 15.5 |
| 25/12/00 | 21.3 | 14.9 |
| 26/12/00 | 21.2 | 15.2 |
| 27/12/00 | 21.5 | 16.9 |
| 28/12/00 | 18.9 | 16.1 |
| 29/12/00 | 21.0 | 14.6 |
| 30/12/00 | 18.7 | 12.6 |
| 31/12/00 | 17.9 | 9.2 |