In this activity you will analyse the Southern Oscillation Index and investigate the chances of getting below normal, normal or above normal summer temperatures in Invercargill.
Background: The El Niño–Southern Oscillation Phenomenon (ENSO)
El Niño and La Niña are long-term climate events that affect the temperature and rainfall pattern of New Zealand. They are opposite extremes of the ENSO cycle which is a pattern of fluctuations in atmospheric pressures around the globe.
The Southern Oscillation Index (SOI) is derived from the difference in barometric pressure between Tahiti and Darwin. Pressures are normally higher in Darwin than Tahiti during an El Niño. Scientists use the SOI to help establish whether El Niño is present and how strong it is. A strong negative SOI (more than -1) indicates an El Niño and a strong positive value (more than +1) indicates a La Niña.
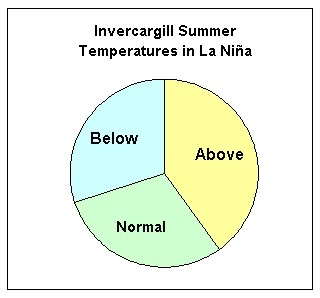
The ENSO cycle affects rainfall and temperature in New Zealand. During a La Niña warmer than normal temperatures typically occur over much of New Zealand.
In a La Niña period Invercargill has a greater chance of above normal summer temperatures.
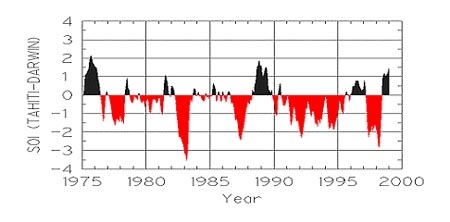
The graph below shows the SOI values from 1975 to 1999.
- Explain how the graph shows whether there is an El Niño or a La Niña event?
- When did the last El Niño event occur and how long did it last?
- What is the range of values for the SOI during this period?
- Looking at the SOI graph, describe the climatic conditions you would have expected to occur from 2000 to 2001. Did your answer agree with what actually happened?
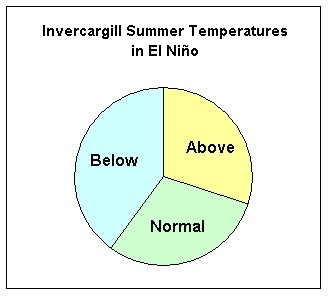
In an El Niño event, Invercargill has a greater chance of below normal summer temperatures. In a La Niña event summer temperatures are more likely to be above normal. The probabilities for summer temperatures in Invercargill are shown in the table below.
| El Niño | La Niña | |
|---|---|---|
| Above normal | 30% | 40% |
| Normal | 30% | 30% |
| Below normal | 40% | 30% |
These probabilities can be represented as proportions of a pie chart During “Normal” conditions all the proportions would be equal. During El Niño the “Below” category is largest. The proportions for each category will actually depend on the strength of the El Niño or La Niña event and will differ from location to location and from season to season.
“Normal” refers to the Standard 30 year Normal period 1961 – 1990. A standard normal period is chosen to ensure that climate averages are calculated on a consistent period. 30 years is considered long enough to calculate a representative average and to reduce the impact that one-off, very extreme events have on the average.
Activity:
Work in pairs. Print and cut out the El Niño pie chart given in the printable pdf file and make a spinner by attaching it loosely to a square piece of card using a split pin. Allow more than 5mm from the head before bending the split pin. Place a washer between the pieces and ensure that the hole is large enough for the pie chart to spin freely. Make an arrow on the square base as shown in the diagram in the pdf file.
Printable pdf (PDF 35 KB)
Questions
- Spin the El Niño year wheel 100 times and record the condition of the temperatures in a tally chart using the headings: Above, Below and Normal.
- Add up the Above's, Below's and Normal's. During an El Niño, are temperatures most likely to be above, normal or below normal? Why do you think so? Compare your results with the chances given by NIWA in the table above.
- Complete this statement for spinning the El Niño pie chart 30 times: I expect to get ___ Above, ___ Normal and ___ Below when I spin the El Niño wheel 30 times.
- Spin the El Niño wheel 30 times and record your results. Compare your actual results with what you expected to get. Why did you get different results?
- Explain how a ten-sided die can be used to simulate the probabilities of each category of summer temperatures occurring in Invercargill in an El Niño year.
ENSO does not have the same affect in all parts of New Zealand. The pie charts for Auckland's summer temperatures are shown below:
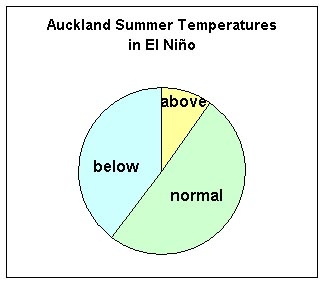
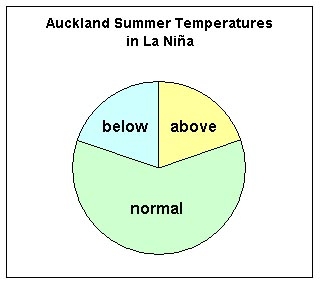
- Complete the following sentences: In Auckland the summer temperatures are more likely to be ________ in an El Niño and there is a ________ chance that they will be above normal in a La Niña.
- Using the pie charts above complete the following table of probabilities for Auckland:
El Niño La Niña Above normal __% __% Normal __% __% Below normal __% __%
Teacher Information
Objectives
By the end of this activity students will be able to:
- [S5.6] Use data displays and measures to compare data associated with different categories.
- [S5.7] Make statements about time-related variation.
- [S5.9] Determine probabilities of events based on observation of long-run relative frequency.
- [S5.10] Predict the outcome of a simple probability experiment, test it, and explain the results.
- [S6.8] Use tables of data from social contexts to find the probability of everyday events or the proportion of outcomes in a given category.
- [DL&R] Interpret information and results in context.
Resources
Student’s worksheet Scissors, split-pin, washer Copy of El Niño pie chart photocopied on to card to make spinner OR a 10-sided die using faces 0-2 representing Above, 3-5 Normal, and 6-9 Below
Answers to ENSO graph:
- For an El Niño event the shading on the graph is below the horizontal axis. For La Niña the shading on the graph is above the horizontal axis.
- The last El Niño occurred in 1997/1998 and lasted just over a year. (This statement was written in mid-2001.)
- The SOI ranged from 0 to -2.9
- You would predict a weakening La Niña. Another weak La Nina summer did occur.
Answers to Questions:
- Answers will vary. The answers should make students aware that each spin is a separate event.
- Answers will vary but the three categories should total 100. Results will not agree with the table in most cases. The Below category should have the highest score. During El Niño summer temperatures are more likely to be below normal in Invercargill
- I expect to get 9 Above, 9 Normal and 12 Below when I spin the El Niño wheel 30 times.
- Results should be very close. The result of each spin is independent of the result of the previous spin. Differences can be explained by the small number of trials. In the long run we would expect to get the given probabilities.
- In Auckland the summer temperatures are more likely to be normal or below in an El Niño. There is a 20% chance that they will be above normal in a La Niña.
- The correct percentages are:
El Niño La Niña Above normal 10% 20% Normal 50% 60% Below normal 40% 20%
Resource prepared by Lesley Mackintosh RSNZ Teacher Fellow 2001, NIWA