How do I create a graph?
Using Microsoft® Excel is easy because the Chart Wizard does all the work for you!
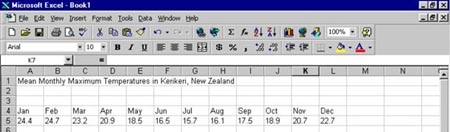
- Simply enter the data for your data table.
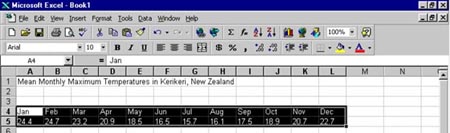
- Highlight the cells you want to graph.
- Click on the Chart Wizard icon on the Tool Bar.
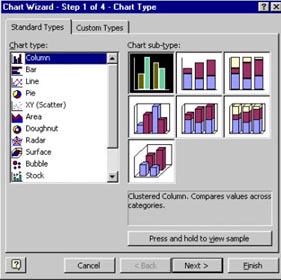
- Select the chart type you want to use and click Next.
- Click Next to confirm the range of cells.
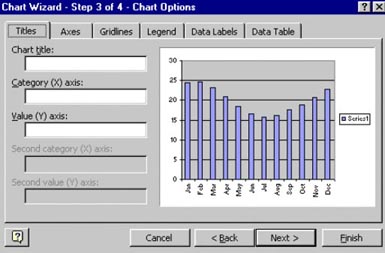
- Give your graph a title, label x- and y-axis and click Next.
- Click on the gridlines tab to remove or add gridlines.
- Click Finish and graph is complete!

Help, my graph is too small!
When the chart wizard creates your graph it will probably be too small and may be hard to read. You can resize your graph by clicking on it and using one of the corner squares to resize it.
Help, I can't see all the numbers on the y-axis scale!
Excel will usually select the major scale unit as 10 or 5. Unfortunately this means that reading temperature differences of one or two degrees is quite difficult. You will need to change the y-axis scale to 2 for every graph you create. This will enable you to read differences in temperature clearly. To do this
- Right click over the y-axis scale
- Select format axis
- Change major unit to 2
- Click OK
Help, I can't see all the months on the x-axis scale!
If you cannot see all the months of the year along the x-axis don't panic! There are two ways of fixing this problem. Either
- Resize your graph by clicking on it and using one of the corner squares to stretch it horizontally.
Or if you don't want to alter the size of your graph you can
- Right click over the x-axis scale
- Select Format Axis
- Select Font
- Change the font size to 10 or smaller
- Click OK
Remember to do this for every graph you create.
Does my graph need a key?

If you are comparing two types of information on a graph, e.g.: the favourite food of boys and the favourite food of girls, it would be useful to have a key like the graph below:
For this activity you are not comparing two sets of data on one graph, so a key is not necessary. To delete your key
- Right click on key
- Select clear
How do I remove the gridlines?
If you wish to remove the gridlines, right click on a gridline and select clear.
How do I remove the background shading?
To remove the background shading, right click in this area and select clear.
How do I copy and paste data from one page to another?
You can copy and paste data from one page to another very easily
- Highlight the text or data you wish to copy
- Go to Edit on the Tool Bar
- Select Copy
- Click where you would like the text or data to be entered, (this may be in another document, e.g. a document in Microsoft® Word)
- Go to Edit on the Tool Bar
- Select Paste
Another quicker way of doing this is to use the keyboard
- Highlight the text or data you wish to copy
- Using your keyboard select CTRL and C simultaneously
- Click where you would like the text or data to be entered
- Using your keyboard select CTRL and V simultaneously
Microsoft® Excel is a registered trademark of the Microsoft Corporation Screen shots reproduced by permission Microsoft Corporation
Resource prepared by Lesley Mackintosh RSNZ Teacher Fellow 2001, NIWA