El Niño maps and charts
Our climate scientists have prepared some maps and charts to graphically show the impact of past El Niño and La Niña events.
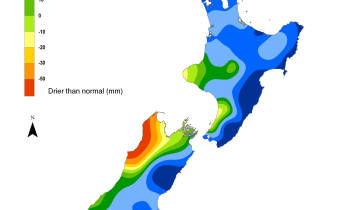
El Niño summer rainfall anomaly maps
Summer rainfall during previous El Niño events was lower than normal across large parts of New Zealand, but especially in the north and east of both islands. Follow the link below to see which regions are typically drier and which are wetter during El Niño and La Niña summers.
View summer rainfall anomaly maps for previous El Niño events
Chance of above normal rainfall during El Niño and La Niña
These maps show the probabilities of above normal rainfall during La Niña and El Niño for each season.
View maps showing rainfall patterns for El Niño and La Niña in New Zealand