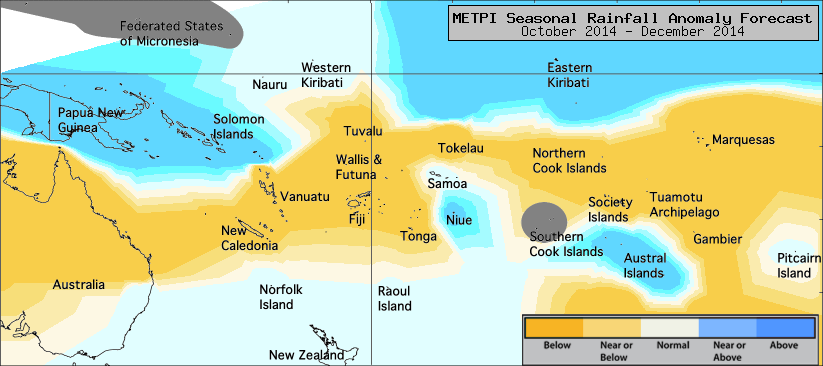
The dynamical model forecasts indicate again this month that several Island groups in the Pacific south of the Equator are likely to receive less rainfall than normal during the October to December 2014 season.
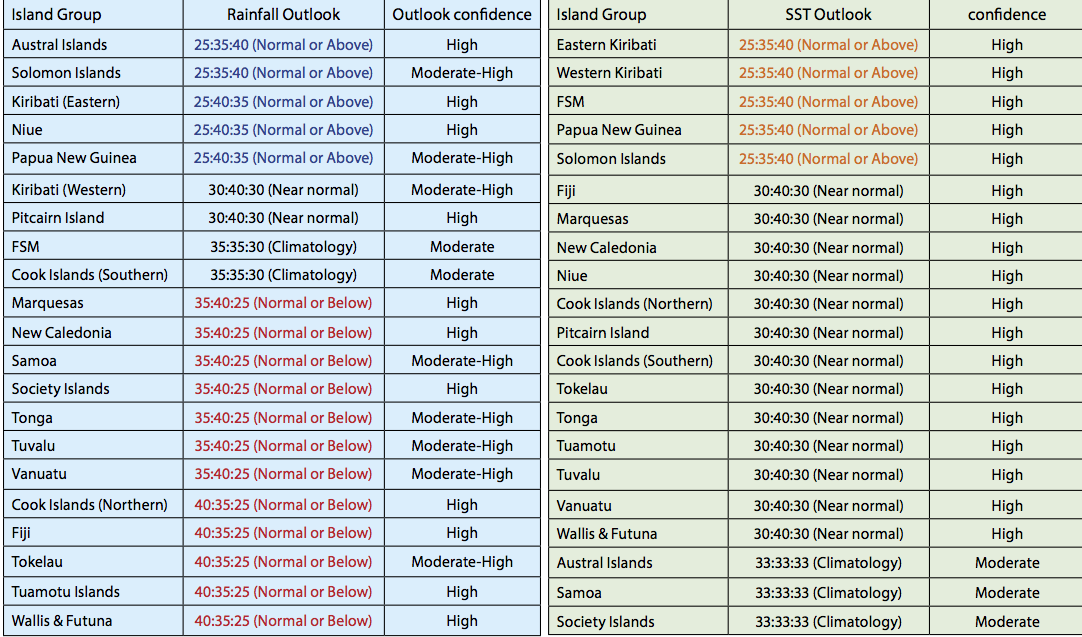
Normal or below normal rainfall is forecast for the Marquesas, New Caledonia, Samoa, the Society Islands, Tonga, Tuvalu, Vanuatu, the Northern Cook Islands, Fiji, Tokelau, the Tuamotu archipelago and Wallis & Futuna.
Normal or above normal rainfall is forecast for the Austral Islands, the Solomon Islands, Eastern Kiribati, Niue and Papua New Guinea.
Near normal rainfall is expected for Western Kiribati and Pitcairn Island.
No clear guidance is available for the Federated States of Micronesia and the Southern Cook Islands.
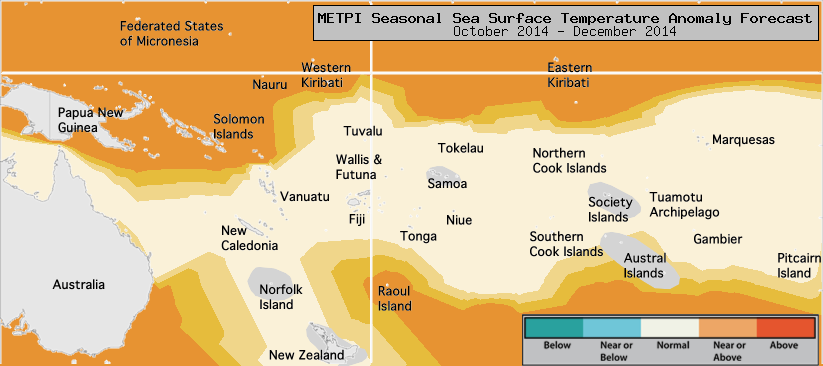
The global model ensemble forecast for SSTs indicate higher than normal SSTs over the whole Equatorial Pacific. The models also indicate warmer than normal conditions to the east of New Zealand at subtropical and mid-latitudes, despite recent observations showing a weakening of the anomalies in the same region.
Near normal SSTs are forecast for Fiji, the Marquesas, New Caledonia, Niue, the Northern and Southern Cook Islands, Pitcairn, Tokelau, Tonga, the Tuamotu archipelago, Tuvalu, Vanuatu and Wallis & Futuna.
Near normal SSTs are forecast for Fiji, the Marquesas, New Caledonia, Niue, the Northern and Southern Cook Islands, Pitcairn, Tokelau, Tonga, the Tuamotu archipelago, Tuvalu, Vanuatu and Wallis & Futuna.
No guidance was available this month for the Austral Islands, Samoa and the Society Islands.
The confidence for the rainfall outlook is generally high. Climatological probabilities for the Federated States of Micronesia and the Southern Cook Islands are typically associated with moderate confidence.
The average region– wide hit rate for rainfall forecasts issued in September is 66 %, two points higher than the average for all months combined.
Confidence for the SST forecasts is generally high.
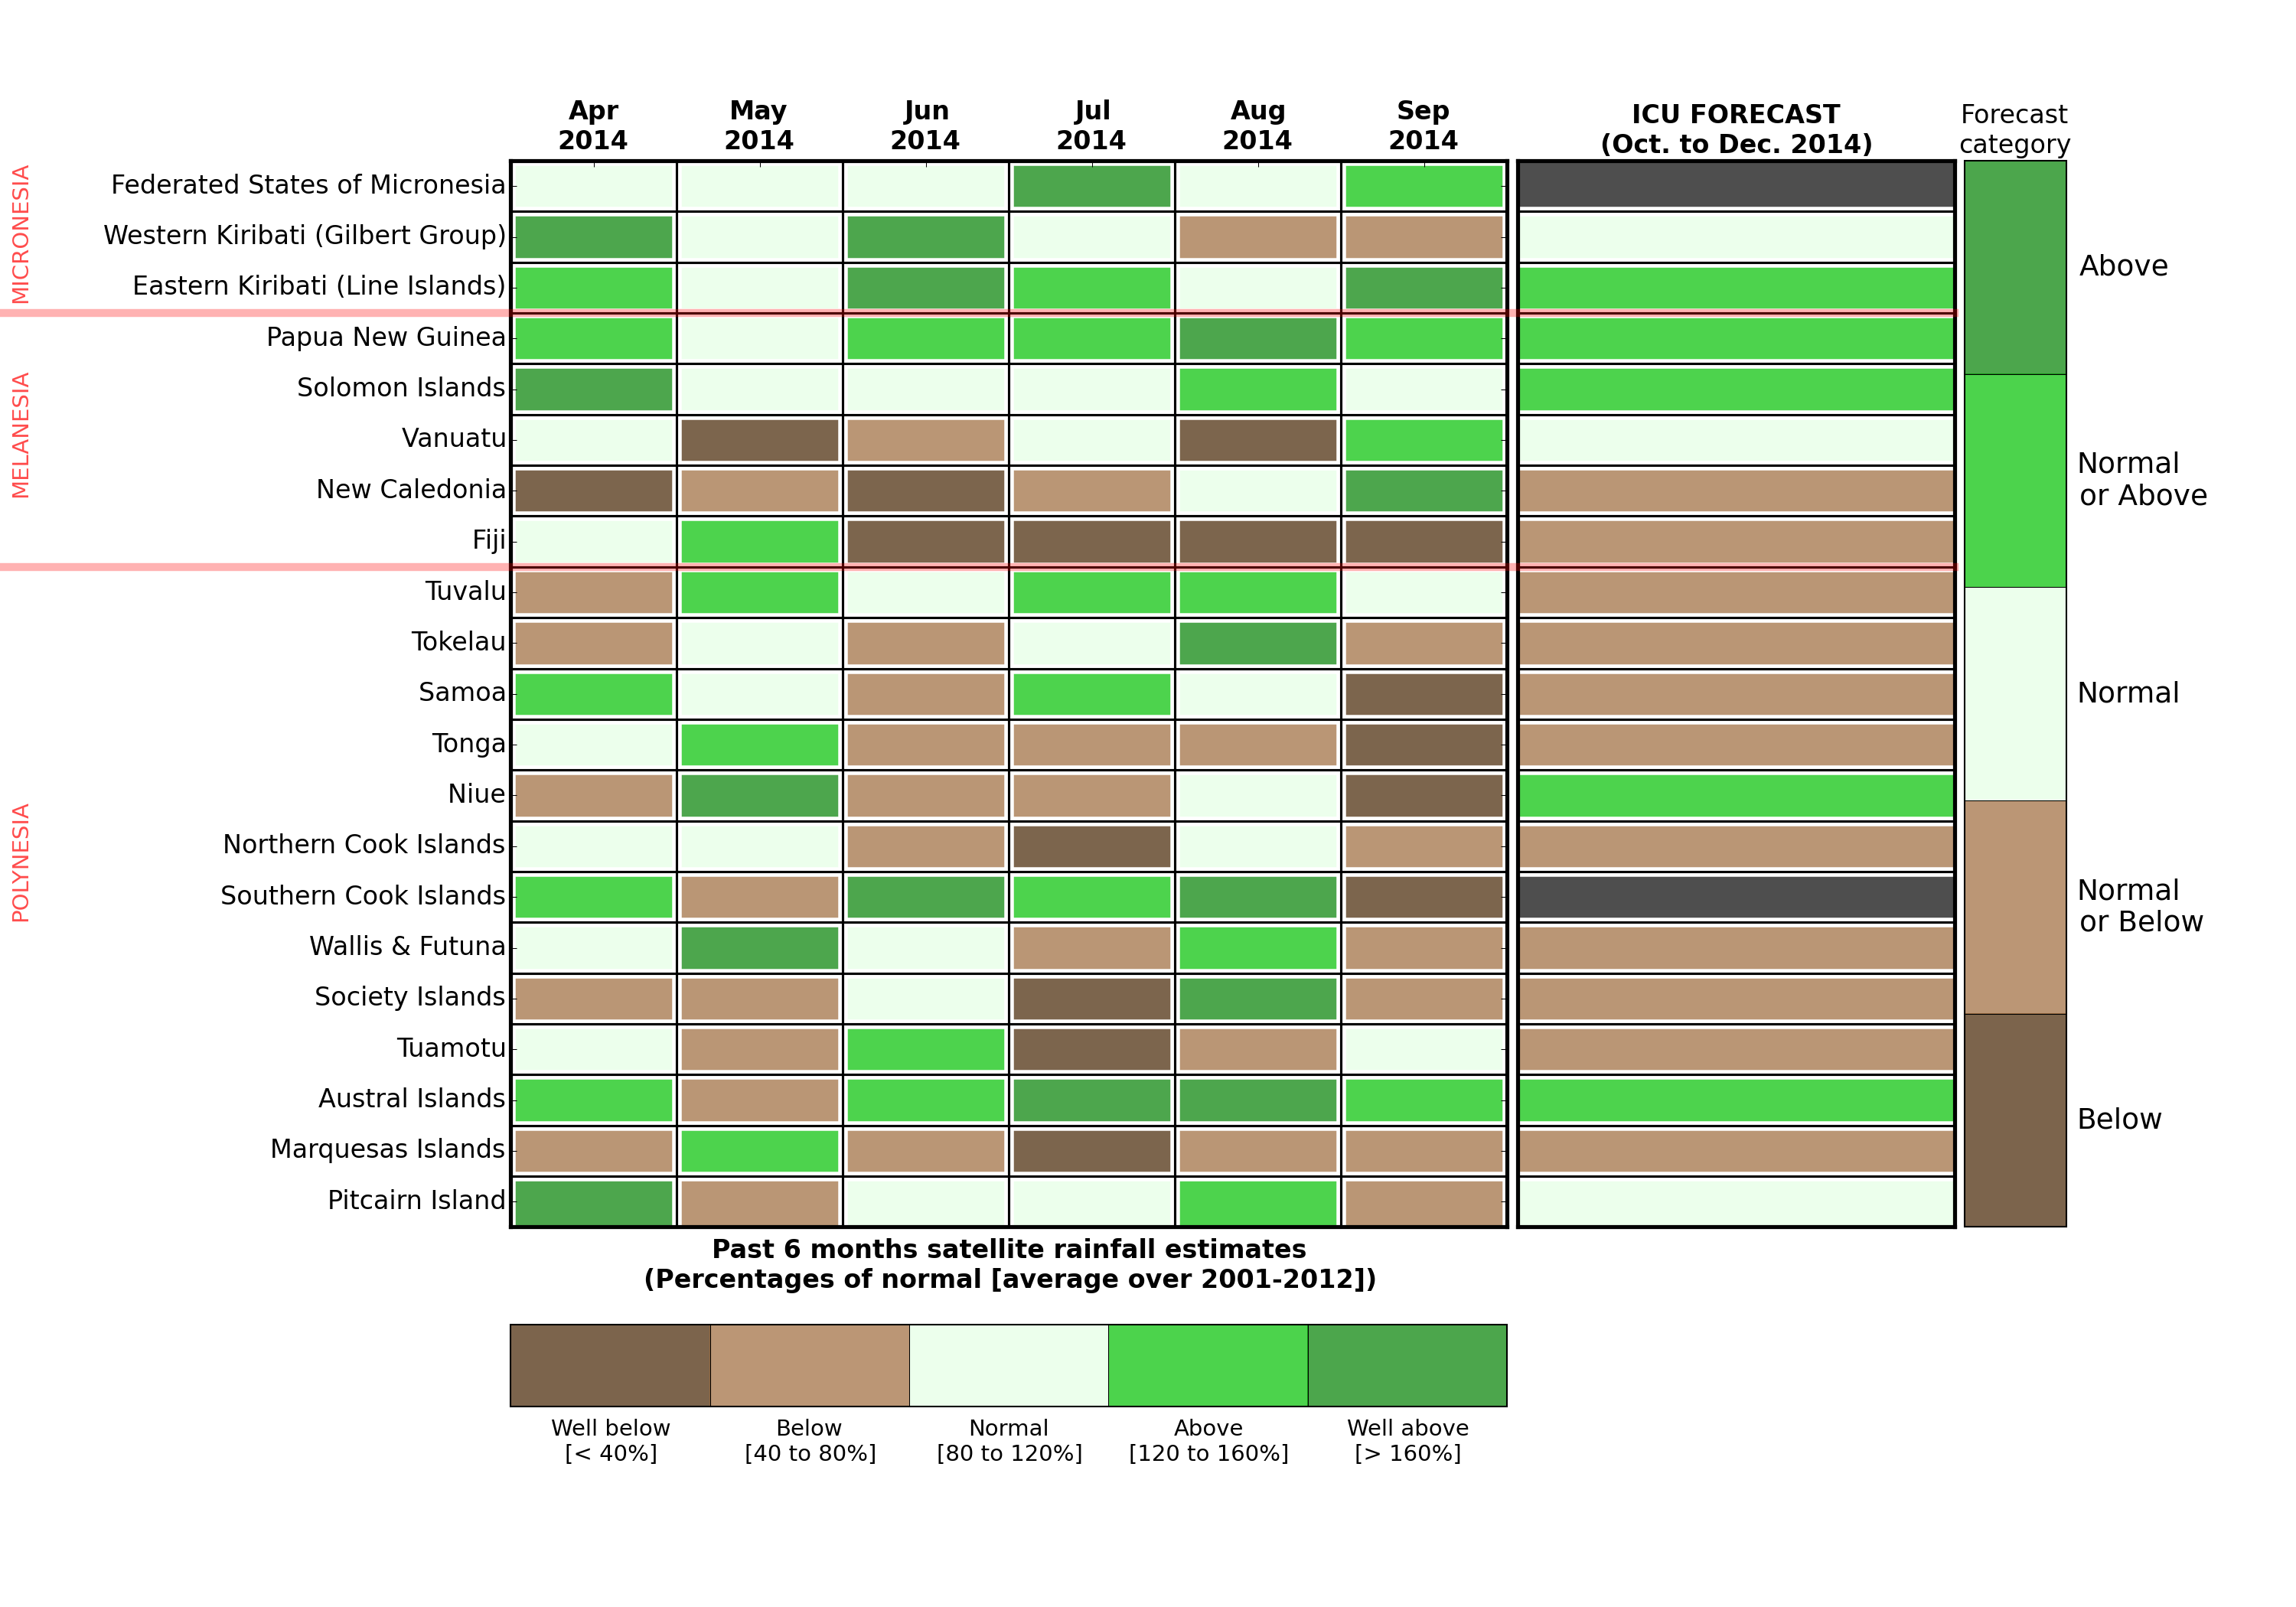
The figure on the bottom right presents the last six months rainfall anomalies for each Island group alongside the latest ICU rainfall forecast for the October-December 2014 period.
The past 6 months rainfall anomalies are based on the near-real-time TRMM (Tropical Rainfall Measurement Mission) merged satellite product available from http://trmm.gsfc.nasa.gov. The data has been downloaded and available on the link below:
For each Island group, the monthly value is derived from the average of all grid-points (or "pixels") in the TRMM Dataset that intersect a coastline, to ensure that the values correspond as closely as possible to rainfall on land, and excluding rainfall falling on ocean surfaces.
The climatology used has been established over the 2001 – 2012 period. The categories ("Well-below", "Below", etc) are determined according to the percentage of the normal rainfall for that month. The thresholds are indicated in the colorbar at the bottom: to give an example, "Well-below" normal rainfall means the rainfall for that month was under 40 % of the normal rainfall, "Below" normal rainfall means that between 40 and 80 % of normal rainfall was received, etc.
IMPORTANT NOTE:
Please note that, while we use the same color-scheme for the past rainfall anomalies and the ICU forecast, the type of information presented is different. In the case of the past 6 months, actual rainfall has been estimated by satellite, and the categories are well-defined by monthly estimated rainfall compared to the long-term mean. The ICU forecast, on the other hand, is probabilistic: it indicates the likelihood (percentage chance) of rainfall being at, above, or below normal for the season as a whole. When the percentage chances in two categories are close to each other, we indicate both categories: for example if the forecast is for 35 % chance of receiving below rainfall, and 40 % chance of normal rainfall, the outcome is "Normal or below".